
Abstract
Stem cells in vivo can transit between quiescence and activation, two metabolically distinct states. It is increasingly appreciated that cell metabolism assumes profound roles in stem cell maintenance and tissue homeostasis. However, the lack of suitable models greatly hinders our understanding of the metabolic control of stem cell quiescence and activation. In the present study, we have utilized classical signaling pathways and developed a cell culture system to model reversible NSC quiescence and activation. Unlike activated ones, quiescent NSCs manifested distinct morphology characteristics, cell proliferation, and cell cycle properties but retained the same cell proliferation and differentiation potentials once reactivated. Further transcriptomic analysis revealed that extensive metabolic differences existed between quiescent and activated NSCs. Subsequent experimentations confirmed that NSC quiescence and activation transition was accompanied by a dramatic yet coordinated and dynamic shift in RNA metabolism, protein synthesis, and mitochondrial and autophagy activity. The present work not only showcases the broad utilities of this powerful in vitro NSC quiescence and activation culture system but also provides timely insights for the field and warrants further investigations.
Introduction
In mammals, adult neurogenesis is vital for brain homeostasis, and deficits in adult neurogenesis could result in accelerated aging and/or diseased states1–3. During adult neurogenesis, neural stem cells (NSCs) proliferate and give rise to newborn neurons. However, in the adult central nervous system, most NSCs remain in a quiescent state 3 . Upon activation by microenvironmental stimuli, these quiescent NSCs can re-enter the cell cycle, proliferate, migrate, and differentiate3,4. Maintaining a balance between quiescent and activated NSCs is crucial for tissue regeneration, repair, and homeostasis. Unlike their activated counterparts, quiescent stem cells exhibit cell cycle arrest with diploid DNA content, condensed chromosomes, decreased ribosomal RNA synthesis, reduced protein translation, and enhanced stress resistance3,5. Both signaling, such as bone morphogenetic protein (BMP) and Wnt pathways, and nutrients, for example, glucose and nucleotides, play important roles in NSC quiescence and activation transition, suggesting different levels of extrinsic interaction and intrinsic metabolism between activated and quiescent NSCs5,6.
Metabolism exerts a profound influence on every aspect of cellular activity and assumes key roles in physiology and pathology7,8. It oversees the synthesis of vital biomolecules like proteins, carbohydrates, lipids, and nucleic acids, which serve as the building blocks for cell structure and function9,10. Metabolic studies help in unraveling the complex biochemical pathways involved in biosynthesis, vital for understanding cellular growth, repair, and replication9,10.
For metabolism studies, cell lines and/or primary cells are often used with cellular models at different levels of metabolic activities examined and compared 11 . However, these models frequently involve cells from different cell lines, potentially introducing unwanted variations and/or unknown confounding factors. Activated and quiescent NSCs represent distinct states of the same cells, thus minimizing unwanted variations and mitigating unknown confounding factors12,13. Therefore, we sought to establish a reversible activation and quiescence culture system and expect this system should serve as a powerful platform for dissecting cell metabolism and its dynamics.
In the present study, we have established a cell culture system to model reversible NSC quiescence and activation. To evaluate the differences between quiescent and activated NSCs, morphology characteristics, cell proliferation, cell cycle progression, and cell differentiation were investigated in detail. RNA sequencing (RNA-seq) analysis was used to systematically profile activated and quiescent NSCs, revealing significant metabolic differences. Subsequent experimentations confirmed that NSC quiescence and activation transition was accompanied by a coordinated dynamic shift in RNA metabolism, protein synthesis, and mitochondrial and autophagy activity.
Materials and Methods
Cell Culture
Hippocampal NSCs (HCN), a widely used NSC line originated from rattus hippocampus,14,15 was maintained with the Dulbecco’s Modified Eagle Medium/Nutrient Mixture F12 (DMEM/F12; Invitrogen, 11320-033; Massachusetts, USA) supplemented with 1% N2 supplement (Invitrogen, 17502-048), 1% Glutamax (Invitrogen, 25030-081), 1% penicillin-streptomycin (Invitrogen,15140-122), and 20 ng/ml basic fibroblast growth factor (bFGF) (Humanzyme, HZ-1271; Illinois, USA). The culture plates were coated with poly-L-ornithine (Sigma, P3655; Michigan, USA) and mouse laminin (Invitrogen, 23017-015) 15 .
Flow Cytometry Cell Cycle Analysis
One million cells were collected in 15-ml corning tubes, and after centrifugation, they were re-suspended in 1-ml phosphate-buffered saline (PBS), followed by fixation with 4 ml of cold 75% ethanol and stored at −20°C until further analysis. For cell cycle analysis, cell samples were stained in 400 μl of 500-ng/ml propidium iodide (PI) in PBS for 15 min at room temperature (RT), with the data collected on FACSVerse (BD; New Jersey, USA) and analyzed with FlowJo software (Tree Star; Oregon, USA). For cell division speed analysis, we strictly followed the procedures of CellTrace Violet Cell Proliferation Kit (Thermo Fisher, C34571; Massachusetts, USA) and analyzed with FlowJo software (Tree Star).
Flow Cytometric Cell Cycle Analysis With Hoechst and Pyronin Y Staining
HCN cells were trypsinized and harvested, followed by centrifugation at 500 × g for 5 min. Cell pellets were subsequently re-suspended gently in 100 µL of PBS. For fixation, cold (−20°C) 75% ethanol was added dropwise to the cell suspension. Cell staining procedures involved incubation with 0.5-μg/mL Hoechst 33258 in 300 µL of PBS at RT for 15 min, followed by staining with 0.5-μg/mL Pyronin Y on ice for 20 min.
Immunofluorescence Staining
HCN cells were fixed with 4% PFA for 15 min permeabilized by 0.1% Triton-X100 in PBS for 30 min and blocked with 5% bovine serum albumin (Solarbio; Beijing, China) in 1× PBS at RT. Primary antibodies (anti-Ki67 and anti-Bromouridine-triphosphate [BrUTP], Rabbit, Thermo Fisher) were diluted per manufacturer protocol and added for 24-h incubation at 4°C. Secondary antibodies (Jackson Immuno Research) were diluted in PBS containing 2.5% bovine serum albumin at 1:1000 and incubated for 2 h at RT.
For BrdU studies, HCN cells were first incubated with BrdU (10 μM) for 1 h, followed by fixation in 4% paraformaldehyde (PFA). Subsequently, they were treated with 2 N HCl at 37 °C for 30 min and neutralized with 0.1 M borate for 10 min at RT before blocking. Staining of cells was performed following established protocols 16 . Nuclei staining DAPI was used as counterstaining, and all images were taken on a Nikon ECLIPSE TI microscope.
Differentiation Assays
Differentiation assays were done following established protocols 17 . Briefly, to initiate cellular differentiation, cells were seeded into four-well chamber slides at a density ranging from 55,000 to 75,000 cells per well. Following seeding, cells were allowed to proliferate in a culture medium composed of insulin-supplemented N2 (Invitrogen) and DMEM/F12 (Invitrogen), containing 20 ng/ml of bFGF for a period of 24 h. Subsequently, bFGF was removed, and cells were subjected to specific differentiation protocols. For neuronal differentiation, the protocol involves 1-μM retinoic acid (RA) and 5-μM forskolin (Sigma-Aldrich; Missouri, USA) for 4 days; and for astrocytic differentiation, the protocol utilizes a combination of 50 ng/ml leukemia inhibitory factor (CHEMICON International, Inc.; California, USA) and 50 ng/ml BMP4 (Humanzyme) for 6 days. For oligodendrocytic differentiation, cells were detached using trypsin, washed with 1× PBS, and re-plated into insulin-free N2 medium. Cells were then treated with either 500 ng/ml of human recombinant insulin-like growth factor 1; Test - MedlinePlus (IGF-I) or insulin-like growth factor 2 (IGF-II; Novoprotein; Jiangsu, China), or 500 ng/ml insulin (Novoprotein) for a duration of 4 days.
BrUTP Incorporation Assay
The BrUTP assay was employed to quantify rRNA synthesis following a published protocol 16 . Briefly, HCN cells were lipofected with 1, 2-dioleoyl-3-trimethylammonium-propane (DOTAP)-BrUTP complexes (1.5 mM) suspended in media for 5 min, followed by a 15-min incubation period with the adherent cells. This was succeeded by a 1-h incubation in fresh media. The cells were then rinsed, fixed in 4% PFA for 20 min at RT, and subjected to BrUTP staining.
Cell Organelle Activity and Staining
For Golgi apparatus staining, HCN cells cultured in 24-well plates were washed briefly with PBS and then incubated with Golgi-Tracker Red (GlpBio, GC19881; California, USA) at 4°C for 30 min. After a PBS wash, the cells were switched back to the growth medium at 37°C for 30 min and then fixed for microscopic examination. For lysosome staining, NSCs were labeled with 50 nM Lyso-Tracker Red (Thermo Fisher, L7528) in serum-free DMEM at 37°C with 5% CO2 for 2 h. For mitochondria staining and activity, the MitoTracker Green FM (Thermo Fisher, M7514) permeates and selectively accumulates within mitochondria, enabling their visualization upon staining. MitoTracker Deep Red FM (Thermo Fisher, M22426) exhibits fluorescence proportional to mitochondria activity. Consequently, the red-to-green fluorescence ratio serves as a measure of mitochondrial activity. To assess both total and functional mitochondrial populations, cells underwent dual staining with MitoTracker Green FM and MitoTracker Deep Red FM. Following a 30-min incubation period with 100-nM concentrations of each dye, cellular samples were subjected to flow cytometric analysis using a BD instrument.
RNA-Seq Analysis
NSCs were seeded in six-well plates and grown under quiescent and activated conditions, and after a 72-h incubation period, they were collected for total RNA extraction with the TRIzol Reagent (Thermo Fisher). The concentration and quality of RNA were determined with the Qubit 3.0 Fluorometer (Life Technologies; California, USA) and the RNA Nano 6000 Assay Kit of the Bioanalyzer 2100 system (Agilent Technologies; California, USA). For RNA-seq, a total amount of 2 μg of RNA per sample was used for sequencing library preparation using NEBNext Ultra RNA Library Prep Kit for Illumina (NEB, #E7530L) following the manufacturer’s recommendations. The libraries were sequenced on an Illumina Hiseq 4000 platform with a 150-bp paired-end reads model (Annoroad Gene Technology; Beijing, China). After standard quality control and normalization, the fragments per kilobase of transcript per million mapped reads (FPKM) values were obtained and analyzed. An online software program (Morpheus, https://software.broadinstitute.org/morpheus) was used to perform differentially expressed gene (DEG) analysis. Online database (g:Profiler) 18 was used for Kyoto Encyclopedia of Genes and Genomes (KEGG) and gene ontology (GO) analyses.
Protein Synthesis Assay
To determine protein synthesis rates, a Click-iT Plus OPP Alexa Fluor 594 Protein Synthesis Assay Kit (Thermo Fisher Scientific) was used following the manufacturer’s instructions. For quantification, the intensity of red fluorescent light was measured by PhotoshopCS5, and the ratio of red fluorescent light to DAPI was calculated by Image J.
Autophagy Activity Assay
To evaluate autophagy activity, Adv-mRFP-GFP-LC3 (Hanbio, HB-AP2100001; Shanghai, China)-infected HCN cells were seeded and grown under quiescent and activated conditions for 2 days, and then images were taken and analyzed with a Nikon (Tokyo, Japan) ECLIPSE TI microscope. The red fluorescent protein (RFP+) cells indicated autolysosomes while the green fluorescent protein (GFP+) cells represented autophagosomes. The level of autophagy activity was designated as the ratio of RFP/GFP.
Electron Microscopy
Samples were prepared according to established protocols 19 . Briefly, HCN cells were fixed in 2% glutaraldehyde in PBS at 4°C overnight. Following fixation, cells were rinsed five times in PBS for 5 min each and then post-fixed in 1% osmium tetroxide (OsO4) for 1 h at RT. Dehydration was achieved using a graded series of acetone (30%, 50%, 70%, and 90%) with 30-min immersion per step, followed by three immersions in 100% acetone for 10 min each at RT. Subsequently, cells were infiltrated with a mixture of acetone and epon (3:7 v/v) for 2 h, followed by overnight infiltration in a 7:3 acetone:epon mixture at RT. Embedding was performed with 100% epon for 2 h, and polymerization was carried out with 100% epon at 60°C for 48 h. Sections of 70-nm thickness were cut and mounted on copper grids and then post-stained with uranyl acetate and lead citrate. Imaging was conducted using a transmission electron microscope (JEM-1230).
Statistical Analysis
Statistical comparisons were carried out using PrismGraph with two-tailed Student’s t tests when two cases were compared and with analysis of variance (ANOVA) tests when more cases were analyzed. When data did not meet normality criteria, equivalent nonparametric tests were used. Differences were considered to be significant when P values were below 0.05. Details on sample numbers and significance levels are given in figure legends. In all figures, measurements are reported as mean ± standard error of the mean (SEM).
Results
Establishment of a Quiescent NSC Culture System
HCN normally can be cultured and passaged in a DF12/DMEM medium supplemented with N2 and 20 ng/ml bFGF (growth medium). In vivo BMP signaling plays a crucial role in the maintenance of NSC quiescence 20 . To induce HCN cells into quiescence, we have probed with different combinations of bFGF and BMP4 (data not shown). The addition of BMP4 at 50 ng/ml to the growth medium greatly influenced HCN cell morphology and proliferation (Fig. 1). With (BMP4-treated) and without BMP4 (bFGF-treated), the cells manifested rather different morphologies (Fig 1A). Compared to the bFGF-treated ones, BMP4-treated HCN cells exhibited enhanced adherence, enlarged cell bodies, and nuclei with increased pseudopodia protrusion and dendrites (Fig. 1A), to some extent resembling the differences between activated and quiescent NSCs in vivo. As determined by flow cytometry cell cycle analysis, with 3-day BMP4 treatment, 88% of HCN cells stayed in the G1 phase but less than 10% stayed in S and G2 phases, unlike activated cells, of which only 42% remained in the G1 phase but over 57% in S and G2/M phases (Fig. 1B). Further Ki67 staining and BrdU incorporation assays confirmed that BMP4 induced cell cycle arrest in most HCN cells (Fig. 1C).
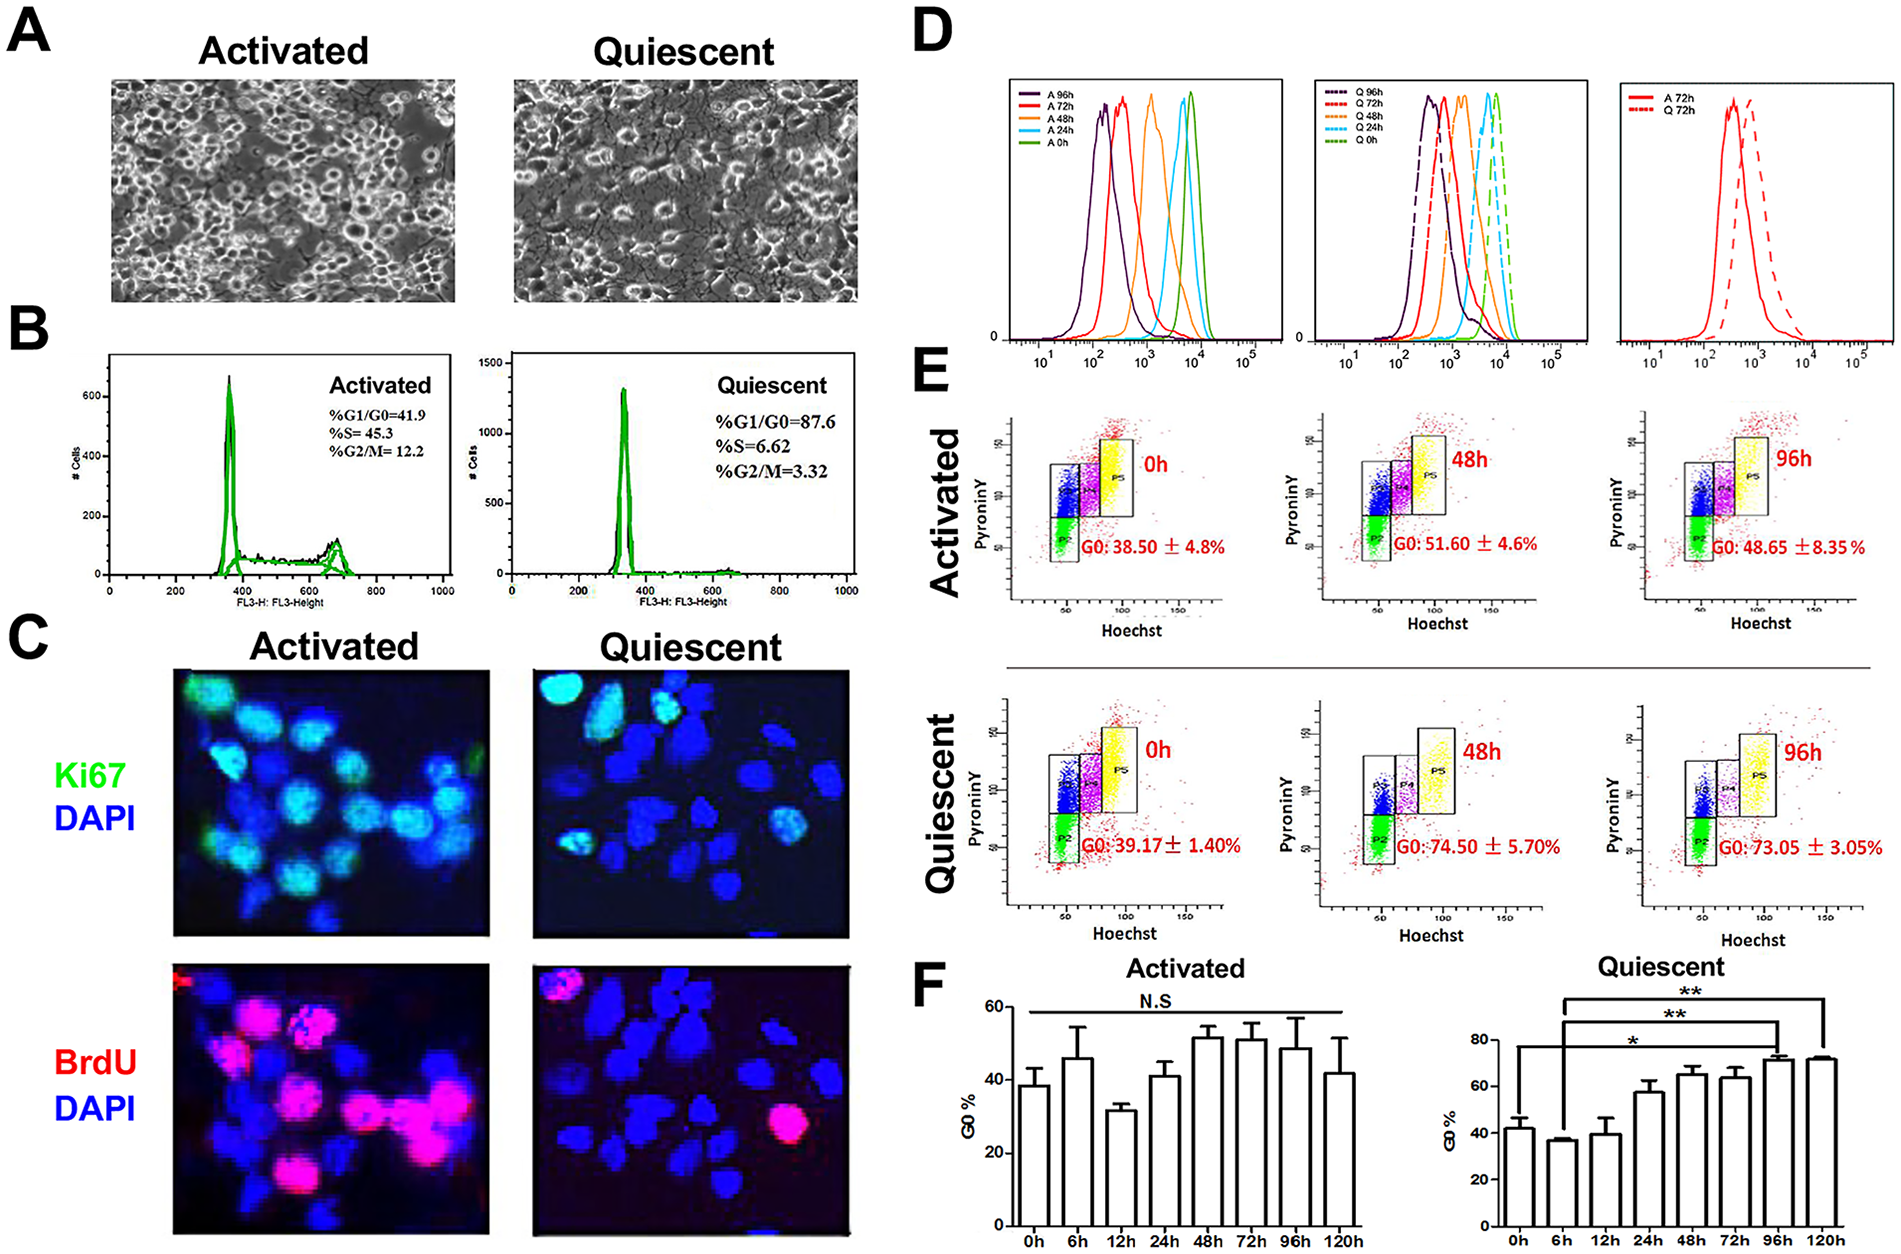
Establishment of a quiescent NSC culture system. (A) Morphological distinctions of activated and quiescent HCN cells. (B) Flow cytometry cell cycle analysis of activated and quiescent HCN cell cultures. (C) Ki67 and BrdU staining of activated and quiescent HCN cell cultures. (D) Quantitative flow cytometry cell division speed analysis of activated and quiescent HCN cell cultures over time with Celltrace Violet staining. (E and F) Quantitative flow cytometry cell quiescence analysis of activated and quiescent HCN cell cultures over time with Pyronin Y/Hoechst staining to distinguish G0 from G1. P-values are denoted as follows: *P < 0.05; **P < 0.01; ***P < 0.001.
To further probe the transition process, we decided to perform a time-course analysis and collected cell samples at 0, 24, 48, 72, and 96 h. Then the fluorescence signal of Celltrace Violet staining, indicative of cell division progression, was quantified using flow cytometry. The fluorescence intensity with HCN cells under both conditions declined with time as cells divided (Fig. 1D). But the intensity decreased much more rapidly with bFGF-treated cells, and there was a 2- to 10-times higher intensity, as shown for 72 h, with those BMP4-treated ones. By 96 h, essentially the intensity with all the bFGF-treated cells fell below 103, a large part below 102, and some even approaching 101, strongly suggesting at least one or more rounds of cell divisions. In contrast, the intensity with essentially all BMP4-treated cells was above 102, a considerable part above 103, and some even approaching 104, strongly implying a gradual cell cycle–arrest process (Fig. 1D).
Quiescent cells have lower levels of RNA than activated ones. To distinguish between G1 and G0 phases and determine whether HCN cells entered a quiescence-like state with BMP4 treatment, we further performed flow cytometry cell cycle analysis with Hoechst (DNA staining) and Pyronin Y (RNA staining in the presence of Hoechst) double staining. As determined by the flow cytometry cell cycle analysis with Hoechst and Pyronin Y staining, upon BMP4 treatment, the gradual entry into a quiescence-like state was obvious (Fig. 1E, F). HCN cells gradually exited the cell cycle and entered a quiescence-like state as demonstrated by increasing G0 with time (Fig. 1E, F). Starting from 48 h, about 75%–80% of BMP4-treated cells entered quiescence and persisted in the G0 phase. In contrast, only 50%–55% of bFGF-treated HCN cells resembled G0 cells with a low level of PY incorporation, likely at least partially due to local confluency and contact inhibition, especially at later time points (Fig. 1E, F). From hereon, we designated BMP4-treated cells as quiescent cells and bFGF-treated cells as activated cells.
Reversible NSC Quiescence and Activation Transition In Vitro
Stem cells in vivo could reversibly shift between quiescence and activation without compromising their proliferation and differentiation potentials. Therefore, we sought to determine whether the quiescent culture system established here could be reverted to the cell cycle and still have triple differentiation potentials. To reversibly reactivate quiescent HCN cells, we developed a protocol to induce HCN into quiescence with a 3-day combinatorial treatment of bFGF (20 ng/ml) and BMP4 (50 ng/ml) and then withdraw BMP4 and re-feed the cells with growth medium only supplemented with bFGF for 3 to 6 days (Fig. 2A). Throughout the time, activated cells largely maintained their proliferation rate (Fig. 2A, B). In contrast, upon BMP4 treatment, HCN cells entered quiescence, and upon re-feeding with bFGF-only growth medium, quiescent NSCs progressively reactivated and re-entered cell cycle over time (Fig 2A, B). By the end, the activated and reactivated HCN cells showed essentially the same level of Ki67 and BrdU positivity, indicating quiescence induction, and reactivation did not compromise HCN cell proliferation potentials (Fig 2C, D). In contrast, quiescent HCN cells had much less Ki67 positivity and a much higher percentage of G0 cells. Further differentiation assays, as determined by Tuj1 (neuron), GFAP (astrocyte), and RIP (oligodendrocyte) staining, demonstrated that activated and reactivated HCN cells had comparable triple-differentiation potentials regardless of their activation status (Fig 2E), suggesting that quiescence induction and reactivation did not compromise their differentiation ability.
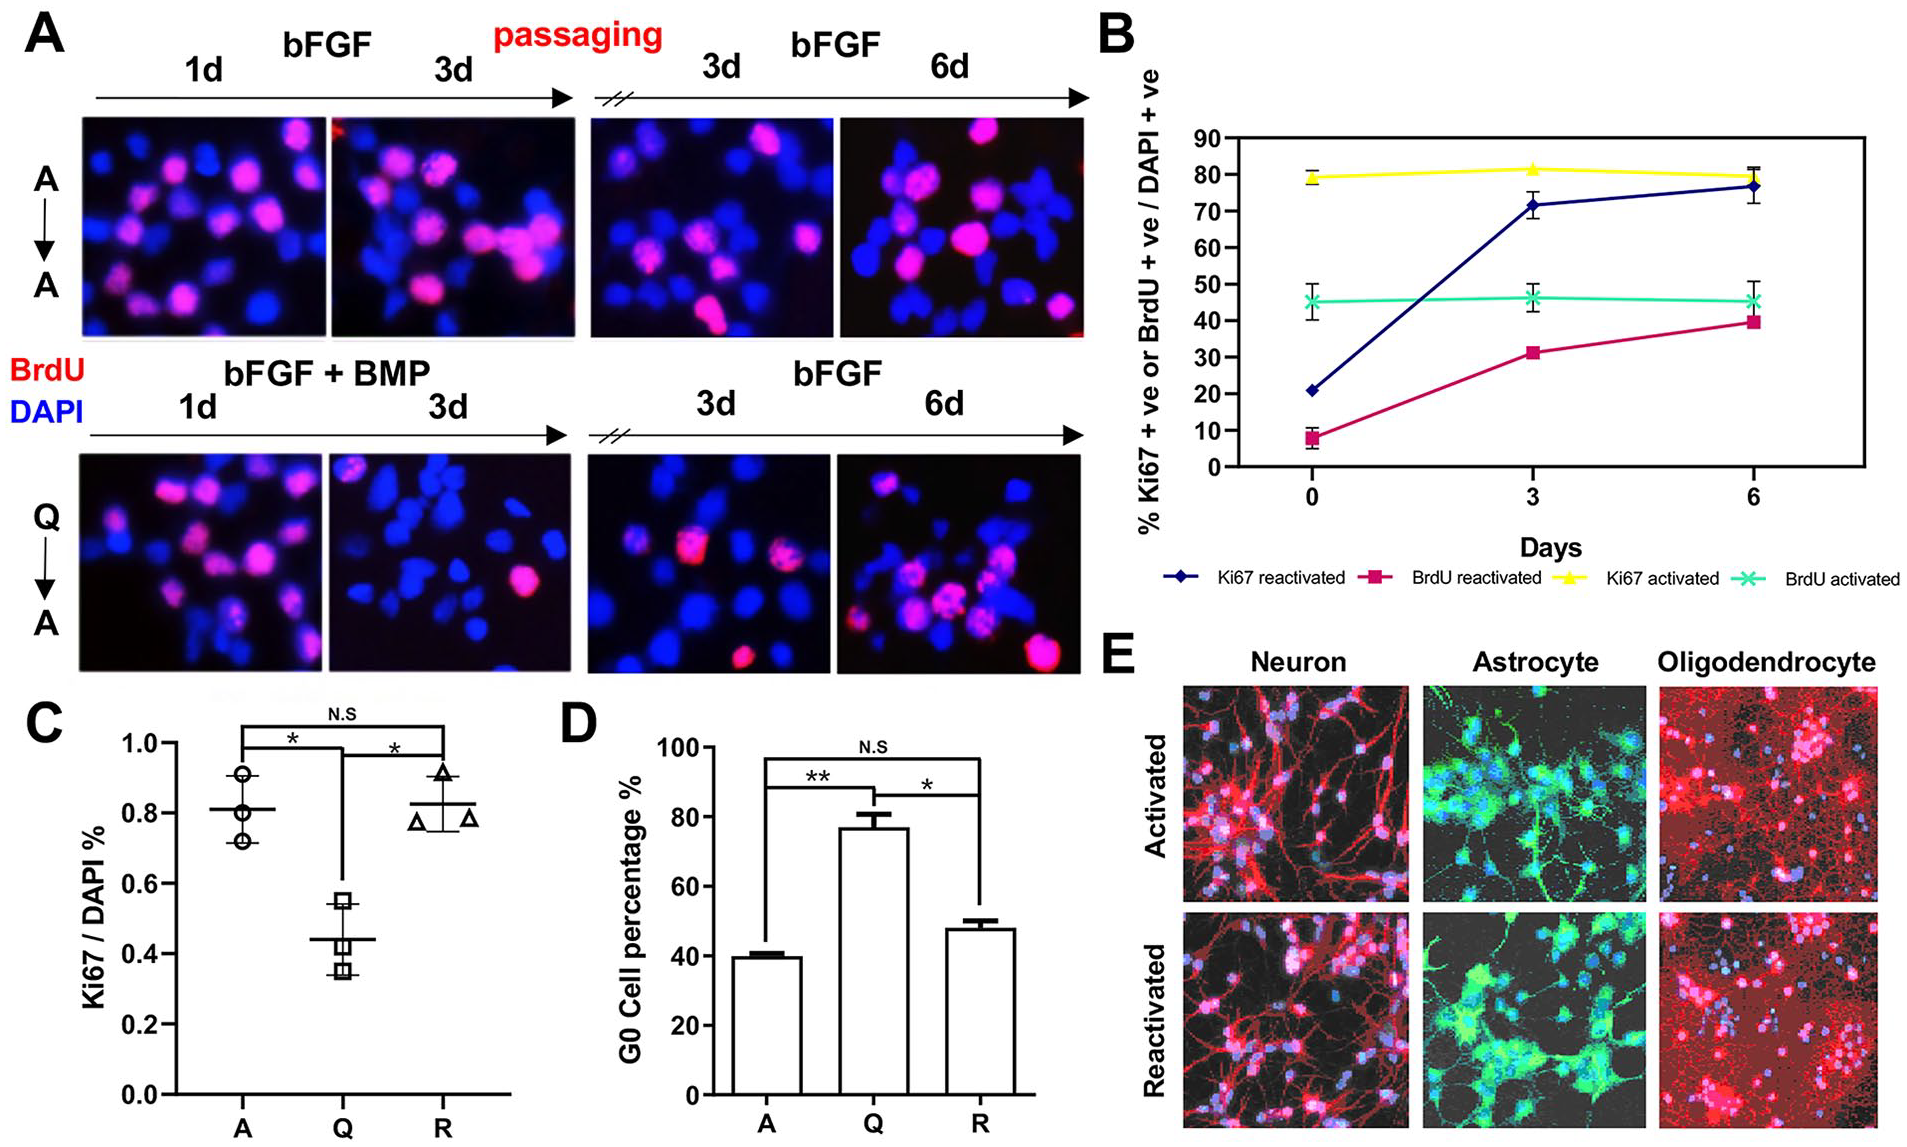
Reversible NSC quiescence and activation transition in vitro. (A and B) Representative images and quantification of Ki67/BrdU positive cells in activated and reactivated HCN cell culture over time (n = 3). (C and D) Quantification of proliferation rates and G0 in activated (A), quiescent (Q), and reactivated (R) with Ki67 immunostaining (n = 3) and with Pyronin Y/Hoechst staining (n = 3). All data are presented as the mean ± SEM values. (E) Assessment of cell-differentiation capability to neurons, oligodendrocytes, and astrocytes (Tuj1: red, RIP: green, GFAP: red). P-values are denoted as follows: *P < 0.05; **P < 0.01; ***P < 0.001.
Taken together, we have successfully established a reversible NSC quiescence and activation culture system capable of providing unlimited materials for genomic, functional, and mechanistic studies and/or screening.
Global Cell Cycle, Metabolic and Signaling Differences Between Quiescent and Activated NSC Revealed by Transcriptomic Profiling
Next, we decided to perform RNA-seq analysis to compare the differences between quiescent and activated NSCs in an unbiased manner. Differential gene expression analysis identified by a two-fold cutoff of 1,242 genes upregulated and 1,920 genes downregulated in the activated group (A1, A2), compared to the quiescent one (Q1, Q2; Fig. 3A). Further GO enrichment analysis revealed that the upregulated gene clusters in activated HCN cells were mostly associated with cell cycle and DNA damage repair, anabolic metabolism including RNA metabolism/splicing and protein translation, and cell organelles such as ribosome, spliceosome, and mitochondria, presumably both as a result of and reflecting decreasing biomaterial and energy demands otherwise needed for cell growth, proliferation, and division. Conversely, the top upregulated gene clusters in the quiescent group mostly related to cell adhesion, extracellular matrix and signaling, and cell catabolism and related organelle such as lysosome and Golgi apparatus, likely both as a result of and reflecting the decreasing biomaterial and increasing environmental surveillance demands for quiescent NSCs.
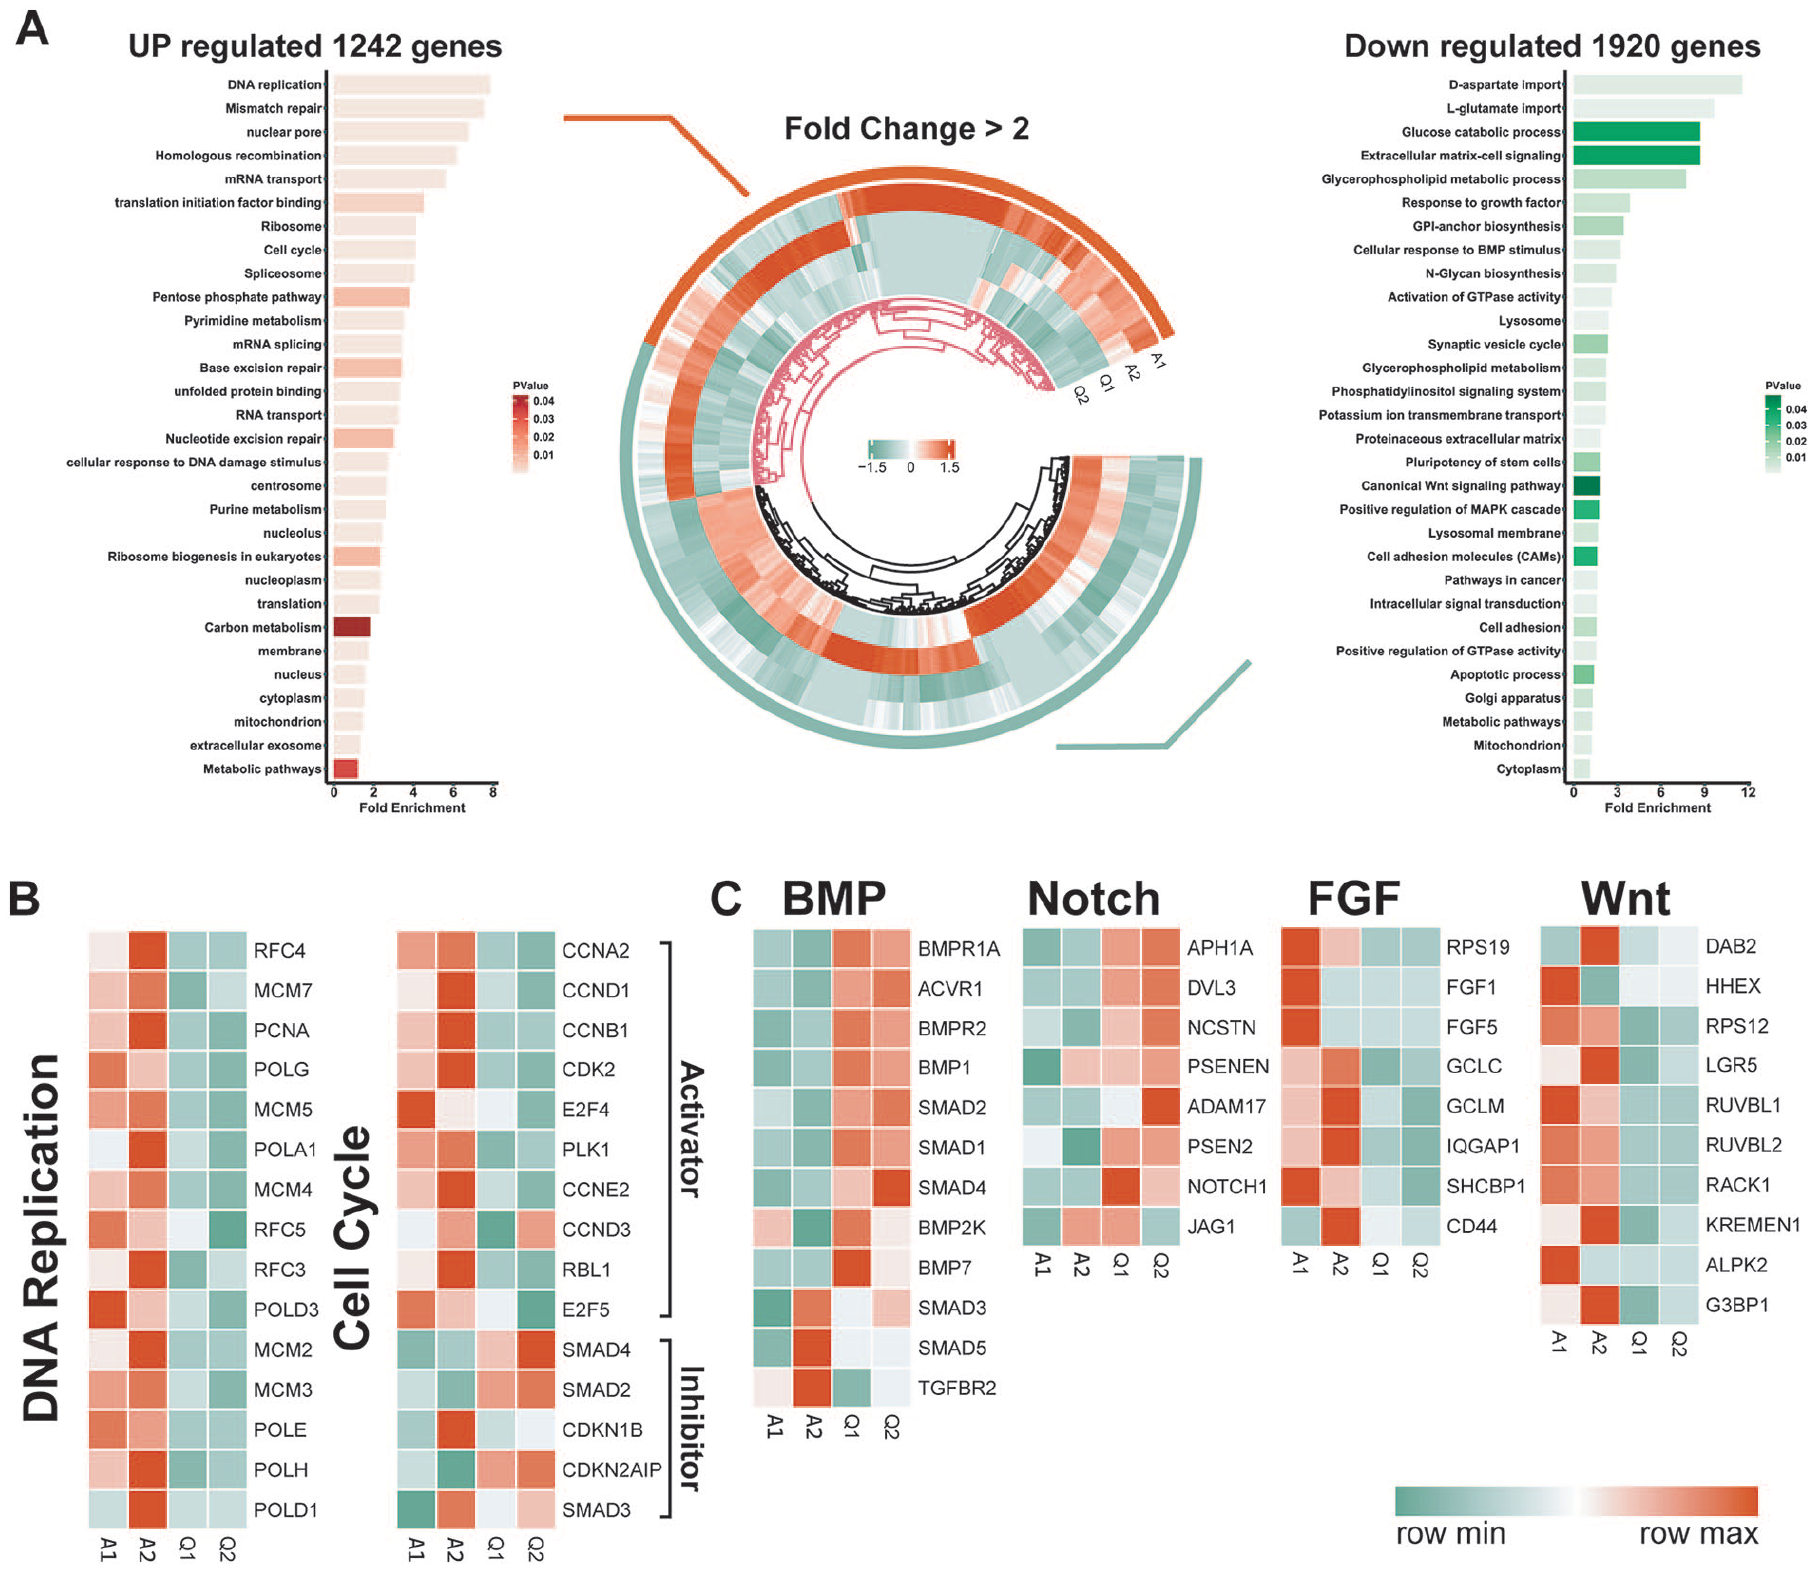
Transcriptomic profiling of quiescent and activated NSCs. (A) Circular heatmap illustrating differentially regulated gene expression from RNA-seq analysis between activated and quiescent NSCs. Gene ontology (GO) enrichment analysis of genes upregulated and downregulated in these two states of NSCs (P < 0.05). Genes upregulated and downregulated are shown in red and green, respectively. Values are presented as the log2 of tag counts. (B) Heatmap of representative DNA replication and cell cycle signaling genes in activated and quiescent HCN cells. (C) Heatmap of BMP, Notch, bFGF, and Wnt signaling genes in activated and quiescent HCN cells.
We hoped to further validate the above analysis by examining genes known to be important in stem cell quiescence and activation transition. When examined closely, DNA replication factors, DNA damage repair genes, and cell cycle activators were downregulated, and cell cycle inhibitors upregulated in quiescent HCN cells (Fig. 3B), perfect in line with the GO term enrichment results. Also as expected, BMP and Notch signaling pathways, both known to promote stem cell quiescence, were significantly upregulated in quiescent HCN cells. In contrast, bFGF and Wnt signaling pathways, both known to promote stem cell activation and proliferation, were downregulated in quiescent HCN cells (Fig. 3C). Together, these results strongly validated our transcriptomic analysis.
Quiescent NSCs Manifested Low Metabolic Activity and High Resistance to Glucose Starvation
Consistent with recent progress 5 , our transcriptomic profiling showed that stem cell quiescence and activation transition involve drastic changes in cell metabolism such as organelle genesis and activity. Therefore, we sought to take advantage of this reversible culture system to experimentally verify insights obtained from transcriptomic analysis and dissect differences between NSC quiescence and activation. Organelle-specific dyes were utilized to stain HCN cells in different states (Fig. 4A). Consistent with transcriptomic analysis, Golgi apparatus and lysosome staining was stronger in quiescent HCN cells than in the activated ones, perhaps reflecting enhanced demands needed for the removal of surplus macromolecules and organelles. On the contrary, activated HCN cells overall showed much stronger staining of MitoRed (representing mitochondrial integrity and activity) than quiescent ones, while cells in both states stained similarly with MitoGreen (a mitochondria-specific dye).
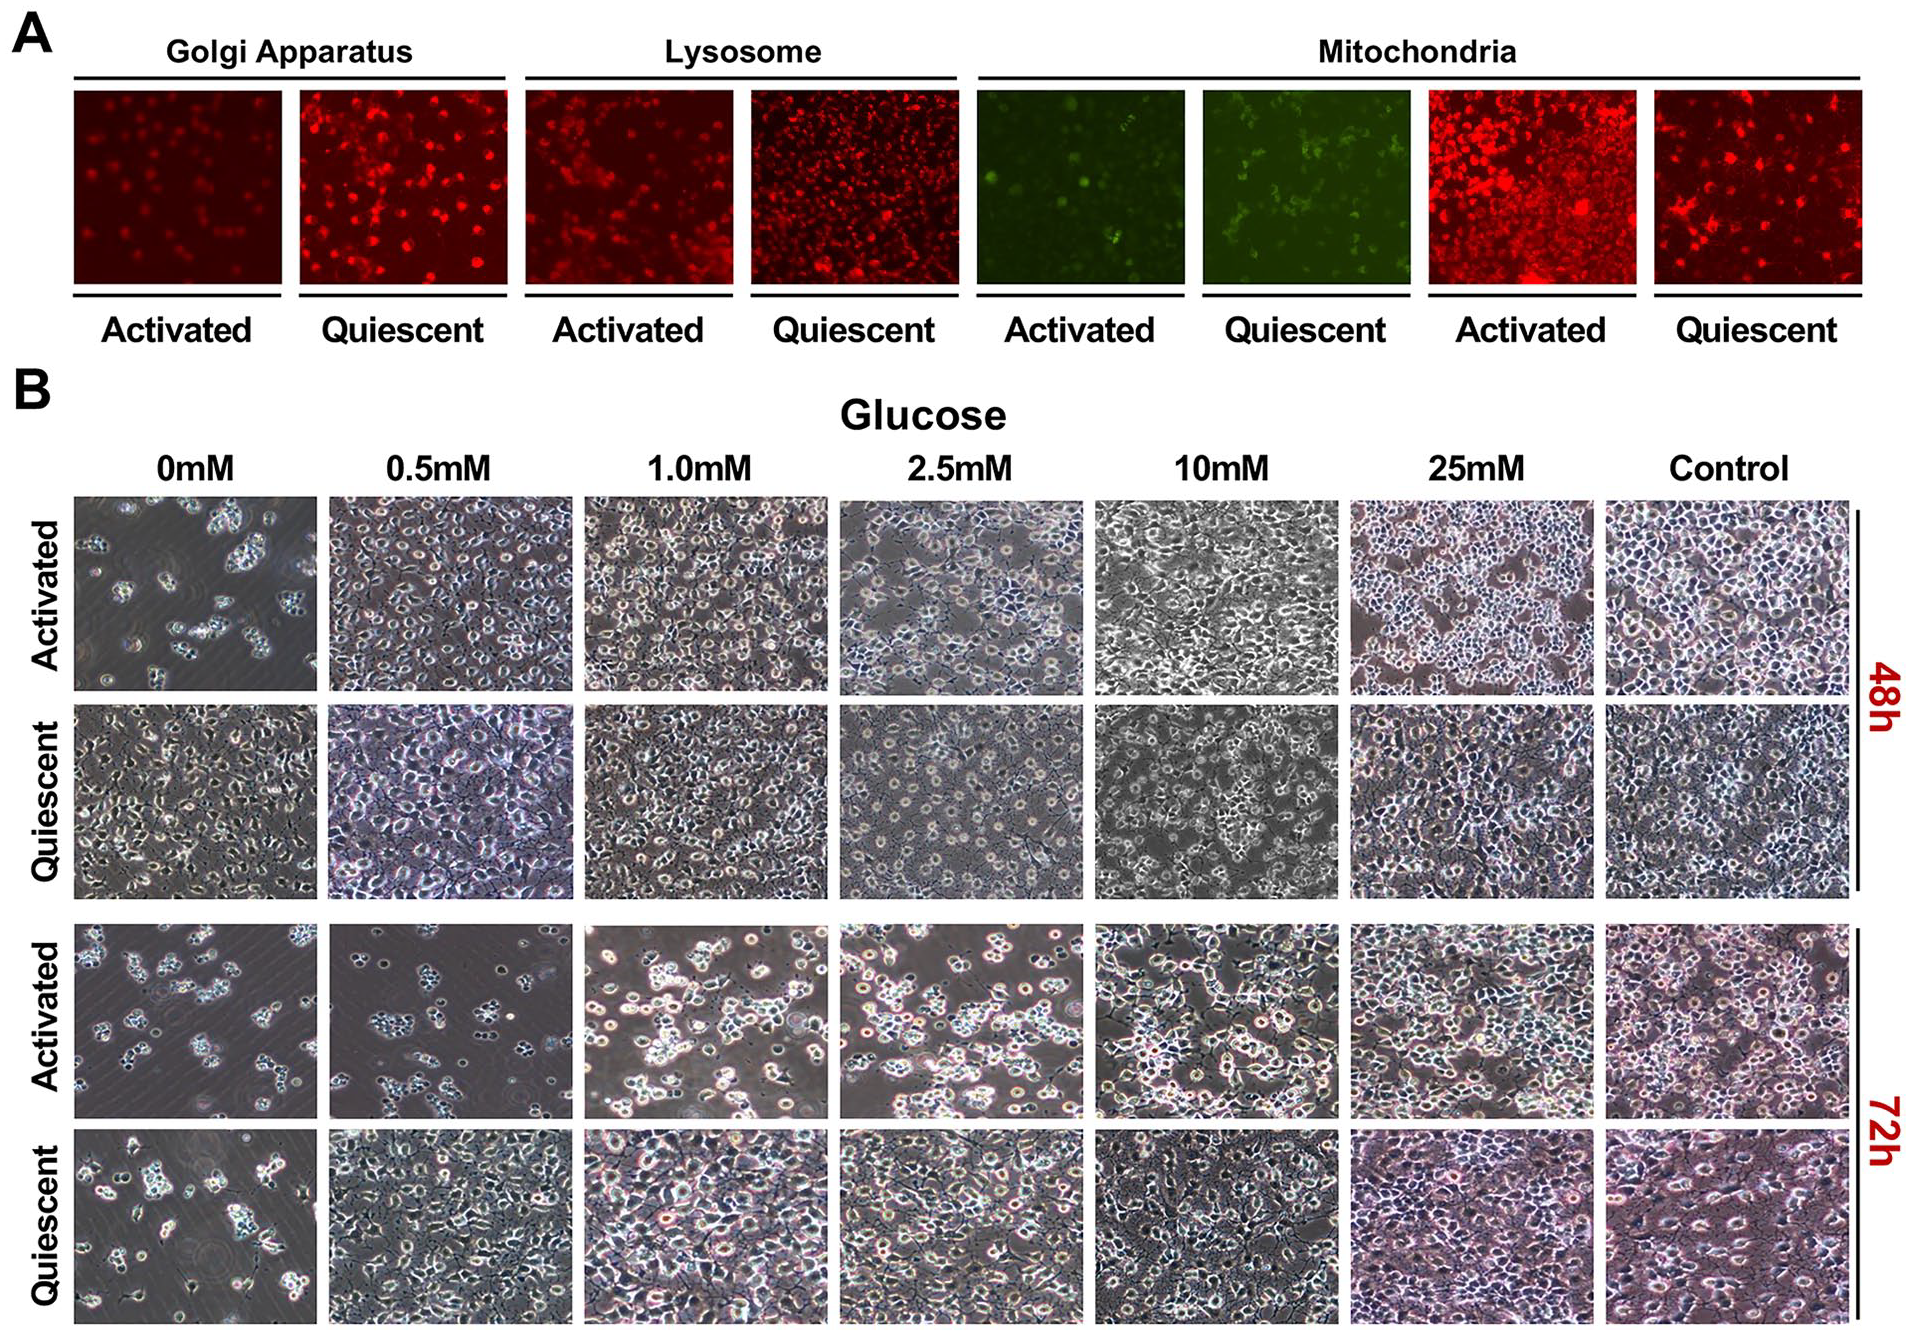
Low metabolic activity and high stress resistance with quiescent NSCs. (A) Organelle (Golgi apparatus, lysosome, mitochondria)-specific fluorescent staining of activated and quiescent HCN cells. (B) Representative images of activated and quiescent HCN cells cultured with different concentrations of glucose (0 mM, 0.5 mM, 1.0 mM, 2.5 mM, 10 mM, 25 mM, and the standard high glucose control) over time.
High metabolic activity usually rendered cells more susceptible to stress such as nutrient starvation. Therefore, we decided to subject quiescent and activated HCN cells to glucose starvation. Quiescent and activated HCN cells were passaged and cultured overnight in the standard high glucose medium, respectively, with and without BMP4 and then switched to medium with different levels of glucose (0 mM, 0.5 mM, 1.0 mM, 1.5 mM, 2.5 mM, 10 mM, 25 mM, and the standard high glucose control) for 72 h. Similar to the standard high glucose control, 25-mM glucose sustained activated HCN cell proliferation. But all other concentrations failed to support activated HCN cell proliferation fully, and by 72 h, a decreasing number of cells and increasing amount of cell death were observed (and became obvious below 2.5 mM), proportional to the decreasing glucose concentrations (Fig. 4B). In fact, the 0-mM group already exhibited significant cell death by 48 h, and most of the other groups except the 25-mM one slowed down their proliferation and somewhat resembled quiescent morphologies (Fig. 4B). In contrast, by 48 h, quiescent HCN cells even survived well without glucose (0 mM; Fig. 4B). By 72 h, 0.5-mM glucose was still enough to fully sustain the quiescent HCN culture, essentially indistinguishable from the control, and no group, except the complete glucose deprivation one (0 mM), showed obvious cell death (Fig. 4B).
Taken together, these results demonstrate that quiescent and activated NSCs have a different metobolism, with quiescent cells having increased tolerances to glucose starvation.
Global Anabolic and Catabolic Differences Between Quiescent and Activated NSCs
Encouraged by the aforementioned results, we sought to further use transcriptomic insights to guide our experimental explorations. Among many potential ones, we have chosen to focus on three representative anabolic processes—RNA metabolism, protein synthesis, and mitochondrial activity—and one catabolic process—autophagy—for their strong relevance with stem cell quiescence and activation control. Consistent with earlier GO term analysis, activated NSCs showed significantly higher expression for genes related to RNA metabolism (eg, H2AFZ, HMGB2, and TOP2A), protein synthesis (eg, RPL36A, RPS27L, and SLC25A37), and mitochondrial activity (eg, NDUFAB1, TOMM22, and MRPS27) than quiescent NSCs (Fig. 5A). Conversely, quiescent NSCs exhibited higher expression levels of autophagy-related genes (eg, LAPTM4A, CSTA, and PTPRF; Fig. 5A).
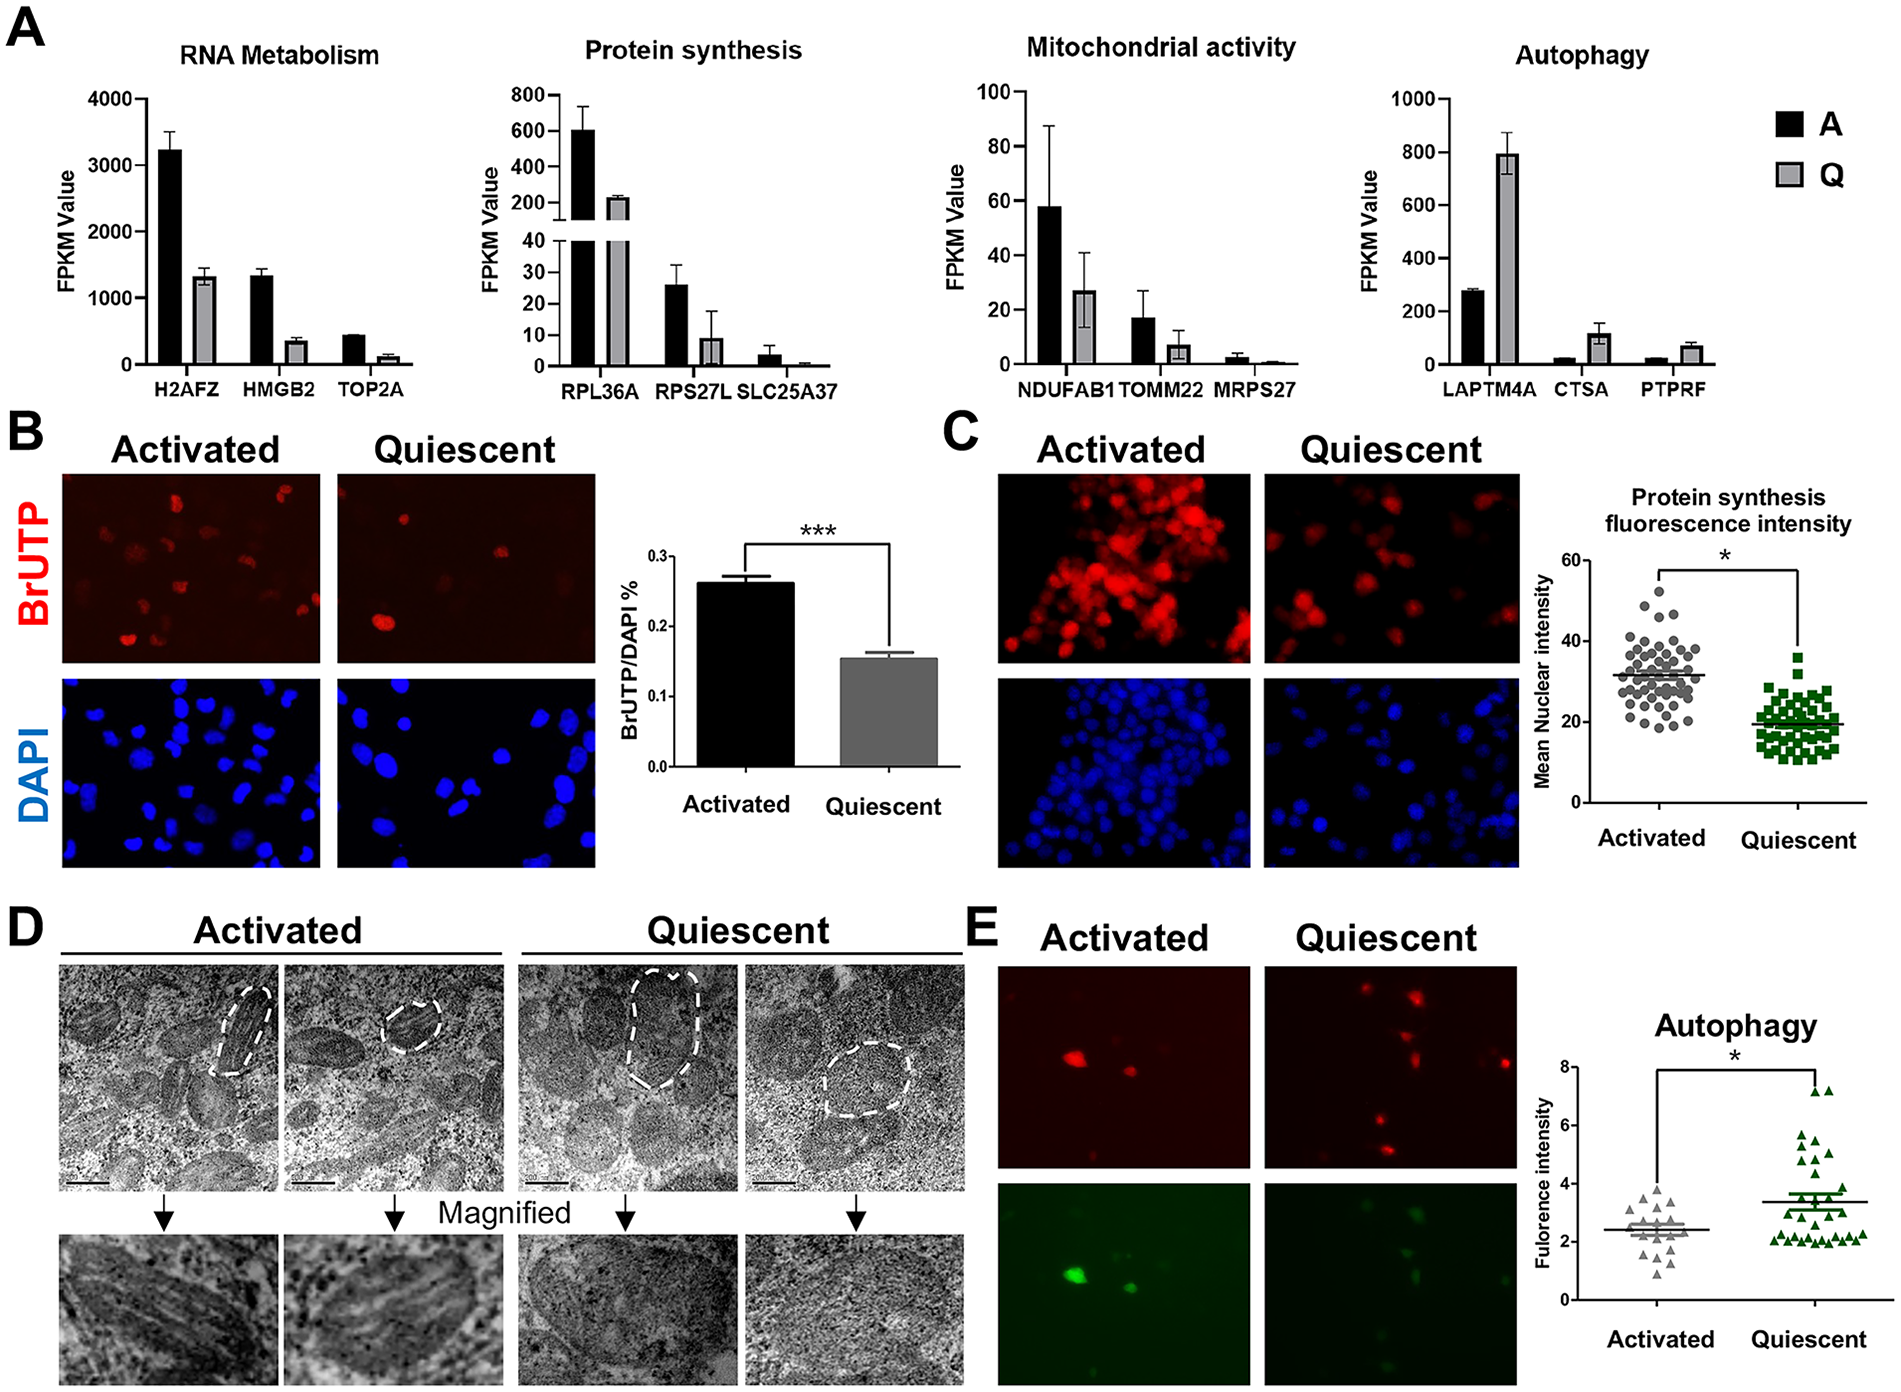
Global anabolic and catabolic differences between quiescent and activated NSCs. (A) Expression of representative genes related to RNA metabolism, protein synthesis, and mitochondrial and autophagy activity. (B) Comparison of RNA metabolism dynamics between activated and quiescent HCN cell cultures shown by BrUTP staining and its quantification (n = 5). (C) Comparison of protein synthesis dynamics between activated and quiescent HCN cell cultures shown by OPP incorporation and its quantification (activated, n = 53; quiescent, n = 50). (D) Mitochondrial morphological distinctions between activated and quiescent HCN cells revealed by transmission electron microscopy. (E) Comparison of autophagy dynamics between activated and quiescent HCN cell cultures shown by the Adv-mRFP-GFP-LC3 reporter (activated, n = 18; quiescent, n = 32). P-values are denoted as follows: *P < 0.05; **P < 0.01; ***P < 0.001.
Next, we hoped to experimentally validate these transcriptomic insights. For RNA metabolism, we utilized BrUTP (5-Bromouridine-5’-triphosphate) incorporation assays to examine RNA synthesis activity through labeling and quantifying newly synthesized RNA. Activated HCN cells exhibited a much higher ratio of BrUTP/DAPI, indicative of increased RNA synthesis and metabolism compared to quiescent ones. Similarly, activated HCN cells exhibited higher protein synthesis activity than quiescent ones, as determined by greater OPP incorporation and fluorescence intensity. As analyzed by transmission electron microscopy, activated HCN cells had thick and well-organized mitochondrial cristae. In contrast, mitochondria in quiescent HCN cells were swollen and immature with sparse, fragmented, and disorganized cristae. Unlike the other three anabolic processes, the level of autophagy, a major catabolic process, was significantly enhanced in quiescent HCN cells rather than in activated ones, as determined by the Adv-mRFP-GFP-LC3 reporter.
Discussion
The balance between quiescence and activation holds the key to stem cell maintenance and tissue homeostasis21,22. However, intact quiescent stem cells are hard to isolate and purify without disrupting their quiescence, and single-cell omics analyses in general either do not have enough sequence depth due to technical limitations or reach enough cell numbers because of high costs23–26. Thus, despite high significance and intensive efforts, our understanding of stem cell quiescence and activation remains limited. Over the years, in vitro modeling systems have been developed and proved powerful for dissecting fibroblast and muscle stem cell quiescence and activation27,28. In vitro modeling of NSC quiescence and activation was previously reported by our group and others16,20,29,30. Yet, a comprehensive establishment and characterization of a reversible NSC quiescence and activation culture system remain to be documented.
In the present study, through the combinatorial use of classical quiescence and activation control signals, we have successfully developed a reversible NSC quiescence and activation cell culture system. Not only can this in vitro model recapitulate reversible NSC quiescence and activation, but it also retains the same proliferative and differentiating properties after the reversible quiescence and activation induction procedure. More importantly, this modeling system is amenable to both functional and mechanistic studies, such as omics studies as shown here, genetic manipulation, and screening as we and others have previously reported16,30.
Revealed by transcriptomic profiling of this in vitro model, the entry and/or exit of NSCs from quiescence and/or (re)activation is accompanied by rapid and drastic shifts in cell metabolism between anabolic and catabolic activities, involving nutrient (glucose, nucleotides, and so on) intakes and metabolism; macromolecule (eg, RNA, DNA, and protein) synthesis, assembly, and degradation; as well as cell organelle (ribosome, spliceosome, mitochondrial, lysosome, and so on) biogenesis and removal (eg, autophagy), highly responsive to the increasing and/or decreasing demands for biomaterial and energy. The transition between quiescence and (re)activation also involves a broad and coordinated change in cell signaling (eg, classical quiescence and activation controlling BMP, Notch, FGF, and Wnt pathways) and extracellular matrix, presumably as a result and reflecting their differential demand for environmental sensing and surveillance 6 .
Highlighting the power of this in vitro modeling-enabled transcriptomic profiling approach, we have experimentally verified the dynamic changes with RNA metabolism, protein synthesis, mitochondria, and autophagy during HCN cell quiescence and activation. During brain development, homeostasis, and diseases, NSCs encounter highly variable sometimes unpredictable environmental changes, and numerous factors could impact NSC quiescence and activation. Thus, we expect the processes uncovered here shall have profound roles in NSC quiescence and (re)activation under physiological and/or pathological conditions as have been shown for other stem cell systems5,22. It is now tempting to ask whether and how diverse cell metabolic processes, cell signaling pathways, ECM dynamics, and so on could alter NSC quiescence and activation in vitro and/or in vivo, and whether and how they may impact brain development, homeostasis, and diseases. Hence, we believe that this present work not only showcases the broad utilities of this powerful in vitro NSC quiescence and activation culture system but also provides timely insights for the field and warrants further investigations.
Footnotes
Author Contributions
QL and ZG conceived and designed the experiments; KH, SJ, KY, and YT performed the experiments; KH, SJ, HW, QL, JG, and ZG analyzed the data; CC, KH, YT, and ZG wrote the manuscript; HW, QL, JG, and QL edited the manuscript; JG, QL, and ZG provided financial support. All authors approved the final manuscript.
Ethical Approval
This study was approved by our institutional review board.
Statement of Human and Animal Rights
This article does not contain any studies with human or animal subjects.
Statement of Informed Consent
There are no human subjects in this article, and informed consent is not applicable.
Declaration of Conflicting Interests
The author(s) declared no potential conflicts of interest with respect to the research, authorship, and/or publication of this article.
Funding
The author(s) disclosed receipt of the following financial support for the research, authorship, and/or publication of this article: This work was supported by funds from the Key Disciplines Group Construction Project of Pudong Health Bureau of Shanghai (PWZxq 2022-05), Tianjin Key Medical Discipline (Specialty) Construction Project, and the National Natural Science Foundation of China (32370895, 32070862 to ZG).