
Abstract
A mathematical nonlinear regression model of several parameters (baseline insulin intake, posttransplant 2-h postprandial blood glucose, and stimulated C-peptide) from type 1 diabetics with HbAlc <6.5% who do not require insulin therapy and have no hypoglycemic instances was developed for accurately predicting supplemental insulin requirements in the posttransplant period. An insulin deficit threshold of 0.018 U/kg/day was defined as the average first-year calculated insulin deficit (CID), above which HbA1c rose to >6.5% during year 2 of the posttransplant period. When insulin-untreated subjects were divided into two groups based on whether the average CID was smaller (group I) or greater (group II) than the insulin deficit threshold, HbA1c was found to be similar in the two groups in year 1, but increased significantly in group II to above 6.5% (with mean glucose of 121.9 mg/dl) but remained below 6.5% in group I subjects (with mean glucose of 108.7 mg/dl) in year 2 of the follow-up period. The greater insulin deficit in group II was also associated with a higher susceptibility to hyperglycemia during periods of low serum Rapamune and Prograf levels (combined levels below 11.2 and 4.7 ng/ml, respectively). Although the differences between predicted insulin requirement (PIR) and actual empirical insulin intake in the insulin-treated subjects were generally small, they were nonetheless sufficient to identify over- and underinsulinization at each follow-up visit for all subjects (n = 14 subjects, 135 observations). The newly developed model can effectively identify underinsulinized islet transplant recipients at risk for graft dysfunction due to inadequate supplemental insulin intake or those potentially susceptible to graft function loss due to inadequate immunosuppression. While less common following islet cell therapy, the model can also identify overinsulinized subjects who may be at risk for hypoglycemia.
Introduction
Although islet transplantation has been shown to be effective in the treatment of type 1 diabetes (T1D), for a variety of reasons not yet fully understood, islet graft function deteriorates with time (25). One possible cause of this phenomenon is inadequate insulinization during the posttransplant period, which could lead to β-cell exhaustion and early graft failure (5). On the other hand, overinsulinization can potentially worsen and/or prevent the resolution of hypoglycemia. Historically, the decision to restart insulin therapy post-islet transplantation, and at what dose, has been largely empirical, based on the treating physician's review of the subject's blood glucose profile. We explored whether the analysis of certain pre- and posttransplant factors could be used to objectively predict insulin requirements post-islet transplant. To more accurately approximate the relationship between metabolic parameters and insulin requirements (9), we utilized a nonlinear regression model. With this approach, we were able to estimate insulin requirement posttransplant, even in subjects with good islet graft function who may require minimal doses of insulin therapy. We then considered whether predicted values for insulin requirements that were higher than reported insulin intake might represent a state of insufficient insulinization by examining HbA1c and average daily blood glucose measurements over a 2-year follow-up period following the last islet transplant. We also examined the effects of changes in trough serum levels of immunosuppression drugs on islet function.
Materials and Methods
Islet Cell Preparation
Human pancreata were procured from ABO-compatible, cross-match-negative cadaveric donors. The pancreata were cleaned and canulated using a 16-gauge angiocatheter, then perfused with collagenase solution using an automated perfusion machine (BioRep Tech., Miami, FL, USA). The pancreas was then cut into 7-10 sections following distention, and the islets were mechanically isolated under cGMP conditions by the Southern California Islet Cell Resources Center at City of Hope as previously described (21). The islets were then purified with Biocoll Separation Solution (Biochrom AG, Cedarlane Laboratories, Ontario, Canada) by using continuous density gradients 1.1 and 1.08 g/ml. Islet cell products were maintained in culture from 24 to 72 h prior to transplant. Prior to transplantation, islet preparations were assessed for number, viability, and purity, and samples were taken for sterility and endotoxin measurement. On the day of transplant, islets were collected from flasks and pooled into 250-ml conical tubes. The supernatant was removed and centrifuged at 1,000 rpm for 3 min, and the islet pellet was added to the total pool. The total pool was resuspended in 100 ml transplant media, which consisted of CMRL 1066 (Mediatech Inc., Manassas, VA, USA) and human serum albumin (Talecris Biotherapeutics, Inc., Durham, NC, USA). Islet transplant product was released following quality control (QC) approval, which consists of low endotoxin (≤;2 EU/ml) and Gram stainnegative test results.
Islet Cell Transplantation
Portal access was achieved using a percutaneous transhepatic approach, as described by others (25). A 250-cc normal saline bag with 35 U of heparin/kg recipient body weight was connected via the infusion line to the stopcock farthest from the patient. A manometer tube was connected to the stopcock closest to the saline bag and was used to obtain baseline and sequential portal venous pressure measurements with appropriate manipulation of the stopcocks. The bag containing the islet preparation was then attached to the stopcock closest to the patient. After a baseline portal pressure measurement was recorded and deemed safe to continue, infusion of normal saline was started via gravity drainage. Infusion of the islets was started by manipulating the stopcock and continued for 30 min via gravity drainage. Portal pressures were monitored throughout the infusion to avoid thrombosis. The portal tract was embolized using Gelfoam® (Pharmacia and Upjohn. Bridgewater, NJ, USA). Average transplanted IEQ/kg for all 14 subjects was 12,672 ± 3,387. IEQ/kg for groups 1 and 2 (described below) were 13,105 ± 5,861 and 12,459 ± 6,230, respectively. Data are given as mean ± SEM.
Subjects
We followed 17 T1D subjects with frequent episodes of hypoglycemia and/or hypoglycemia unawareness who received allogenic human islet transplantation between 2004 and 2011 under City of Hope's Islet Transplant Alone protocol; however, three subjects withdrew from the program after receiving one or two islet transplant(s) due to inability to travel or immunosuppression drug side effects, and therefore no long-term follow-up data were collected. Thus, only data from 14 subjects (eight females, six males) were included in the long-term analyses. Subject mean age was 49.1 ± 10.1 years. All subjects had a history of hypoglycemic events (mean 5.2 ± 3.3 episodes per week) prior to receiving transplant. Eight subjects received three transplants, five subjects received two transplants, and one subject received a single transplant. Subjects who were insulin free for at least 1 year following the last transplant (n = 9) were divided into two groups. Group I (n=5) included three subjects who received three transplants and two subjects who received two transplants. Group II (n = 4) included two subjects who received three transplants and two subjects who received two transplants.
One subject received a whole organ transplant 1 year and 3 months following the last islet transplant; all other subjects were followed for at least 2 years after the last islet transplant. Informed consent was taken from all the subjects, and studies were approved by the institute's ethics committee.
Subject Assessments
Subjects were assessed pre-islet transplant, and at 3, 6, 12, and 24 months posttransplant according to the methods below. Daily blood glucose and hypoglycemic events were evaluated based on subjects' self-reported blood glucose meter downloads or paper logs. Hypoglycemic episodes were defined as blood glucose ≤60 mg/dl. Daily insulin requirements were calculated from subject insulin pump downloads or logs and then averaged over 1 week for a given posttransplant time point.
Subject blood glucose and insulin data were also analyzed to identify episodes of islet graft dysfunction. Islet graft dysfunction events were defined based on criteria established by the National Institutes of Health (NIH)-sponsored Collaborative Islet Transplant Registry (CITR) (3) for insulin-independent recipients as three blood glucose readings 2 h or longer postprandial over 180 mg/dl in any 1-week period or three preprandial blood glucose readings over 140 mg/dl in any 1-week period, and for insulin-dependent recipients as a 50% increase in daily insulin requirements (at least 5 units/day) or an increase of 10 units/day over any 1- to 2-week period, in the absence of confounding factors (e.g., diet, illness, drug toxicity).
An IV glucagon stimulation test was performed pre-and posttransplant to evaluate insulin secretory response. Blood samples were drawn while fasting, and at 6 min post-IV injection of 1 mg glucagon to measure plasma C-peptide levels.
An oral glucose tolerance test (OGTT) was conducted at each posttransplant time point using 120-min glucose values to evaluate glucose tolerance. Subjects were instructed to consume a weight-maintaining diet consisting of 30% fat, 20% protein, and 50% carbohydrate (at least 150-200 g) per day for 3 days prior to each OGTT. Subjects reported after an overnight fast to the City of Hope General Clinical Research Center (GCRC) while the unit was funded and to the Clinical Research Unit afterward. Samples for measurements of fasting glucose, insulin, and C-peptides were drawn, followed by ingestion of a glucose solution (75 g of glucose dissolved in 225 ml of water; GlucaGen, Bedford Laboratories, Bedford, OH, USA) within 5 min. Serial blood samples were drawn after glucose ingestion to monitor glucose, insulin, and C-peptide responses. The plasma glucose value at 120 min post-glucose ingestion was used as the “postprandial” glucose value. OGTT and IV glucagon stimulation studies were completed on different dates.
Plasma glucose concentrations were determined enzymatically by the glucose hexokinase method (Sigma-Aldrich, St. Louis, MO, USA, or Roche Diagnostics Inc., Indianapolis, IN, USA) or by the glucose oxidase method (Yellow Springs Instruments, Yellow Springs, OH, USA). C-peptide values were obtained using a commercial kit (Diagnostic Systems Laboratories, Webster, TX, USA) with a minimal detection limit of 3.3 pmol/L or by a two-site immunoenzymometeric assay using a Tosoh 2000 auto-analyzer (Tosoh Biosciences, Inc., South San Francisco, CA, USA) with a sensitivity level of 0.05 ng/ml.
Immunosuppression
Subjects received glucocorticoid-free immunosuppression based on the original Edmonton protocol (25). Immediately prior to transplant, subjects received one of two interleukin-2 inhibitors, either basiliximab (Simulect; Novartis, Basel, Switzerland) or daclizumab (Zenapax; Roche). The anti-tumor necrosis factor (TNF)-α agent, etanercept (Enbrel; Amgen Inc., Thousand Oaks, CA, USA), was given to reduce islet graft loss from acute inflammation. Subjects were also started pretransplant on the calcineurin inhibitor, tacrolimus (Prograf; Astellas Pharma US, Inc., Deerfield, IL, USA), in combination with either sirolimus (Rapamune®: Pfizer, New York, NY, USA), which inhibits IL-2 via the mammalian target of rapamycin (mTOR) pathway or mycophenolic acid (CellCept; Roche). Basiliximab was given intravenously at a dose of 20 mg, and another dose of 20 mg was given 4 days posttransplantation. Daclizumab was given intravenously at a dose of 1 mg/kg pretransplant and every 14 days posttransplant for a total of five doses. An initial dose of 50 mg etanercept was given intravenously 1 h prior to islet infusion, and subsequently, 25 mg was given subcutaneously twice a week for 2 weeks. Tacrolimus doses were started at 1 mg twice daily and adjusted to maintain a trough concentration between 6 and 10 ng/ml if sirolimus was not used or 3-6 ng/ml when given in combination with sirolimus. If used, sirolimus was started at transplant with an initial dose of 0.15-0.2 mg/kg, and the dose was subsequently adjusted to maintain trough concentrations between 12 and 15 ng/ml. Serum levels of tacrolimus and sirolimus were measured by liquid chromatography/mass spectroscopy (ARUP Laboratories, Salt Lake City, UT, USA). When used, mycophenolic acid dosing ranged from 250 to 500 mg twice daily, and adjustments were made based on clinical presentation.
Model Parameters
A Model for Insulin Therapy and Islet Scoring (MITRIS) was developed that predicts a subject's insulin requirements and generates a composite islet graft function index (GFI). The program can be accessed at http://www.cityofhope.org/diabetes/ClinicalTools/MITRIS. The program generates a model using several functional parameters (2-h postprandial blood glucose, stimulated C-peptide posttransplant, and baseline insulin intake), which reflects in vivo function of transplanted islets as well as subject insulin sensitivity prior to islet transplantation. In addition to the importance of C-peptides as an indicator of islet graft function, 2-h postprandial glucose was identified as a second measure of in vivo islet function and overall subject glycemic control. Because the insulin sensitivity of a given transplant recipient may influence the metabolic demands on the transplanted islets, and consequently the susceptibility to posttransplant islet exhaustion, subject baseline insulin intake average was used as an explanatory variable for the analysis. Although baseline insulin intake was used in lieu of the glucose clamp method to estimate insulin sensitivity due to difficulties in establishing a steady state of glucose homeostasis, correlation between the two measures yielded an r=-0.56. This weak value appeared to be the result of a high coefficient of variation from the glucose clamp in several cases (data not shown).
To characterize the relationship between indicators of functional islet mass and reported insulin intake, data from 2-h postprandial glucose and stimulated C-peptide were scaled between 0 and 1, and their mean values were compared with the reported actual insulin intake in posttransplant subjects who had not yet achieved insulin independence, resulting in a hyperbolic relationship (Fig. 1A). Based on this finding, a nonlinear regression model was used to estimate the relationship between three explanatory variables (2-h postprandial glucose, stimulated C-peptide, and baseline insulin intake) and the patient's reported insulin intake in the posttransplant period. The daily insulin intake dataset used as training for the model was scaled to the logarithmic portion of the activation function (represented by the upper two thirds of the sigmoid curve for our analysis). To refine the model output, a subset of data (135 observations) was chosen for training with explanatory variables that correspond to HbA1c levels below 6.5% in the absence of hypoglycemia, a common goal for glycemic control in individuals with diabetes (2). This allowed the validation of the training set by using only data from points when subjects were properly insulinized.

Nonlinear correlation between explanatory data and insulin requirements. (A) Data for 2-h postprandial glucose and stimulated C-peptide are scaled from 0 to 1 (bottom), and plotted against reported insulin intake from 3-day testing period. Only metabolic data points where the subject's insulin intake was >0 U/kg/day are shown. Actual corresponding values for each parameter are shown in the bottom scale for reference. (B) Output from nonlinear regression function shows predicted insulin requirements over a range of normalized subject parameters (see text) after training. An islet graft function index (GFI) is calculated over the range for which the change in slope decreases from the linear portion of the logistic curve to the upper confidence interval of a subset of subjects who were properly insulinized, and who had no hypoglycemic episodes testing periods.
Because the study data is generated from a small cohort, additional measures were taken to ensure adequate generalization and to avoid overfitting, which included the use of weight-decay modification during training (4). Cross-validation of the method was also performed by removing all observations for a given subject from training (leave-one-subject-out cross-validation), and the system was sub-sequently interrogated using explanatory values from the omitted patient. Predicted insulin requirement (PIR) was then recorded as the program output. This process was repeated for all patients, and the data were compared with the output from the system when trained using the full dataset.
Model Terms
Predicted Insulin Requirements (PIR)
After the system was trained (29), appropriate weights for each explanatory variable were given, and the dose-response curve for predicted insulin requirements in U/kg/day was generated (Fig. 1B), and finally, prediction of the required daily insulin dose in U/kg body weight (the model output) was calculated.
Graft Function Index (GFI)
A graft function index was generated, ranging from 1 (poor islet function with higher risk of islet exhaustion over time) to 5 (good islet function with negligible islet exhaustion risk) and is shown in Figure 1. The highest value in the scoring range was defined using baseline insulin intake, 2-h postprandial blood glucose, and stimulated C-peptide at 3, 6, and 12 months in the first year following the last transplant, of a subset of insulin-free subjects who had HbA1c below 6.5% from 12 to 24 months (n=5). A PIR value corresponding to the upper confidence 99% limit of individuals having an HbA1c of <6.5% 2 years posttransplant was considered reflective of optimal graft conditions with little or no risk for islet exhaustion. This PIR value (0.003 U/ kg/day) was used empirically to define the highest GFI value of 5. Similarly, a PIR value corresponding to the lower 99% confidence limit was considered necessary to ensure HbA1c levels <6.5% over 24 months, and this value (0.018 U/kg/day) was defined as the insulin deficit threshold (IDT). The lowest GFI value of 1 is defined at the linear portion of the activation function where the rate of change is highest.
Groups I and II
Only subjects who were insulin free for at least 1 year following islet transplantation were grouped. Subjects were grouped based on whether the predicted insulin requirement average within the first posttransplant year was less than (group I) or greater than (group II) the IDT previously described.
Posttransplant Immunosuppression
To investigate the possible effects of immunosuppression on long-term islet graft function, the effects of high and low patient trough serum levels of Rapamune and Prograf on reported blood sugar taken on the day of testing were examined. We define immunosuppressive state as either “high” or “low” depending on whether a subject's combined immunosuppression, when compared to the average for all subjects, was above or below the observed mean, respectively. Because the ranges for the two agents were different (range for Prograf was 1.4-8, Rapamune was 6.6-15.8, shown in Fig. 6A as standard deviations from the mean), we standardized the ranges using a z-score transformation. The same mean was then used to evaluate both groups by observing reported blood glucose on the day of blood draw for measurement of immunosuppressive drug levels.
Statistics
Data are presented as mean value ± SE. Bootstrap confidence intervals for properly insulinized subjects were generated over 1,000 repetitions using the library (boot) from the R programming language. Comparative analysis of patient groups having different degrees of predicted insulinization was done using unpaired t-test and Wilcoxon matched-pair test. Correlation of cross-validation results was reported using the Spearman rank correlation coefficient. Using first-year clinical data, ROC curves for the accuracy of the graft function index (GFI) and β-score in predicting the number of excursion-free weeks in the second year were compared using SAS 9.2. Single preprandial (premeal excursions >140 mg/dl) or postprandial (postmeal excursion >180 mg/dl) events in each week of the second year were used as binary classifiers for the ROC analysis. GFI and β-score ranges were 0-5 and 0-8, respectively. Observed ranges for insulin-free subjects were 2-5 for GFI and 6-8 for β-score method. One-way analysis of variance with Holm-Sidak's multiple comparisons test was performed to compare reported glucose from subjects with insulin deficits versus those without deficits. Unpaired t-tests were used to measure the effect of immunosuppression on reported glucose in groups I and II.
Results
Validation
Model validation showed that the validation data fit the model nearly as well as the training data (Fig. 2A). The model was highly consistent in predicting the PIR of each omitted subject's data, compared with the output when the model is trained on the full dataset (rs = 0.9953, p < 0.0001). Results also showed similar results (rs=0.9952, p < 0.0001) were obtained when the dataset was restricted to insulin-free subjects only (inset).
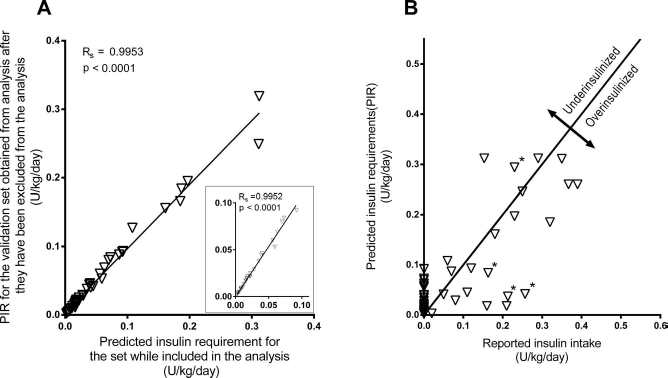
Predicted insulin requirements for all subjects. (A) Using model cross-validation by single subject omission, the model was trained by omitting a group of observations for a single subject from training, and model's output was then tested using explanatory data from the omitted subject. This process was repeated for each subject and plotted against the model's output where no data were omitted. The inset shows data from only insulin-free subjects. (B) Predicted versus reported output for all subjects. Zero intercept line for r = 1.0 is shown (solid), where points below the line indicate instances of subject overinsulinization, while points above the line represent insulin intake deficits. Asterisks indicate presence of hypoglycemic events.
Predicted Insulin Requirement (PIR) and Transplant Efficacy
To show the relationship between PIR and reported insulin intake, both variables were plotted in reference to the zero intercept line (r = 1). Points above and below the line indicate putative cases of under- and overinsulinization, respectively (Fig. 2B). To test whether differences in PIR versus reported actual insulin intake could potentially serve as indicators of underinsulinization posttransplant, the relationship between calculated insulin deficit (CID) and HbA1c levels at 3, 6, 12, and 24 months were examined. Of the nine subjects who had been insulin free for more than 1 year posttransplant, five had HbA1c <6.5%, and four had HbA1c >6.5% at 24 months posttransplant. Figure 3A and B illustrate HbA1c, CID, and average blood glucose for subjects within groups I and II. Although the degree of CID was significantly greater in group II than group I during the first year following the last islet transplant (p < 0.05), significant differences in HbA1c values between groups were not observed until after 12 months following the last transplant (Fig. 3A). Further evaluation of the metabolic parameters for group I over the first year showed 2-h postprandial blood glucose <140 mg/dl [i.e., the cutoff for normal, nondiabetic subjects, according to American Diabetes Association (ADA) criteria (1)] and stimulated C-peptide of >0.3 nmol/L [the normal response cutoff for stimulated C-peptide, based on the Edmonton β-scoring system (23)]. The ROC curve for insulin-free subjects shows the accuracy of MITRIS in predicting glycemic control, where each point of the graph is created using a different GFI to test for the presence or absence of second-year glycemic excursions. MITRIS scored well even at upper scoring ranges, where a GFI of 4 yielded a sensitivity and specificity of 89% and 49%, respectively, and a GFI of 5 resulted in a sensitivity and specificity of 31% and 91%, respectively. The model had an overall accuracy of 0.74 using the area under the curve (AUC), which was significantly higher (p < 0.0001) when compared to the β-score method (Figs. 4A, B).
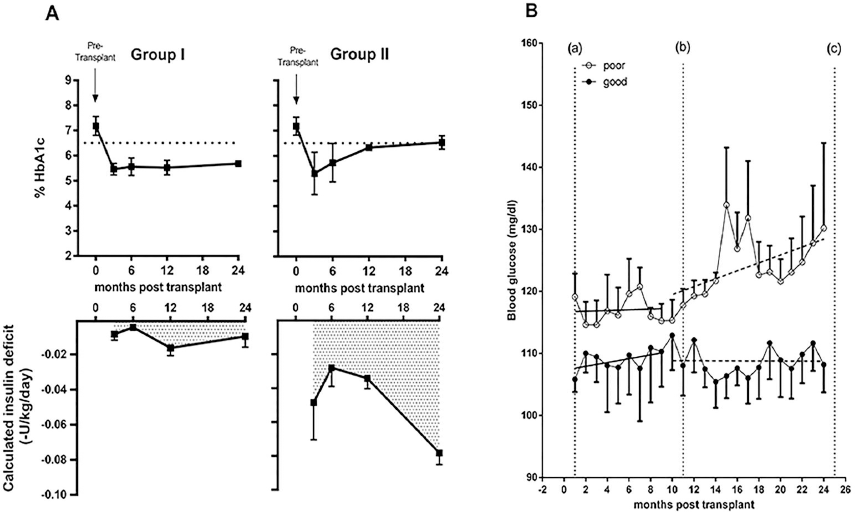
Results from 9 insulin-free subjects, showing the relationship of calculated insulin deficit (CID) with % HbA1c and daily reported blood glucose. (A) Both groups (mean±SEM) had high HbA1c levels above 6.5% pretransplant, and group differences failed to reach significance in the first posttransplant year. The degree of CID for group I in the first year was less than 0.018 U/kg/day on average, and corresponded with HbA1c values below 6.5% over 24 months (left). Group II consistently showed a degree of CID greater than 0.018 U/kg/day, and had significantly greater CID (p<0.01) than group I from 3 to 12 months, and from 3 to 24 months (right). Average HbA1c values for group II increased following 12 months relative to group I. (B) Daily glucose averages (means ± SEM shown) over a 24-month period. Data between lines (a) and (b) show average subject glucose for the first year following the final infusion. After 1 year, glucose averages for group II began to increase relative to group I, and were significantly different (p < 0.05) in the second year posttransplant (data between lines b and c). Dotted lines for each group represent the slope within the each year.

Receiver operator characteristics (ROC) curve for prediction of second-year glycemic control in insulin-free subjects. Graft function index (GFI) values (1-5) were taken at 3, 6, and 12 months posttransplant, and the performance of the GFI in predicting fasting glucose values above 140 mg/dl and postprandial glucose values above 180 mg/dl for each week in the second posttransplant year was estimated using the area under the curve (AUC). (A) Each cut-off represents the level of accuracy for a given score; cut-off points are annotated with the score and number of false positives (from left to right) for GFI and for β-score (inset). Results from both methods (with AUC) are shown in (B).
To observe the model's output on previously unseen data, we retrained the model by removing the last three subjects used in the original analysis and plotted the results using the explanatory data of the excluded subjects. A profile for each transplant recipient following the final islet infusion consisting of the subject's weekly reported blood glucose averages was created, and the program's PIR during the posttransplant period was also generated (Fig. 5). Based on the PIR, insulin therapy for subject 1 (top) was above the insulin deficit threshold of 0.018 U/kg/day (dotted line) over the 3-year period and showed good glycemic control spanning the entire posttransplant period. Subject 2 (middle) was well controlled for a majority of the first posttransplant year with only minor insulin deficits and showed glycemic control comparable to that of subject 1. However, beginning early in year 2, subject 2 underwent extended periods of underinsulinization, with a deficit of between 2 and 4 U/day, which resulted in a gradual but steady increase in blood sugar during the later portion of year 2, and significant graft failure occurred following year 2, where an additional period of insulin deficit between 3 and 11 U/day occurred. Even after adequate insulin therapy following year 3, glucose variability was extremely high as a result of considerable loss of islet graft function. Subject 3 underwent a period of insulin independence following a third islet infusion, but was underinsulinized during that time, resulting in several cases of graft dysfunction and a progressive loss of glycemic control. Glucose levels in subject 3 rose quickly relative to the other two subjects; however, this early rise in blood glucose values was concomitant to the prolonged deficit in insulin intake. This was also seen in subject 2, where a prolonged insulin deficit from months 26 to 33 resulted in approximately 10-20 mg/dl increase in reported blood glucose. We assert from these data that prolonged insulin deficit can lead to graft dysfunction, particularly when the cells are subjected to another insult from high metabolic demand or immune system reactivation.
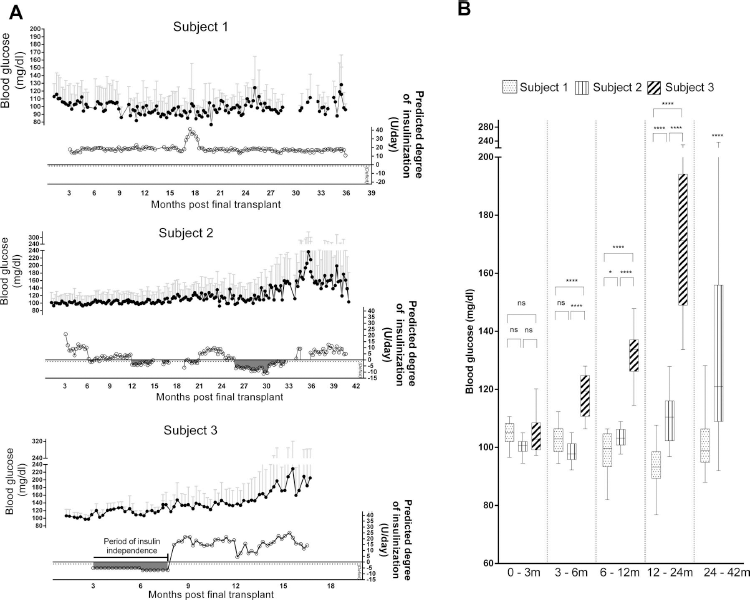
Effects of inadequate insulin therapy following islet transplantation. Results from 3 newest patients after being excluded from model training show a subject (A, top) who was sufficiently insulinized over a 3-year period with no reported insulin deficit, and 2 subjects (A, middle and bottom) with varying degrees of underinsulinization over 17 and 41 months following islet transplantation. (B) Analysis of variance for the 3 subjects fails to show significant differences in blood glucose for the first 3 months following the last islet infusion, yet glucose levels subsequently become significantly higher for subjects 2 and 3 following periods of predicted insulin deficit, as compared to subject 1.
In Figure 5B, an analysis of variance for all three subjects failed to show any significant glucose differences in the first 3 months, yet in months 3-6, a departure in reported blood glucose of the underinsulinized subject (subject 3) compared to subjects 1 and 2 (p < 0.0001) was seen. Minor insulin deficits experienced in subject 2 during the 6- to 12-month period may account for a small but significant increase (p=0.012) in mean blood glucose relative to subject 1 (Fig. 5B). Thus, differences in blood glucose control between underinsulinized (subjects 2 and 3) versus adequately insulinized (subject 1) subjects are dramatic following the first-year (p < 0.0001) and second-year (t-test, p < 0.0001) posttransplantation.
Predicted Insulin Requirement (PIR) and Immunosuppression
Because long-term islet graft efficacy can also be influenced by appropriateness of immunosuppression, we examined whether levels of Rapamune and Prograf outside the target range (12-15 ng and 3-6 ng/ml, respectively) could have deleterious effects on engrafted islet function. Results of reported glucose values taken on the day of subject blood draws for levels of immunosuppressive agents revealed differences based on the subject's functional islet mass. Averages of glucose values taken during periods of low trough levels of immunotheraputic agents were elevated relative to those taken when immunosuppression levels were in the therapeutic range; however, this effect was observed only for subjects with compromised graft function (Fig. 6, group II). In Fig. 6B, the nearly “U”-shaped configuration of glucose averages for group II show significantly elevated glucose levels (p = 0.0197) from days where below average immunotherapeutic drug levels were recorded. Though not significant, elevated glucose levels were also seen when extremely high levels of immunosuppression were measured (between 1 to 2 SD from the mean), suggesting that drug toxicity effects on islet graft function may have existed. Unlike group II, blood glucose in group I showed no significant rise in association of low immunosuppression, suggesting the resilience of graft function to the drop in immunosuppression levels in these patients.

Effects of low serum trough levels of Rapamune and Prograf in patients with compromised graft function. Levels for Rapamune and Prograf were standardized using a z-score transformation, where values are expressed as standard deviations from the mean for both agents (bottom). (A) Groups are defined based on whether the intake requirements were below (group I) or above (group II) the insulin intake threshold of 0.018 U/kg/day. Levels were considered high or low based on whether the averaged standardized score for both agents was above or below the mean. (B) Averaged blood glucose levels grouped by the corresponding difference in standard deviations from the mean of immunosuppression drug levels.
Discussion
We have demonstrated that the MITRIS is capable of successfully predicting subject insulin requirements postislet transplantation using a nonlinear regression model based on selected patient parameters (baseline insulin intake, 2-h postprandial blood glucose, and stimulated C-peptide posttransplant to represent transplanted islet function). We validated this association by identifying the minimum required level of insulin therapy necessary to avoid long-term graft failure, based on a subset of individuals who maintained an HbA1c level below 6.5% for the 2-year study period. Therefore, cases where subjects with a predicted insulin intake below the minimum required amount should prompt the treating physician to make no therapeutic changes. Alternatively, cases for subjects above the minimum amount who are not taking exogenous insulin or taking insulin at doses less than the predicted insulin requirement would require the treating physician use the output of the MITRIS program to appropriately treat the subject with insulin. Previously, other groups have reported the use of linear regression methods and multiple metabolic parameters to predict islet graft function, such as the Edmonton β-score method described by Ryan and colleagues, in which fasting blood glucose, HbA1c, stimulated C-peptide, and the presence or absence of insulin or oral hypoglycemic agents were used (23). The β-score method, in addition to other proposed models for evaluating islet function, such as the hypoglycemic score (HYPO score) and lability index (24) reported by the same investigators, as well as others (2,10,16), have served as valuable tools in the assessment of islet transplantation outcome and provided useful measures of the efficacy of islet transplantation. Some limitations, particularly regarding the HYPO score, are that the score generally reflected islet function at the time of assessment, and a rise in score occurred only if the transplant failed. Generally, a lower lability index or higher SUITO score (16,24) correlates well with better islet graft function and reported insulin independence at the time of assessment, yet examples of successful clinical intervention to preserve an islet graft based on an islet assessment score have not, to our knowledge, been published. Using the original Rapamune/Prograf immunosuppression regimen reported by the Edmonton group, only about 10-15% of islet transplant recipients remain insulin free after 5 years, as described by Pileggi and colleagues (17). Therefore, an earlier IGD detection method prior to overt graft failure is greatly needed in order to improve long-term islet transplant outcome.
Several potential causative factors have been proposed for declining islet function, including poor islet engraftment at the time of transplant, the possibility of adverse effects from either insufficient or overly aggressive use of immunotherapeutic agents, and possible recurrence of autoimmunity. High metabolic demands on suboptimal islet mass have also recently been reported to cause endoplasmic reticulum (ER) stress (18), with continuing ER stress potentially leading to a gradual decline in β-cell function. Further, metabolically stressed β-cells may also be more vulnerable to the effects of low level allo-or autoimmune reactivity. It is conceivable that some subjects reporting insulin independence after multiple transplants may, in fact, have a minimal but still unmet and undiagnosed requirement for exogenous insulin, which could be reflected by the high degree of variability in 2-h postprandial glucose and stimulated C-peptide levels observed in these subjects. Thus, in subjects who are reportedly euglycemic posttransplant, subtle abnormalities in metabolic data, when taken in context with a subject's baseline insulin requirement (insulin sensitivity) may indicate β-cell stress and a latent decline of islet graft function that manifests some months following islet transplantation (Fig. 4A, B) among subjects not supplemented with appropriate quantities of exogenous insulin. For example, a reduction in glucose-induced insulin secretion and a loss of β-cell differentiation corresponding with a loss of transplanted islet mass have been shown to occur in cases of chronic hyperglycemia (6,11,13,15,22,27), as reported by Gray and colleagues (7). Therefore, the early detection of islet exhaustion resulting from a lack of appropriate insulin therapy is imperative to maximize long-term graft function.
Although group differences in reported blood glucose were reported to be significant during the second year only, it is certainly plausible that an analysis consisting of a larger cohort could result in significant differences in reported blood glucose between groups earlier on as well. However, when a single subject's results are considered, it would be hard to establish the abnormal blood glucose control, particularly in the presence of HbA1c within the target range. Thus, the use of MITRIS would allow the recognition of insulin therapy deficit in these individual cases and prompt the treating physician to address this issue in a timely manner.
We initially considered several methods for gauging pretransplant insulin sensitivity, most notably the glucose clamp method. While considered the gold standard, glucose clamp is labor intensive and susceptible to varying degrees of reliability in establishing the steady state (26). We also considered subject pretransplant weekly average insulin intake as an alternative proxy of insulin sensitivity. As expected, significant negative correlation was observed between these parameters with an r=-0.56. Difficulty in establishing the steady state of glucose homeostasis during the insulin clamp, as reflected by the large coefficient of variation, appeared to be the major contributor to the weak r value. Nonetheless, the ability to show such correlation supports the validity of using pretransplant insulin intake as a surrogate measure of baseline insulin sensitivity.
Finding a definitive correlation between subject parameters and long-term islet transplant efficacy, however, has remained a challenge. Although the study focused primarily on pretransplant data for estimating insulin sensitivity, we acknowledge that changes in the subject's physical activity over the course of the study may impact insulin sensitivity and consequently the subject's insulin intake requirements. Subjects reporting physical activity and dietary intake could not be adequately collected or relied on, and all subjects in the present study have been treated with the same immunosuppressive agents and with the same therapeutic target levels. We therefore did not consider these factors in our analysis. Despite the importance of C-peptide as an indicator of engrafted β-cell mass, the utility of C-peptide values in predicting long-term islet transplant outcome remains unclear. High C-peptide values in the first posttransplant year could (correctly) indicate good islet function, but long-term efficacy could still be compromised due to the development of a hyperglycemic environment over time and/or reactivation of the immune system. Assessment of islet function via glucose data can also be complex. Oral glucose tolerance test results are difficult to reproduce (1), and although Ryan and colleagues (23) have shown that restoring euglycemia is an important factor in graft assessment, like C-peptide, it may have limited use as a marker of future islet function. Therefore, for the accurate prediction of islet function over time, it is important to utilize a method that will appropriately incorporate multiple factors that reflect both the in vivo function of transplanted islets and subject's insulin sensitivity prior to islet transplantation.
Although the MITRIS prediction method uses a composite scoring system (like the other previously described methods), we have observed that the correlation between metabolic parameters and insulin requirements posttransplant is nonlinear and can best be expressed using a logistic function. For example, in a subject whose stimulated C-peptide increases from 0.25 to 0.5 nmol/L after receiving a transplant, the resulting decrease in daily insulin may be larger than in a subject whose C-peptide level increases from 0.5 to 0.75 nmol/L posttransplant. This is supported by the relationship between indicators of functional islet mass and insulin intake seen in Figure 1A. This subtle point could potentially lead to overscoring islet function as the insulin requirement approaches 0 using a stepwise or linear regression function. As subjects' functional and metabolic parameters continue to improve, it is plausible that the corresponding biological insulin requirements would also continue to change according to this nonlinear trend, even in patients who report insulin independence. This is demonstrated by the ROC curve in Figure 4, which compares the accuracy of MITRIS versus the Edmonton β-score method in the prediction of pre- and postprandial excursions in each week of the second posttransplant year, using first-year clinical data. The largest difference between the methods occurs for insulin-free subjects in the upper scoring ranges, possibly as the result of linear regression overscoring (using the β-score method) in subjects with good to moderate islet function that may require minimal exogenous insulin intake to avoid long-term islet exhaustion risk. This can be seen in Figure 4A, where, at a comparable level of sensitivity (~0.89), the GFI had 305 false positives compared with 408 false positives using the β-score method (using scores 4 and 7 for GFI and β-score, respectively). Indeed, of the 1,248 classifier values tested, the perfect β-score value of 8 yielded 108 false-positive cases, where glycemic excursions were confirmed despite having the highest possible score, versus the highest GFI score of 5, which yielded 56 false-positive cases. Because false positives represent unpredicted weekly glycemic excursions in the second year using first-year data, the GFI may be more sensitive in identifying early cases of inadequate insulin therapy leading to graft failure.
Although the amount of CID for group II subjects was generally low, long-term exposure to deficits in insulin intake may lead to progressive islet exhaustion due to hyperglycemia and, eventually, to graft dysfunction. Weir and colleagues (12) have shown that prolonged exposure of transplanted islets to hyperglycemia upregulates proapoptotic genes and inhibits expression of genes important for β-cell differentiation and insulin secretion. β-Cell stress as reflected by increased proinsulin to insulin ratio can be avoidable with either transplantation of sufficient islet mass or use of appropriate insulin therapy (20). Further, exposure to hyperglycemia leads to induction of local cytokines and advanced glycation end products, providing additional evidence that islet grafts are susceptible to apoptosis due to glucose toxicity (6-8,11-15,18,19,22,27,28).
Difficulty maintaining adequate immunosuppression posttransplantation is a likely factor in the long-term loss of function and/or graft survival. In addition to maintaining trough levels within target ranges, our data suggest that guidelines for effective immunosuppression dose management may be expanded to include the subjects' observed metabolic condition and state of engraftment using the PIR in the first year posttransplant. While group II had an increase in IGD events, which may be attributed to periods of low Rapamune levels in year 2, group I had no significant IGD effects and may have potentially been resistant to adverse effects of falling immunosuppression levels below-target range. Thus, if the first-year PIR (as determined by a subject's own functional and metabolic parameters) is not met with adequate exogenous insulin intake, this undertreatment may increase the susceptibility to sustained graft dysfunction or demise when subjected to suboptimal immune protection.
Based on our studies, MITRIS can be a valuable tool to a) predict insulin requirements in subjects who are insulin free posttransplant, but in whom the decision to administer exogenous insulin, and at what amount as a means of preventing islet exhaustion has not yet been determined, and b) verify that adequate insulin therapy is provided to recipients who have yet to receive additional islet infusions and/or have insufficient transplanted islet mass. We recognize however that insulin therapy may be impractical where very low doses of insulin (<5 U/day) are required. We currently do not know whether such cases could efficiently be treated with oral agents such as insulin sensitizers or DPP-4 inhibitors. Sample size was also a caveat, which restricted the scope of our analysis to focus on the effects of insulin deficiency over time, and precluded the possibility of examining overinsulinization in depth, since there were only a small number of subjects with good islet function who were also taking insulin. Despite these limitations, with respect to the specific issue of defining appropriate posttransplant insulinization, we have shown that the MITRIS program is highly accurate at identifying impending islet dysfunction in insulin-free subjects and that it can be used successfully to provide a quantitative assessment of subject insulin requirements that will harbor little or no exhaustion risk. While traditional methods of islet assessment, such as HbA1c and blood glucose level measurements, were used to confirm our conclusion (using data from 12 to 24 months), first-year data of these parameters did not reflect second-year trends.
Although the immunosuppression protocol used is not T-cell depleting, it is anticipated that the newly developed prediction method for insulin requirement post-islet transplantation would apply to protocols utilizing T-cell-depleting strategies, since the focus of the method is to quantify the consequences of higher metabolic demands and glucose toxicity on islet function, rather than the immunological milieu of islet recipient. However, our results suggest that, while often subjective and poorly diagnosed, timely and appropriate insulin therapy for islet transplant recipients is the primary factor in achieving long-term islet graft function.
Footnotes
Acknowledgments
The Southern California Islet Cell Resource Center (SCICRC) is supported by the National Institutes of Health (National Center for Research Resources, National Institute of Diabetes and Kidney Diseases, U42-RR16607) and Juvenile Diabetes Research Foundation (31-2008-616). We thank Chakriya (Koi) Anunta for her contribution to draft revision. We also thank the City of Hope Islet Transplant team and General Clinical Research Center (M01 RR00043), as well as the Harbor-UCLA General Clinical Research Center (M01 RR00425), for their contribution to study design and data collection. The authors declare no conflicts of interest.