
Abstract
The immunomodulatory activity of mesenchymal stem cells (MSCs) is largely mediated by paracrine factors. We have recently shown that the immunosuppressive effects of MSCs on B lymphocytes in peripheral blood mononuclear cell (PBMC) culture can be reproduced by extracellular vesicles (EVs) isolated from MSC culture supernatants. Here we investigated the effect of bone marrow-derived MSC-EVs on T cells on PBMC cultures stimulated with anti-CD3/CD28 beads. Stimulation increased the number of proliferating CD3+ cells as well as of regulatory T cells (Tregs). Coculture with MSCs inhibited the proliferation of CD3+ cells, with no significant changes in apoptosis. Addition of MSC-EVs to PBMCs did not affect proliferation of CD3+ cells, but induced the apoptosis of CD3+ cells and of the CD4+ subpopulation and increased the proliferation and the apoptosis of Tregs. Moreover, MSC-EV treatment increased the Treg/Teff ratio and the immunosuppressive cytokine IL-10 concentration in culture medium. The activity of indoleamine 2,3-dioxygenase (IDO), an established mediator of MSC immunosuppressive effects, was increased in supernatants of PBMCs cocultured with MSCs, but was not affected by the presence of MSC-EVs. MSC-EVs demonstrate immunomodulatory effects on T cells in vitro. However, these effects and the underlying mechanisms appear to be different from those exhibited by their cells of origin.
Keywords
Introduction
Mesenchymal stromal cells (MSCs) represent a nonhematopoietic population of undifferentiated cells with the hallmark properties of self-renewal and the ability to differentiate into adipogenic, chondrogenic, and osteogenic cells (44). Several studies have documented the effects of MSCs on the immune system. These cells exhibit low expression of class II major histocompatibility complex (MHCII) and costimulatory molecules CD40, CD40L, CD80, and CD86 on cell surface (10). Their ability to modulate the activity of T and B lymphocytes has been the object of intensive investigation (6,15,16,22,32,35,45,56,57). MSCs suppress both T and B lymphocytes by an apoptotic mechanism associated with the activity of indoleamine 2,3-dioxygenase (IDO) (40). It is now recognized that MSCs exert their biological effects largely by paracrine mechanisms, including the secretion of extracellular vesicles (EVs) (7,19,22,31). EVs are composed of a lipid bilayer including transmembrane proteins and enclosing cytoplasmic components (14). They represent a heterogeneous population including exosomes and microvesicles that differ in their size, origin, and antigenic composition (14). Exosomes are <100 nm in diameter and are released by exocytosis of multivesicular bodies. Microvesicles are similar structures with larger diameter (100-1,000 nm) generated by regulated budding/blebbing of the plasma membrane. EVs are able to stimulate the target cells by binding or fusing with the plasma membrane and transferring organelles (including mitochondria) (29), protein, and nucleic acids (2,3,12,39). Recent studies suggest that EVs isolated from culture media of MSCs exhibit immunomodulatory activity. In a previous work (9), we observed that the inhibitory effect of MSCs on B cells could be reproduced by MSC-EV treatment. We showed that MSC-EVs are able to inhibit the proliferation, differentiation, and Ig production of peripheral blood mononuclear cells (PBMCs) following CpG treatment, similarly to their cells of origin. Here we compared the immunomodulatory properties of MSCs and MSC-EVs on human T lymphocytes stimulated with anti-CD3/CD28 beads. At variance with our previous work on B cells, we observed that in the present experimental setup MSCs and MSC-EVs exert different effects on T lymphocyte function. MSC-EVs appear to be potent inducers of regulatory T cells (Tregs), a characteristic that could have important therapeutic implications.
Materials and Methods
MSC Culture
Commercially available human bone marrow MSCs (BMMSCs) (Lonza, Basel, Switzerland) were plated in polystyrene vented tissue culture flasks (Becton Dickinson, USA) at a density of 4 × 10³cells/cm2 with Mesencult basal medium (StemCell Technologies, Vancouver, BC, Canada) supplemented with 10% ultracentrifuged fetal bovine serum (FBS; Gibco, Grand Island, NY, USA), 100 U/ml penicillin, and 100 μg/ml streptomycin (Gibco). Cultures were incubated at 37°C in a humidified atmosphere containing 5% CO2.
Peripheral Blood Mononuclear Cell Isolation
Blood samples from 11 healthy donors (six males and five females, age ranges between 19 and 40 years old) were recruited at the Blood Transfusion Center of Bambino Gesü Children's Hospital, Rome, Italy. All subjects provided written informed consent. Blood mononuclear cells were prepared from 5-10 ml sodium heparinized blood diluted 1:1 in phosphate-buffered saline (PBS) solution (Gibco). Diluted blood was then layered over Histopaque 1077 (Sigma-Aldrich, St. Louis, MO, USA) solution centrifuged at 400 × g for 30 min. “Buffy coat” cells thus isolated were collected and washed twice with PBS solution, then centrifuged at the same speed for 15 min. The protocol, involving the use of human material, was approved by the Ethical Committee of the Bambino Gesü Children's Hospital.
Extracellular Vesicle Isolation
MSC-EVs were isolated with a modification of the procedure of Lamparski et al. (37) as described previously (9). Cultures of MSCs at 90% confluence were used for the isolation of EVs. The conditioned media used were rescued after 7 days of culture and centrifuged at 1,000 × g for 20 min to remove the debris. To improve EV recovery, 15 ml of supernatant was concentrated by centrifugation for 30 min at 2,800 × g in sterile hydrated 100-kDa MWCO Amicon Ultra Centrifugal filter (Millipore, Bedford, MA, USA) to a volume of 150-200 μl. The concentrated medium was diluted in 8 ml of PBS (Lonza, Verviers, Belgium) in polyallomer tubes (Beckman Coulter, Milan, Italy), then ultracentrifuged at 100,000 × g at 4°C for 1 h. At the end of the procedure, 2 ml from the bottom of the tubes were collected and concentrated by centrifuging for 30 min at 2,800 × g in a sterile 100-kDa MWCO Amicon Ultra Centrifugal filter (Millipore) to a volume of 15-20 μl.
Tunable Resistive Pulse Sensing Analysis of EVs
Particle size distribution and concentration of EVs were analyzed by Tunable Resistive Pulse Sensing (TRPS), a high-resolution technique that measures the change in electrical resistance in a pore as a particle passes through it (IZON Science, Oxford, UK). EVs passing through a pore are detected as a transient change in ionic current flow that is approximately proportional to the volume of EVs (51,54). Freshly isolated MSC-EVs were shipped at 4-8°C and analyzed within 48 h.
Electron Microscopy Examination of EVs
EVs collected from the culture medium of MSC were morphologically evaluated by transmission (TEM) and scanning electron microscopy (SEM). Several drops of EV suspension (about 20 μl each one) were placed on Parafilm (Bemis, Neenah, WI, USA). Formvar-coated copper grids (Electron Microscopy Sciences, Hatfield, PA, USA) were placed over them, in a moist chamber, for 1 h at room temperature. Grids were then briefly washed in 0.1 M cacodylate buffer (CB; Sigma-Aldrich), pH 7.3, fixed for 10 min with 2.5% glutaraldehyde (Fluka, St. Louis, MO, USA) in CB, and contrasted with 2% uranyl acetate (Electron Microscopy Sciences). They were finally air dried and observed under a Philips EM 208 transmission electron microscope equipped with a digital camera (University Centre for Electron Microscopy, CUME, Perugia, Italy). For SEM analysis, EVs adherent to formvar-coated copper grids were fixed as described for TEM. The grids were attached on metal stubs, coated with chrome (Quorum Technologies Ltd., Laughton, Lewes, UK) to a thickness of 10 nm, and examined with a ZEISS-LEO 1525 (Laboratorio Universitario di Nanomateriali, University of Perugia, Perugia, Italy).
Confocal Microscopy Analysis
All antibodies were purchased from BD. MSC-EVs were labeled with PKH26 (Sigma-Aldrich) according to the manufacturer's instructions. Briefly, the isolated EVs were incubated with the dye for 5 min at room temperature. After labeling, EVs were washed with PBS and ultracentrifuged at 100,000 × g for 1 h at 4°C. Supernatant was discarded, and the visible red pellet was resuspended in 20 μl PBS; then 5 × 10⁵ PBMCs were incubated with PKH26-labeled EVs, rinsed in PBS, fixed in 4% formaldehyde (Sigma-Aldrich), blocked with PBS/BSA (5%) for 30 min, and single labeled with the anti-CD3 (1:10; clone SK7) FITC, anti-CD19 (1:10; clone HIB19) APC, and anti-CD56 (1:10; clone B159) FITC-conjugated antibodies. Antibodies were diluted in PBS/bovine serum albumin (BSA; Sigma-Aldrich) (1%) and incubated for 40 min. Nuclei were counterstained with 1 μg/ml Hoechst 33342 (Invitrogen, Molecular Probes, Eugene, OR, USA). Confocal imaging was performed on an Olympus Fluoview FV1000 confocal microscope equipped with FV10-ASW version 2.0 software, Multi Ar (458-188 and 515 nm), 2’ He/Ne (543 and 633 nm), and 405-nm diode lasers, using a 60’ (1.35 NA oil) objective.
Coculture of PBMCs with MSCs or with MSC-EVs
MSCs were plated in 96-multiwell flat bottom culture plates (Corning-Costar, Celbio, Milan, Italy) at the density of 5 × 10⁴ cells/well and cultured in Mesencult basal medium supplemented with FBS (10%). After 6 h for cell adhesion, the medium was aspirated and replaced with fresh PBMCs at 5 × 10⁵ cells/well, corresponding to a ratio of MSCs/PBMC 1:10. In order to evaluate cell proliferation and differentiation, PBMCs were prelabeled with 0.5 μM 5-chloromethylfluorescein diacetate (CMFDA, CellTracker; Invitrogen) according to manufacturer's guidelines and cocultured with MSCs in RPMI-1640 medium (BioWhittaker, Lonza, Belgium) supplemented with 10% ultracentrifuged FBS. T-cell stimulation was achieved by adding Dynabeads Human T-activator CD3/CD28 beads (Invitrogen) at a bead-to-cell ratio of 1:50. We used such suboptimal anti-CD3 anti-CD28 bead/cell ratio because preliminary tests using the standard recommended 1:1 ratio generated a maximal level of total T-cell and Treg stimulation, making it more difficult to reveal the immunomodulatory activity of MSCs and of MSC-EVs. Five-day nonadherent PBMCs (including T cells) were rescued from culture medium, washed in PBS, and analyzed by fluorescent-activated cell analysis (FACSCanto II; BD Biosciences, Sunnyvale, CA, USA). The effect of MSC-EVs was studied with the same procedure and time course, by adding fresh EV preparation (20 μl, containing 4.6 × 10⁸ particles as determined by TRPS analysis) 1 h and 24 h after seeding the PBMCs in the absence of MSCs. The EV concentration was chosen according to the number of particles produced by 2 × 10⁵ seeded MSCs.
Flow Cytometry Analysis
All antibodies were purchased from BD. At the end of the experiments, PBMCs were harvested from culture plates, centrifuged at 300 × g for 5 min, and resuspended in PBS/FBS (2%). Single cell suspensions were incubated in the dark for 20 min at 4°C with directly conjugated monoclonal antibodies directed against the following human surface molecules: CD3 (1:40 Alexa Fluor 700-conjugated; clone UCHT1), CD8 (1:90 APC Cy7 conjugated; clone SK1), CD4 (1:5 CyChrome conjugated; clone L200), CD25 (1:5 PE-conjugated; clone 2A3), CD127 (1:5 allophycocyanin-conjugated, APC; clone 40131.111). CD4+/CD25-/CD127high, and CD4+/CD25+/CD127low cells were considered T effector cells (Teff) and Treg cells, respectively (4). To analyze the expression of FoxP3+ cells, cells were fixed and permeabilized using FoxP3 buffer salt kit (BD Cytofix/Cytoperm 51-2090KZ) according to the manufacturer's guidelines (20). Single-cell suspensions were incubated in the dark for 30 min at room temperature with FITC-monoclonal antibody (clone 259D/C7) directed against the human FoxP3.
After labeling, cells were washed twice in PBS/FBS (2%), and data were acquired with a FACS Canto II (BD). Flow cytometer profiles were analyzed using FACSDiva software (BD). A minimum of 20,000 events were collected per dataset.
For the detection of apoptosis, cultured PBMCs were analyzed by annexin V staining. The cells were centrifuged at 300 × g for 10 min and incubated with the antibody mix previously described. After washing with PBS, 5 μl of annexin V FITC (FITC-conjugated; Calbiochem, Darmstadt, Germany) was added to a final volume of 500 μl of annexin V binding buffer 1x according to the manufacturer's guidelines. After 15 min of incubation in the dark at room temperature, the samples were analyzed by flow cytometry. A minimum of 20,000 events were collected per dataset.
EV flow cytometry analysis was reported previously by our group (9). EVs were isolated with the procedure described above and stained with annexin V in conjunction with vital dye 7-AAD (PerCP conjugated; BD). After incubation, the EV samples were transferred to Troucount tubes (BD) containing calibration beads in order to gate the EVs by morphological parameters.
Cytokine Quantification
The IL-10 quantification was performed in conditioned media from PBMC cultures using the FlowCytomix Analyte Detection kit (eBioscience, San Diego, CA, USA) according to the manufacturer's instructions.
Quantification of IDO Activity
Tryptophan and kynurenine levels in conditioned media of stimulated PBMCs treated with or without BMMSCs or MSC-EVs were measured by reverse-phase HPLC (Agilent Technologies 1200, Waldbronn, Germany). Samples were analyzed using a C18HPH ProteCol® HPLC column (SGE Analytical Science, Australia) and a double-pump HPLC apparatus equipped with spectrophotometric and fluorescence detectors (Agilent Technologies). Briefly, 200-μl sample aliquots were diluted with 200 μl potassium phosphate buffer (0.05 mol/L; pH = 6.0) (Sigma-Aldrich) containing 3-nitro-L-tyrosine (100 μmol/L) (Sigma-Aldrich) as internal standard. Proteins were precipitated with 50 μl of 2 mol/L trichloroacetic acid (Sigma-Aldrich), and vials were immediately vortex mixed and centrifuged for 10 min at 13,000 × g. One hundred fifty microliters of the supernatants was transferred into microvials and placed into the autosampling device (Agilent Technologies). Tryptophan was detected by a fluorescence detector at an excitation wavelength of 285 nm and an emission wavelength of 365 nm. Kynurenine and nitrotyrosine were detected by recording UV absorbance at a wavelength of 360 nm. The concentrations of kynurenine and tryptophan were calculated according to the peak height and were compared both with 3-nitro-L-tyrosine as internal standard and with reference curves built with increasing concentrations of L-tryptophan (10 to 30 μmol/L) and kynurenine (10 to 30 μmol/L).
Statistical Analysis
Normal distribution was tested using the Kolmogorov–Smirnov test; the unpaired t-test or Mann–Whitney U-test was used to evaluate the difference between stimulated PBMC and unstimulated cells. Comparisons between groups were performed with one-way analysis of variance (ANOVA) with Bonferroni's multiple comparison test for data normal distribution for all groups except for IDO activity, which was compared with Kruskal–Wallis test with Dunn's multiple comparison test for data nonnormal distribution. Results were analyzed using the GraphPad Prism software version number 5 (San Diego, CA, USA). Results are expressed as mean ± standard deviation (SD). A result with p < 0.05 was considered statistically significant.
Results
Electron Microscopic Analysis of MSC-EVs
At TEM analysis, MSC-EVs were mainly round shaped, ranging in size from 30 to 150 nm, but the majority was smaller than 100 nm. They were isolated or less frequently aggregated in small clusters and showed a peripheral limiting membrane surrounding a homogeneous electron-lucent to moderately electron-dense content. At SEM, isolated EVs revealed the same characteristics, showing a round shape and overlapping dimensions (Fig. 1). Flow cytometry analysis of MSC-EVs was reported previously (9).
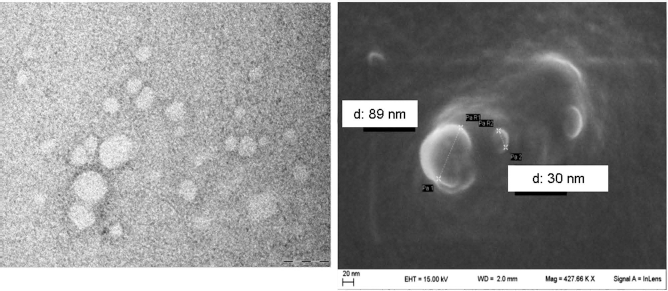
Electron microscopy analysis of extracellular vesicles isolated from MSC medium. At TEM, isolated EVs were round shaped and displayed a diameter ranging from 30 to about 150 nm. They were solitary or aggregated in small clumps and appeared translucent due to their homogeneous electron-lucent content. At SEM, isolated EVs displayed the same features with regard to size and shape. Left panel, TEM. Scale bar: 100 nm. Right panel, SEM. Scale bar: 20nm.
TRPS Analysis of MSC-EVs
TRPS analysis indicated that the diameter of most EVs was less than 150 nm (Fig. 2). It should be noticed that the lower limit of detection of TRPS is ~40 nm; thus smaller particles can only be detected by electron microscopy. Size distribution was similar between samples with a mode size of 76.0 ± 3.5 nm. Raw mean particle concentration at the end of the isolation procedure, measured by TRPS analysis, was 4.0 × 10¹⁰ ± 2.5 × 10¹⁰ particles/ml.

TRPS analysis of MSC-EVs. Particle size distribution obtained from TRPS analysis of MSC-EVs. The graph shows the size distribution of three different EV samples. The mean EV diameter was 102.0 ± 2.5 nm with a mode size of 76.0 ± 3.5 nm.
Confocal Analysis of MSC-EV Association with Stimulated PBMCs
In order to evaluate the association of MSC-EVs with PBMCs, an immunofluorescence analysis of cells stimulated with anti-CD3/CD28 beads and preincubated for 1 h with PKH26-stained EVs was performed with a panel of fluorescently labeled antibodies directed to CD3, CD19, and CD56. The colocalization analysis revealed a consistent association of EVs with CD3+ cells (Fig. 3), whereas only sporadic association was observed with CD19+ and CD56+ cells.

Confocal microscopy of the association between MSC-EVs and stimulated PBMCs. PBMCs stimulated with anti-CD3/CD28 and incubated for 1 h with PKH26-labeled EVs (red) were immunolabeled with antibody against CD3 conjugated to FITC (green). Nuclei were counterstained with Hoechst (blue). Several PKH26-labeled EVs are associated with a CD3+ binucleated cell.
MSCs and MSC-EVs Effects on T-Cell Proliferation
Anti-CD3/CD28 costimulation in 5-day cultures significantly increased the number of proliferating CD3+ cells (6,541 ± 4,685 vs. 152 ± 177, p < 0.0001), as well as CD4+ T cells (4,524 ± 3,638 vs. 81 ± 54, p = 0.002). Stimulation also significantly increased the population of CD4+/CD25+/CD127low Tregs (1,314 ± 778 vs. 7 ± 11, p = 0.0001).
Five-day coculture with MSCs inhibited the proliferation of CD3+ (1,266 ± 1,100 vs. 6,541 ± 4,685, p < 0.05) (Fig. 4A). A nonsignificant effect was observed on the proliferation of CD4+ (1,004 ± 892 vs. 4,524 ± 3,631, p = ns) (Fig. 4B) and Tregs (206 ± 137 vs. 1,314 ± 778, p = ns) (Fig. 4C).
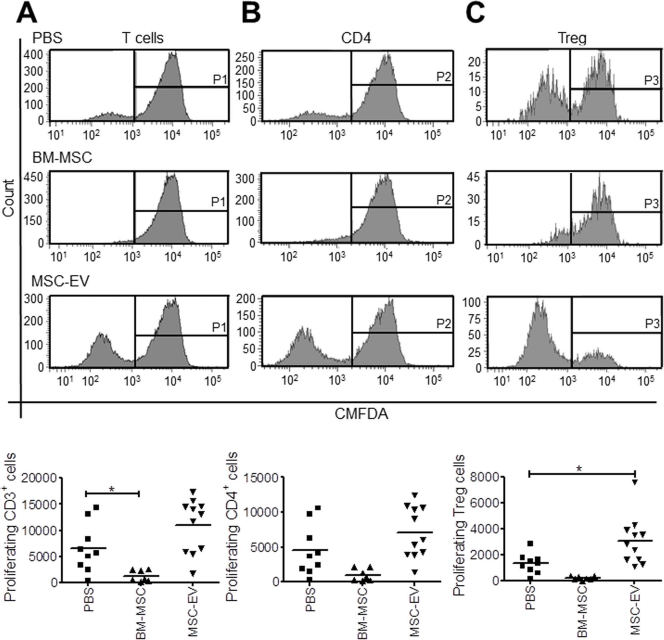
MSC-EVs increase the proliferation of regulatory T cells. Upper panels: representative cytometric analysis performed on (A) CD3+/CMFDA+, (B) CD4+/CMFDA+, or (C) CD4+/CD25+/CD127low/CMFDA+ cells in basal conditions of anti-CD3/CD28 stimulation (PBS), after addition of BMMSCs or MSC-EVs. Lower panels: number of proliferating CMDFA-positive cells. Graphs show individual data and mean (line). Comparisons between groups were performed with one-way analysis of variance with Bonferroni's multiple comparison test, *p < 0.05.
Addition of MSC-EVs to PBMCs did not affect the proliferation of both the CD3+ (10,986 ± 5,163 vs. 6,541 ± 4,685, p = ns) (Fig. 4A) and the CD4+ (7,139 ± 3,679 vs. 4,524 ± 3,638, p=ns) (Fig. 4B) cells as assessed after 5 days of culture. However, addition of MSC-EVs induced a 2.2-fold increase in the proliferation of CD4+/CD25+/CD127low cells (3,068 ± 1,862 vs. 1,314 ± 778, p < 0.05) (Fig. 4C).
Identity of Treg cells was confirmed by the expression of FoxP3+ within CD4+/CD25+/CD127low population (Fig. 5, upper panels). MSC-EV treatment increased the number of CD4+/CD25+/CD127low/FoxP3+ cells (1,329 ± 115 vs. 752 ± 342, p < 0.05) (Fig. 5, lower panel).

MSC-EVs increase the number of FoxP3+ cells. Upper panels: representative density plots of FoxP3+ cells within CD4+/CD25+/CD127low population in basal conditions or after anti-CD3/CD28 stimulation treated with PBS, BMMSCs, or MSC-EVs. Lower panel: number of CD4+/CD25+/CD127low/FoxP3+ cells in stimulated PBMC treated with PBS, BMMSCs, or MSC-EVs. Graphs show individual data and mean (line). Comparisons between groups were performed with one-way analysis of variance with unpaired t-test, *p < 0.05.
Effects of MSCs and MSC-EVs on Apoptosis of Activated T Cells
Coculture with MSCs did not induce apoptosis either in the total CD3+ cell population (242 ± 178 vs. 278 ± 110, p = ns) (Fig. 6A), or in the T-cell subpopulations CD4+ (297 ± 387 vs. 279 ± 252, p=ns) (Fig. 6B) and Tregs (5 ± 5 vs. 19 ± 11, p = ns) (Fig. 6C).

MSC-EVs increase the apoptosis of total CD3+ and CD4+ cells. Upper panels: representative cytometric analysis performed on (A) CD3+/annexin V+, (B) CD4+/annexin V+, or (C) CD4+/CD25+/CD127low/annexin V+ cells in basal conditions of anti-CD3/CD28 stimulation (PBS), after addition of BMMSCs or MSC-EVs. Lower panels: number of the apoptotic annexin-positive cells. Graphs show individual data and mean (line). Comparisons between groups were performed with one-way analysis of variance with Bonferroni's multiple comparison test, *p < 0.05.
On the contrary, as shown in Figure 6A, MSC-EVs increased the apoptosis of the total CD3+ population (972 ± 625 vs. 278 ± 110, p < 0.05), of CD4+ cells (1,135 ± 890 vs. 279 ± 252, p < 0.05) (Fig. 5B), and of Tregs (134 ± 85 vs. 19 ± 11, p < 0.01) (Fig. 6C).
Effect of MSCs and MSC-EVs on the Treg/Teff Ratio
The ratio of Treg to Teff cells was increased by MSC-EVs (2.441 ± 1.941 vs. 0.488 ± 0.238, p < 0.01) (Fig. 7), while it was not affected by MSCs (0.207 ± 0.112 vs. 0.488 ± 0.238, p=ns).

MSC-EVs increased the Treg/Teff ratio. Upper panels: representative density plots. Cytometric analysis of stimulated PBMCs cultured with or without MSCs or MSC-EVs. CD4+/CD25+/CD127low cells were gated in Treg, while CD4+/CD25-/CD127high were gated in Teff. In the lower panel the ratio of Tref/Teff was evaluated. Lower graph shows individual data and mean (line). Comparisons between groups were performed with one-way analysis of variance with Bonferroni's multiple comparison test, *p < 0.01.
MSC-EV Induction of the Immunosuppressive Cytokine IL-10
MSC-EV treatment almost doubled the concentration of IL-10 (216 ± 22 vs. 115 ± 53 pg/ml, p = 0.037) in culture medium, while no difference was observed with MSC coculture (75 ± 110 vs. 115 ± 53, p=ns) (Fig. 8).

MSC-EV treatment increased the levels of the anti-inflammatory cytokine IL-10. The levels of the anti-inflammatory cytokine IL-10 were evaluated in conditioned media of stimulated PBMCs treated with or without BMMSCs or MSC-EVs. Results are mean + SD of at least three independent experiments. Comparisons between groups were performed with one-way analysis of variance with Bonferroni's multiple comparison test, *p < 0.05.
MSC-EV IDO Independent Activity
As shown in Figure 9, IDO activity was demonstrated by low levels of tryptophan associated with increased kynurenine in media of PBMCs cocultured with MSCs. Conversely, no IDO activity was detected in conditioned medium of PBMC treated with MSC-EVs.

IDO-independent activity of MSC-EVs. The levels of tryptophan and kynurenine were measured by reverse-phase HPLC in the conditioned medium of stimulated PBMC treated with or without BMMSCs or MSC-EVs. Graphs show individual data and mean (line). Comparisons between groups were performed with Kruskal–Wallis test with Dunn's multiple comparison test, *p < 0.01.
Discussion
MSCs were shown to modulate T-cell proliferation and activation in different experimental protocols. Antigen-reactive T cells exposed to MSCs fail to efficiently progress through the cell cycle (5,18,26). When human MSCs were added in cocultures with purified subpopulations of immune cells, the cytokine secretion profile of dendritic cells, naive and effector T helper 1 (Th1) and Th2 cells was altered, resulting in a more anti-inflammatory phenotype (1). Work by Beyth et al. (6) supports an immunoregulatory mechanism, wherein MSCs inhibit T cells indirectly by contact-dependent induction of regulatory antigen-presenting cells (APCs) with T-cell-suppressive properties. Additional studies suggest that T-cell inhibition is not antigen specific but acting through HLA both on primary and secondary responses (35).
MSCs secrete soluble immune-suppressive molecules (18,28,53). Upregulation of intracellular pathways such as IDO-mediated tryptophan catabolism by MSCs (40) results in the accumulation of toxic kynurenines with inhibition of T-cell proliferation. Upregulation of stress response pathways such as inducible nitric oxide synthetase (49,52) also variably contributes to MSC-induced immune suppression, with notable species differences. During MSC-mediated immunomodulation, proinflammatory cytokines have been shown to play a key role, provoking MSCs to express iNOS (in rodents) or IDO (in humans) associated with T-cell suppression (48).
In their clinical application for the treatment of immune disorders, however, administrated MSCs might encounter insufficient proinflammatory cytokines or a biased cytokine milieu in vivo, and insufficient levels of proinflammatory cytokines or iNOS/IDO activity would actually render MSCs immune enhancing (48). Another important mechanism determining the immunomodulatory effect of MSCs was described by Waterman et al. (55). According to these authors, MSCs can polarize to a proinflammatory or to an immunosuppressive phenotype depending respectively on toll-like receptor (TLR) 4 or TLR3 priming, thus again depending on the characteristics of the inflammatory environment.
Thus, MSCs appear to respond to environmental signals possibly resulting in unpredictable opposite behaviors in vivo. Actually, MSCs could promote the proliferation of suboptimally activated T cells (38,50). These findings suggest that it is important to be aware of the potential differential effects of cytokines or drugs on the expression and activity of IDO when applying MSCs in the treatment of disease, as they are a critical switch that determines the immunomodulatory fate of MSCs.
In the present experimental setup, MSCs significantly inhibited the proliferation of activated T cells, without inducing apoptosis, a finding also reported by other investigators (11,17,26,36,42,58). Inhibition of CD3+ cells also included the Treg population. Thus, in the described conditions, MSCs did not induce Treg proliferation. A similar lack of induction was observed in a different in vitro setup (35). MSC-EVs exerted a quite different effect, since they induced T-cell apoptosis without significantly suppressing cell proliferation. However, MSC-EVs strongly induced Treg proliferation. The Treg/Teff ratio was enhanced by MSC-EVs, indicating a net immunosuppressive effect, confirmed by increased concentrations of the anti-inflammatory cytokine IL-10 in culture medium. The observed increased Treg apoptosis probably resulted from an accelerated progression through the cell cycle, since it is associated with increased proliferation in this cell population.
The comparison between the effects of MSCs and MSC-EVs should be taken with caution because of the variable results obtained following induction of T lymphocytes with different stimuli and with different coculture procedures. For instance, Prevosto et al. (46) evaluated the regulatory CD4+ or CD8+ activity of lymphocytes harvested in cocultures of PBMCs with MSCs. This lymphocyte population contained a variable proportion of CD25+ cells, termed regulatory cells, that strongly inhibited lymphocyte proliferation induced by secondary mixed lymphocyte reaction (MLR) or anti-CD3 or phytohemagglutinin.
The present experimental setup with anti-CD3/CD28 beads involves a costimulation pathway. We used a suboptimal bead-to-cell ratio because we observed that with the standard 1:1 ratio the immunomodulatory effect of MSCs and of MSC-EVs was largely blunted. In theory, the present procedure, at appropriate suboptimal anti-CD3/CD28 bead/ratio, might reproduce more “physiological” conditions to explore the immunomodulatory activity of MSCs and MSC-derived products. However, one cannot exclude that different stimuli could lead to different results, as reported by other authors exploring the immunomodulatory effects of MSCs on T cells (46). Interestingly, similarly to our findings, Mokarizadeh et al. (41) found that MSC-EVs induced apoptosis of activated T cells, generation of Tregs, and expression of anti-inflammatory cytokines in an animal model of demyelinating autoimmune disease of central nervous system.
As discussed above, MSCs need to be activated by proinflammatory cytokines present in the microenvironment in order to exhibit their immunosuppressive effects. The increased IDO activity in the supernatant of MSC/PBMC cocultures indicates that such an activation took place. On the contrary, IDO activity was absent following addition of MSC-EVs. Collectively, our findings in the present experimental setup suggest that, even if both MSCs and MSC-EVs exert immunosuppressive effects on T cells, their mechanisms of action are different. Interestingly, MSC-EVs express galectin-1 and PD-L1 (25,33), two molecules also expressed on MSC surface (30,43). Galectin-1, an endogenous leptin, has been shown to induce apoptosis of activated T cells (47) and to promote the generation of Tregs (8). PD-L1, a negative costimulatory molecule for PD-1, also promotes Treg proliferation and function (23,24,27). Moreover, MSC-EVs express TGF-β (41), a well-known inducer of Tregs (13,21,43).
Results of our previous work on B cells suggested that the immunomodulatory activity of MSCs was mostly conveyed by EVs, since these microparticles could reproduce the effects observed with their cells of origin in CpG-stimulated PBMCs (9). However, the divergent effects of MSCs and MSC-EVs on T cells stimulated with anti-CD3/CD28 are at present unexplained. MSCs produce a variety of immunomodulatory molecules depending on the microenvironment, the net effect likely resulting from a combination of different signals, including EVs. Since EVs are not whole living cells but rather represent cell products carrying specific paracrine signals, one could expect these effects to be less dependent on the environment and thus more predictable. Indeed, MSC-EVs are attracting increasing interest since they might represent a more convenient therapeutic tool with respect to their cells of origin. Interestingly, a case of successful treatment with MSC-EVs in a patient with steroid-resistant GVHD was recently reported (34). However, additional work both in vitro and in vivo is needed in order to better understand both the potency and the mechanisms of action of this novel potential immunosuppressive tool.
Footnotes
Acknowledgments
The work was supported by the Italian Ministry of Health. We thank Stefania Petrini for the confocal analysis. A patent entitled “Mesenchymal stromal cell-derived microvesicles as immunosuppressive agents” has been submitted (PTC28702). Inventors/applicants: Maurizio Muraca and Alessandra Fierabracci. International filing date: July 26, 2012. National date: July 28, 2011. The authors declare no conflicts of interest.