
Abstract
MicroRNAs (miRNAs) are critically important in both normal neuronal development and neurological diseases. Although cerebral ischemia has been shown to alter the miRNA profiles of rats, the role of miRNA in the cornu ammonis 1 region of the gerbil hippocampus under ischemic tolerance has not been studied. In the present study, Mongolian gerbils were subjected to one or three times the nonlethal dose of 2-min transient common carotid artery occlusion (tCCAO). miRNA microarray technology detected 251 miRNAs and the expression of seven of these in terms of ischemic tolerance. They were compared at different time points: 1 day, 7 days, 1 month, and 6 months. mmu-miR-15a-5p, related to neurogenesis, showed increased expression after one dose of 2-min tCCAO and was much higher after three doses. An increase in sha-miR-24 and oan-let-7b-3p, related to transactivation response DNA-binding protein (TDP43), was observed after one dose of 2-min tCCAO, but the peak was accelerated to an earlier period of reperfusion after three doses. In contrast, mmu-miR-125b-5p and mmu-miR-132–5p, related to fused in sarcoma/translocated in liposarcoma (FUS/TLS), showed similar increases at both doses. mmu-miR-181c-5p and mmu-miR-378a-5p, related to heat shock protein 70 (HSP70), also showed accelerated expression after three doses. This data set provides new insight about miRNA expression during neurogenesis, and related to TDP43, FUS/TLS, and HSP70, which may be useful when pursuing further studies on the possible use of miRNAs as biomarkers in cerebral ischemic tolerance and neuroregeneration.
Introduction
MicroRNAs (miRNAs) are small noncoding ribonucleic acids (RNAs) that regulate gene expression at the posttranscriptional level (19,45). They function by binding to complementary sites on the 3′ untranslated region of genes and promote the recruitment of protein complexes responsible for degrading messenger RNA (mRNA) and/or impairing translation (31). The human genome has been estimated to contain up to 1,000 miRNAs, and each miRNA affects approximately 200 species of mRNAs (32). However, gerbil miRNAs have not yet been examined.
Several miRNAs have been found to target transcription factors regulating embryonic stem cell (ESC) self-renewal and differentiation (44,50), and other miRNAs have been shown to facilitate critical reprogramming toward induced pluripotent stem cells (iPSCs) (4,22,47). Recent studies showed that various pathological conditions significantly altered cerebral miRNA profiles, which could affect the disease outcome (7) in Alzheimer's disease (AD) (20), stroke (21,34), tumor growth (40), Down syndrome (25), and schizophrenia (6).
We previously reported that a single 2-min ischemia induced no neuronal damage, but three repeated 2-min ischemic insults caused neuronal damage, and significant neuronal cell recovery subsequently occurred in the selectively vulnerable region cornu ammonis 1 (CA1) in the hippocampus (48). Short-period transient ischemia can induce ischemic tolerance (23), which is a protective response against several subsequent lethal ischemias and can induce change in the cerebral miRNAome (13,43). Ischemic preconditioning offers endogenous neuroprotection by changing gene expression and altering protein synthesis (46). miRNAs are critically important to both normal neuronal development and in many neurological diseases. The gerbil model of transient global cerebral ischemia is well studied, particularly the underlying mechanisms of ischemic tolerance mainly to the pyramidal neurons in the hippocampal CA1 region. Increased induction of neuronal apoptosis is known to occur in this model (30). However, the role of miRNA in the CA1 region of the gerbil hippocampus in ischemic tolerance and following neurogenesis has not yet been studied.
We hypothesized that miRNAs may serve as important mediators of RNA processing and resulting protein synthesis required for ischemic tolerance as well as neurogenesis. Thus, we examined changes in miRNA expression in the preconditioned gerbil hippocampal CA1 sector after transient common carotid artery occlusion (tCCAO).
Materials and Methods
Experimental Model
Experiments were performed with male Mongolian gerbils (Japan SLC Inc., Shizuoka, Japan). The 10- to 12-week-old gerbils weighing about 80 g were maintained in a temperature-regulated room (23–25°C) at a 12-h light/dark cycle for at least 7 days. The gerbils were fasted, but were allowed free access to water overnight before surgery. In total, 18 gerbils were randomized into three groups. When the animals began to regain consciousness after anesthesia, both common carotid arteries (CCAs) of the first and second groups (n = 8 each) were occluded with surgical microclips (RS-5424; Roboz Surgical Instrument Co., Gaithersburg, MD, USA) for 2 min of tCCAO. For the second group (n = 8), secondary occlusion of both CCAs for 2 min was induced 2 days later, and then in the same way for tertiary occlusion, with a total of three rounds of tCCAO at 2-day intervals. Gerbils of the sham control (SC) group were treated only once with a neck incision without any artery occlusion. The animals were allowed to recover for 1 day, 7 days, 1 month, or 6 months at ambient temperature (23–25°C), then were deeply anesthetized with pentobarbital (IP, 40 mg/kg; Kyoritsu Seiyaku Corporation, Saitama, Japan) and decapitated. SC animals were sacrificed in the same way just after the sham operation.
tCCAO and Reperfusion
Transient global forebrain ischemia was induced into gerbils by occluding bilateral CCA, as per our previous method (3). Briefly, gerbils were lightly anesthetized after inhaling a nitrous oxide/oxygen/isoflurane (69%:30%:1%; Air Water Inc., Okayama, Japan) mixture. Body temperature was monitored in all animals, and was maintained at 37 ± 0.3°C by using a heating pad (model BMT-100; Bio Research Center, Nagoya, Japan) during surgery. A midline neck incision was made, and both CCAs were exposed. Animals began to regain consciousness after the end of anesthesia, and both CCAs were occluded with surgical microclips. After 2 min of tCCAO, cerebral blood flow was restored by removing the microclips. At 1 day, 7 days, 1 month, and 6 months after reperfusion, the animals were euthanized as described above (n = 2) using a previously defined method (28). Then, all brains were dissected, quickly frozen in powdered dry ice, and stored at −80°C until subsequent preparation.
All animal experiments were approved by the Animal Committee of the Graduate School of Medicine and Dentistry, Okayama University. All institutional and national guidelines for the care and use of laboratory animals were followed.
Total RNA (Including miRNA) Isolation From Gerbil Brain Samples
The bilateral hippocampal CA1 region of the frozen brain was dissected and combined in a cryostat (HM 500M; Microm Inc., Mound, MN, USA) at −18°C. Total RNA containing miRNA was isolated from about 5 μg of the hippocampal CA1 region suspended in RNA-Later ICE (Ambion Inc., Austin, TX, USA) using a mirVana™ miRNA Isolation Kit (Ambion). The concentration, quality, and integrity of total RNA were determined using a NanoDrop Spectrophotometer (ND-1000; NanoDrop Tech, Rockland, DE, USA). The ratio of OD260/OD280, which was >1.8 for all RNA samples, was used to ascertain the quality of RNA. RNA samples were stored at −80°C before miRNA array studies.
Gerbil miRNA Sequencing
For each SC or ischemic brain sample, an equal amount of total RNA was pooled from three biological replicates to generate enough RNA (approximately 1,000 ng) for deep sequencing (Table 1). Briefly, the isolated total RNAs of each sample were resolved on a denaturing 15% polyacrylamide gel (Bio-Rad Laboratories, Hercules, CA, USA) for size selection, and these small RNAs (≤30 bases) were ligated to a pair of Solexa adaptors at the 5′ and 3′ ends using T4 RNA ligase. After ligation and purification, adapter-ligated small RNAs were reverse transcribed and amplified for 15 cycles (cDNA RT-PCR) with a pair of adapter complementary primers in order to produce sequencing libraries. PCR products were then purified and directly sequenced using an Illumina HiSeq2000 instrument (Illumina Inc., San Diego, USA).
MicroRNAs Targeted by the Transient Ischemia-Induced MicroRNA

mmu-miRNA, Mus musculus (mouse) microRNA; sha-miR, Sarcophilus harrisii (Tasmanian devil) microRNA; oan-let-7d: Ornithorhynchus anatinus (platypus) let-7d microRNA.
miRNA Microarray Analysis
Groups of gerbils subjected to tCCAO were sacrificed at various reperfusion periods (1 day, 7 days, 1 month, and 6 months; n = 2 at each time point). To perform the miRNA array experiment, total RNA (2–5 μg) was size fractionated on a Microcon centrifugal filter (YM-100; Millipore, Billerica, MA, USA). To the small RNAs (<300 nucleotides), poly-A tails were added at the 3′ end mediated by poly(A) polymerase, and nucleotide tags were ligated to the poly-A tails. Each sample was hybridized to a microarray (LC Sciences, Houston, TX, USA) that contained gerbil miRNA probes. Thereafter, an oligonucleotide was ligated to the poly-A tail for later staining with fluorescent dye Cy3. Hybridization was performed overnight using μParaFlo® microfluidic technology. Hybridization images were collected using a laser scanner (GenePix 4000B; Molecular Device, Sunnyvale, CA, USA) and digitized using Array-Pro image analysis software (Media Cybernetics, Bethesda, MD, USA). Correlations between fluorescence signal intensities from the laser scanner and expression levels of different miRNA sequences were generally proportional. Since fluorescence intensity was the read-out of the laser scanner, fluorescence intensity data were expressed with no absolute units in the figures of this study.
Statistical Analysis
All data in this study are presented as means ± SD. Data from different groups were normalized and statistically analyzed using one-way ANOVA, followed by Tukey's post hoc comparison. The normalized hybridization data of the microarrays were subjected to hierarchical cluster analysis using the Euclidian distance function. To increase the validity of the data, cross-comparison matrices were generated. For example, data from the two sham chips were crosscompared with the two tCCAO chips (at each time point) to generate a matrix of four comparisons. Statistical analyses were performed using SPSS (ver. 13.0; IBM, Armonk, NY, USA). All tests were considered statistically significant at a value of p < 0.05, as per our previous report (12).
Results
miRNA Expression Profile in Gerbil Hippocampus
A total of 1,067 miRNAs (LC Sciences, Houston, TX; USA) were screened in samples of the CA1 region from gerbils subjected to tCCAO. A total of 251 miRNAs were detected in samples of one or three doses of tCCAO. Since no miRNA data for gerbils are available, the sequences of mouse and some other animal species' miRNAs were used for this study (Fig. 1A, Table 1). Each column in Figure 1B–E represents a single sample, and each row represents a single miRNA. Black squares represent the median level of miRNA, and green or red squares represent lower or higher levels than the median level of miRNA expression, respectively.
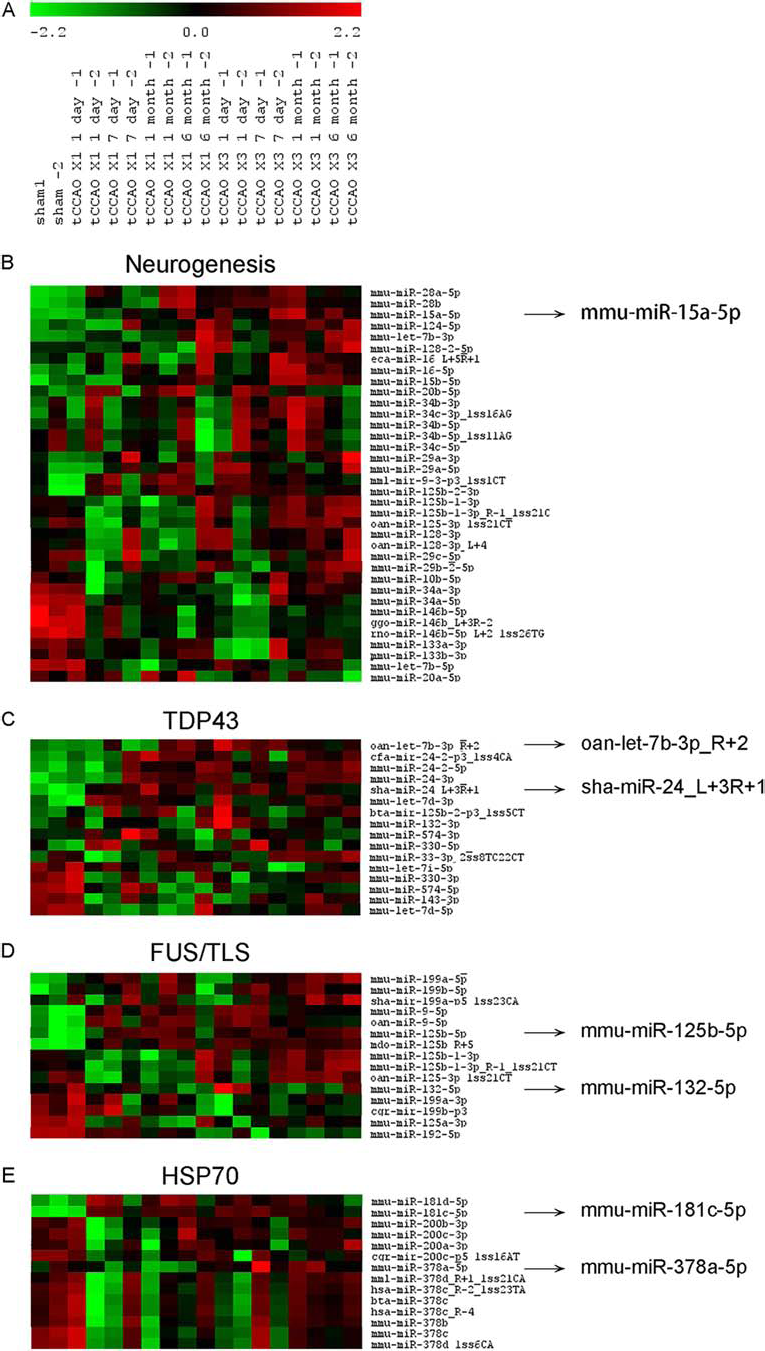
Time-dependent profiles of microRNA expression in gerbil hippocampus. Hierarchical clustering of miRNAs detected in the hippocampal CA1 region showed four distinct clusters for neuroprotection and protein expression. Each column represents a single sample, and each row represents a single miRNA. Black squares represent median level of miRNA, and green or red squares represent lower or higher levels than the median level of miRNA expression, respectively (A). Clusters B, C, D, and E contained miRNAs related to neurogenesis, 43 kDa transactivation response DNA-binding protein (TDP43), fused in sarcoma/translocated in liposarcoma (FUS/TLS), and heat shock protein 70 (HSP70), respectively. tCCAO, transient common carotid artery occlusion; mmu-miR, Mus musculus (mouse) microRNA; oan-let-7b, Ornithorhynchus anatinus (platypus) let-7d microRNA; sha-miR-24, Sarcophilus harrisii (Tasmanian devil) microRNA 24.
Hierarchical clustering of the miRNAs detected in the brain showed four distinct clusters for neurogenesis and protein expression (Fig. 1B–E). Cluster B contained Mus musculus (mouse)-let-7b (mmu-let-7b), Macaca mulatta (rhesus monkey; mml)-miR-9, mmu-miR-10b, mmu-miR-15a, mmu-miR-15b, Equus caballus (horse; eca)-miR-16, mmu-miR-16, mmu-miR-20 (a, b), mmu-miR-28 (a, b), mmu-miR-29 (a, b, c), mmu-miR-34 (a, b, c), mmu-miR-124, mmu-miR-128, oan-miR-128, mmu-miR-125b, Ornithorhynchus anatinus (platypus; oan)-miR-125, mmu-miR-133 (a, b), mmu-miR-146b, Gorilla gorilla gorilla (gorilla; ggo)-miR-146b and rno-miR-146b, related to neurogenesis (18,27,29); cluster C contained mmu-let-7 (b, d, i), oan-let-7b, Canis familiaris (dog; cfa)-mir-24, mmu-miR-24, Sarcophilus harrisii (Tasmanian devil; sha)-miR-24, mmu-miR-33, mmu-miR-132, mmu-miR-143, mmu-miR-330, and mmu-miR-574, related to 43 kDa trans-activation response DNA-binding protein (TDP43) (9,10, 24); cluster D contained mmu-miR-9, oan-miR-9, mmu-miR-12, mmu-miR-132, mmu-miR-192, mmu-miR-199 (a, b), and sha-miR-199a, related to fused in sarcoma/translocated in liposarcoma (FUS/TLS) (38); cluster E contained mmu-miR-181 (c, d), mmu-miR-200 (a, b, c), and mmu-miR-378 (a, b, c, d), related to heat shock protein 70 (HSP70) (41,49).
Target Analysis of Differently Expressed miRNAs
Among the above four clusters, miRNA expression profiles for mmu-miR-15a-5p, sha-miR-24_L+3R+1, oan-let-7b-3p_R+2, mmu-miR-125b-5p, mmu-miR-132–5p, mmu-miR-181c-5p, and mmu-miR-378a-5p were compared in the CA1 subfield of gerbils subjected to one or three doses of 2-min tCCAO. Heat maps showed the pattern of miRNA expression among the different experimental groups. These expressed miRNAs were used for further analyses (Figs. 2, 3, 4).

mmu-miR-15a-5p expression during neuroprotection. From the signal strength of 820 ± 22 in SC brains (gray circle), the signal strength slowly, but progressively, increased in the CA1 region after 2-min tCCAO for one dose (open diamonds) and three doses (filled squares). Note the higher strength after three doses versus one dose (*p < 0.05 vs. SC, **p < 0.01 vs. SC).

MicroRNA changes for FUS/TLS and TDP43. MicroRNA changes from baseline SC brains (gray circles) for FUS/TLS (A, C) and TDP43 (B, D). The signal strength of mmu-miR-125b-5p and mmu-miR-132–5p showed a similar increasing pattern in both groups of 2-min tCCAO for one dose (open diamonds) and three doses (filled squares) (*p < 0.05 vs. SC) (A, C). In contrast, the peak time of sha-miR-24 and oan-let-7b-3p accelerated to 1 day from three doses (filled squares) to one dose (open diamonds), then gradually returned until 6 months (*p < 0.05 vs. SC, **p < 0.01 vs. SC) (B, D).
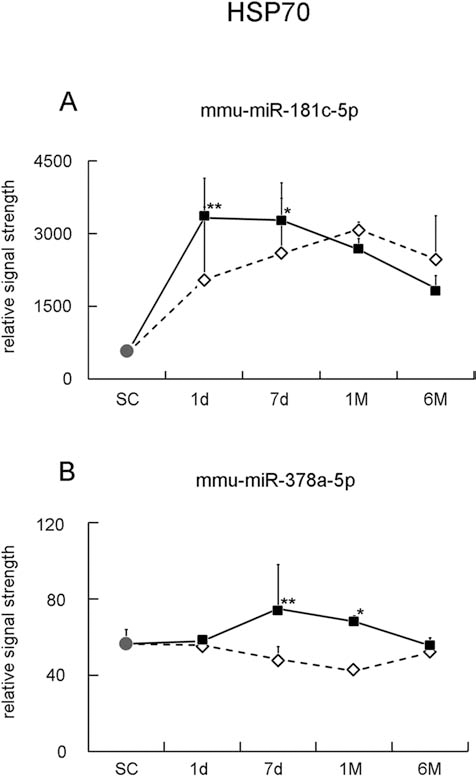
MicroRNA changes for HSP70. Note the peak time acceleration to 1 day and 7 days from one dose (open diamonds) to three doses (filled squares), with a gradual return to 6 months in mmu-miR-181c-5p and mmu-miR-378a-5p (*p < 0.05 vs. SC, **p < 0.01 vs. SC.
mmu-miR-15a-5p Expression for Neurogenesis
The signal strength of mmu-miR-15a-5p for the hippocampal CA1 region is shown in Figure 2. Signal strength was 820 ± 22 in the SC brains (Fig. 2, circle). After one dose of 2-min tCCAO, the signal strength was slowly, but progressively, induced in the CA1 region. From the baseline of the SC level, the strength of miRNA increased to 943 ± 153, 1,125 ± 196, 1,163 ± 37, and 1,373 ± 244 at 1 day, 7 days, 1 month, and 6 months, respectively (Fig. 2, open diamonds). In the group of three doses of 2-min tCCAO, the signal strength showed a similar pattern to that of the one dose, but the strength was much higher: 1,301 ± 186, 1,438 ± 311, 1,525 ± 356, and 1,386 ± 166 at 1 day, 7 days, 1 month, and 6 months, respectively (*p < 0.05 vs. SC, **p < 0.01 vs. SC, filled squares) (Fig. 2).
sha-miR-24 and oan-let-7b-3p Expression for TDP43
The signal strength of sha-miR-24_L+3R+1 was 7,098 ± 920 in the hippocampal CA1 region of the SC brains (Fig. 3B, circle). From the baseline level of the SC brain, the strength of miRNA increased to 9,327 ± 2,889 and 12,134 ± 240 at 1 day and 7 days, peaked at 1 month (13,790 ± 2,885) then slightly returned at 6 months (11,543 ± 1,776) after one dose of 2-min tCCAO (Fig. 3B, open diamonds). In the group of three doses of 2-min tCCAO, the peak time accelerated to 1 day (13,122 ± 781), then gradually returned until 6 months. The strength of miRNA was 12,421 ± 2,319, 12,452 ± 1,159, 10,586 ± 167 at 7 days, 1 month, and 6 months, respectively (*p < 0.05 vs. SC, **p < 0.01 vs. SC, filled squares) (Fig. 3B).
The signal strength of oan-let-7b-3p_R+2 was 18 ± 2 in the hippocampal CA1 region of the SC brains (Fig. 3D, circle). From the baseline level of the SC brain, the strength of miRNA increased to 17 ± 1, 25 ± 16, 30 ± 18, and 46 ± 11 at 1 day, 7 days, 1 month, and 6 months, respectively, after one dose of 2-min tCCAO (Fig. 3D, open diamonds). In the group of three doses of 2-min tCCAO, the signal strength peaked at 1 day (63 ± 18), then returned from 7 days to 6 months. The strength of miRNA was 46 ± 6, 35 ± 1, and 32 ± 6 at 7 days, 1 month, and 6 months, respectively (*p < 0.05 vs. SC, **p < 0.01 vs. SC, filled squares) (Fig. 3D).
mmu-miR-125b-5p and mmu-miR-132–5p Expression for FUS/TLS
The signal strength of mmu-miR-125b-5p and mmu-miR-132–5p for the hippocampal CA1 region is shown in Figure 3A and 3C. The signal strength of mmu-miR-125b-5p (Fig. 3A) showed a similar increasing pattern in both groups of 2-min tCCAO at both doses. From the baseline level of the SC brain (17,508 ± 2,915) (Fig. 3A, circle), the strength of mmu-miR-125b-5p was 18,392 ± 2,680, 25,851 ± 715, 27,273 ± 166, 22,717 ± 3,889 at 1 day, 7 days, 1 months, and 6 months after one dose of 2-min tCCAO (Fig. 3A, open diamonds), and 24,879 ± 456, 26,344 ± 152, 24,574 ± 1,301, 26,728 ± 1,236 at 1 day, 7 days, 1 months, and 6 months after three doses (*p < 0.05 vs. SC, filled squares) (Fig. 3A).
The signal of mmu-miR-132–5p increased and peaked at 1 day then was downregulated from 7 days to 6 months in both groups (Fig. 3C). From the baseline level of the SC brain (705 ± 30, Fig. 3C, circle), the strength of mmu-miR-132–5p was 769 ± 209, 710 ± 57, 601 ± 37, 541 ± 46 at 1 day, 7 days, 1 month, and 6 months after one dose of 2-min tCCAO (Fig. 3C, open diamonds), and 1,009 ± 152, 637 ± 64, 574 ± 71, 678 ± 176 at 1 day, 7 days, 1 month, and 6 months after three doses (*p < 0.05 vs. SC, filled squares) (Fig. 3C).
mmu-miR-181c-5p and mmu-miR-378a-5p Expression for HSP70
The signal strength of mmu-miR-181c-5p was 530 ± 45 in the hippocampal CA1 region of the SC brains (Fig. 4A, circle). From the baseline level of the SC brain, the signal strength of miRNA increased to 2,056 ± 2,091, 2,587 ± 1,144, and 3,094 ± 144 at 1 day, 7 days, and 1 month, peak at 1 month, then returned slightly at 6 months (2,479 ± 892) after one dose of 2-min tCCAO (Fig. 4A, open diamonds). In the group of three doses of 2-min tCCAO, the peak time accelerated to 1 day (3,330 ± 224), then gradually returned to 3,278 ± 772, 2,675 ± 226, and 1,870 ± 264 at 7 days, 1 month, and 6 months, respectively (*p < 0.05 vs. SC, **p < 0.01 vs. SC, filled squares) (Fig. 4A).
The signal strength of mmu-miR-378a-5p was 56 ± 8 in the hippocampal CA1 region of the SC brains (Fig. 4B, circle). From the baseline of the SC level, the strength of miRNA decreased to 56 ± 2, 48 ± 7, 42 ± 1, and 52 ± 8 at 1 day, 7 days, 1 month, and 6 months, respectively, after one dose of 2-min tCCAO (Fig. 4B, open diamonds). In the group of three doses of 2-min tCCAO, signal strength was induced in the CA1 region with a peak time at 7 days (75 ± 23), then returned from 1 month to 6 months. The strength of miRNA was 58 ± 1, 68 ± 3, and 55 ± 0 at 1 day, 1 month, and 6 months, respectively (*p < 0.05 vs. SC, **p < 0.01 vs. SC, filled squares) (Fig. 4B).
Discussion
In the present study, miRNA microarray technology detected 251 miRNAs from the hippocampal CA1 region of gerbils after tCCAO. Among these miRNAs, seven miRNA expression profiles were compared in terms of ischemic tolerance in gerbils subjected to one or three doses of 2-min tCCAO (Table 1, Fig. 1). mmu-miR-15a-5p for neurogenesis showed increased expression after one dose of 2-min tCCAO, which was much higher in the three-dose group (Fig. 2). Time-dependent increases of sha-miR-24 and oan-let-7b-3p for TDP43 were observed after one dose of 2-min tCCAO, but the peak time accelerated to an earlier period of reperfusion after three doses (Fig. 3B, D). In contrast, mmu-miR-125b-5p and mmu-miR-132–5p for FUS/TLS showed a similar increase in both groups after one or three doses (Fig. 3A, C). mmu-miR-181c-5p and mmu-miR-378a-5p for HSP70 also showed accelerated expression after three doses (Fig. 4).
Mongolian gerbils are particularly susceptible to bilateral carotid occlusion, which results in transient global brain ischemia, due to an incomplete circle of Willis (15). We already reported typical cresyl violet staining of the hippocampal CA1 region in our previous article (48). Moreover, hippocampal CA1 cells are the most vulnerable region in cerebral ischemia (17). CA1 pyramidal neurons both in experimental animals and in humans undergo selective cell death after transient ischemia (8). No change in cell density of the CA1 pyramidal neurons was observed between the SC group and the gerbil group subjected to a single 2-min tCCAO from 1 day to 6 months later. However, in the gerbil group subjected to 2-min tCCAO three times, neuronal loss was observed in the CA1 region. Although most hippocampal CA1 neurons survived at 1 day after 3 × 2-min tCCAO, large numbers of CA1 neurons were gradually lost from 3 to 7 days. After the significant loss at 7 days, CA1 cell density gradually recovered from 1 to 6 months (48). Although single 2-min ischemia depletes high-energy phosphate compounds and perturbs protein synthesis, it has not been reported to cause neuronal death. Therefore, 2-min ischemia was selected as mild ischemic treatment for subsequent neuroprotection (36). In the gerbils' hippocampal CA1 regions, 2-min ischemia for ischemic preconditioning is extremely effective in providing protection against cell death.
Our previous study showed that ischemic preconditioning offers a way to induce endogenous neuroprotection and neurogenesis in gerbils (48). Changes in TDP43, FUS/TLS, and HSP70 proteins were involved in this function. Significant changes to TDP43 and FUS/TLS were observed in the ischemic brains. The colocalization of TDP43 with markers for RNA transport and stress granules suggests that TDP43 may play a role in sequestering and regulating the stability of mRNAs necessary for the neuronal response to stress or injury (37). TDP43 and FUS/TLS are both DNA/RNA-binding proteins involved in transcriptional regulation, mRNA splicing, transport, and translation (39). Previously, we showed that ischemic preconditioning accelerated HSP70 gene expression at the transcriptional level, ameliorated the translational disturbance of mRNA to protein, and saved CA1 cells from subsequent lethal ischemia (2). Molecular mechanisms indicate how ischemic preconditioning alters the balance between cell survival and cell detrimental signaling pathways.
Transient cerebral ischemia reprograms the response of nerve cells for subsequent ischemia. A previous report suggested that neuroprotection by a short period of transient ischemia may depend on altered miRNA expression (46). Ischemic tolerance can be obtained by a large change in gene expression, the functions of which influence protein turnover, cell cycle regulation, and ion channel abundance. For this tolerance, an endogenous genomic program may be present, serving as an adaptation to improve survival against oxygen limitation (14). The microarray findings in this study suggest that miRNAs are effectors of ischemic tolerance (Fig. 1).
The present study shows that transient forebrain ischemia induces a gradual increase of miR-15a neurogenesis in the hippocampus (Fig. 2). We previously found that three repetitions of 2-min ischemia caused neuronal damage in selectively vulnerable hippocampal CA1 neurons, but exhibited a significant recovery after 7 days to 6 months (48). In the present study, miR-15a showed an increase up to 6 months after one dose of 2-min tCCAO, but the increase was much greater in the three-dose group (Fig. 2, filled squares). As was reported in cancer cells (11,35), miRNA-15 may promote neuronal survival by regulating neurogenesis and the apoptosis pathway in this tCCAO model.
Related to the miRNA pathway, TDP43 and FUS/TLS are associated with frontotemporal lobar degeneration (FTLD) and amyotrophic lateral sclerosis (33,38). Let-7b miRNA expression was downregulated following TDP43 knockdown in culture cells (10), and the expression of some miRNAs decreased or increased in TDP43 mutant flies (18). miR-24–1* was lower in a PGRN [+, (pro) granulin] FTLD TDP patient than in a PGRN (–) FTLD TDP patient (24). FUS affects the biogenesis of miRNAs for neuronal function, differentiation, and synaptogenesis with miR-125b and miR-132 (16,26,42). The present study showed that the expression of miR-24 and let-7b for TDP43 accelerated to an earlier period of reperfusion after three doses (Fig. 3B, D), but the expression of mmu-miR-125b-5p and mmu-miR-132–5p for FUS/TLS did not show any evident acceleration (Fig. 3A, C). We previously found that the redistribution of both TDP43 and FUS/TLS immunoreactivity to cytoplasm was accelerated to an earlier period of reperfusion after three doses of 2-min tCCAO from 3 months to 7 days or from 7 days to 1 day, respectively (48). Thus, the remarkable acceleration of TDP43 may be well correlated to the present expression data of miR-24 and let-7b for TDP43 (Fig. 3B, D).
HSP70 is a major stress protein, which is strongly induced under stresses including cerebral ischemia, heat, and metal toxicity (1,3,5). miR-181 was identified as a regulator of several HSP70 family members, and an increased level of miR-181a is associated with a decrease in endoplasmic reticulum GRP78 protein related to cerebral ischemic injury (41). Cardiac ischemic preconditioning of mice decreased HSP70 related to miR-378* microRNAs (49). Our previous immunohistochemical finding that HSP70 was induced only at 7 days after three doses of 2-min tCCAO is well correlated to our present data of mmu-miR-181c-5p and mmu-miR-378–5p, which accelerated at 1–7 days (48) (Fig. 4).
In summary, the present study shows the profiling of miRNAs for ischemic preconditioning after tCCAO in gerbil and identifies distinct regulation patterns for seven miRNA clusters. These data could provide new perspectives of miRNA expression proteins for neuroprotection, TDP43, FUS/TLS, and HSP70, not only in transient cerebral ischemia but also in ischemic preconditioning. These results may be useful for pursuing further studies on the possible use of miRNAs as biomarkers in cerebral ischemia and neuroregeneration.
Footnotes
Acknowledgments
This work was partly supported by a Grant-in-Aid for Scientific Research (B) 21390267, (C) 24591263, and Challenging Research 24659651, and Grants-in-Aid from the Research Committees (Mizusawa H, Nakano I, Nishizawa M, Sasaki H, and Aoki M) from the Ministry of Health, Labour and Welfare of Japan. The authors declare no conflicts of interest.