
Abstract
Although the feasibility of human bone marrow mesenchymal stem cell (hBMMSC)-based tissue-engineered bone (TEB) has been proven in a number of studies, reaching a high positive fraction and bone yield of TEB still remains a challenge. Here we report a dose–effect relationship of the quantity of seeded cells with in vivo bone yield and the required quantity of hBMMSCs for the effective, stable bone formation of TEB. In our study, TEB was constructed using the static seeding technique with the gradient of seeding densities and volumes of passage 3 hBMMSCs. The in vitro characteristics of seeding efficiency, proliferation, viability, distribution, and osteogenic differentiation of hBMMSCs seeded on two commercial scaffolds of β-TCP and CHA were investigated using alamarBlue assay, live/dead staining, confocal laser scanning microscope, scanning electronic microscopy examination, and mRNA expression analysis of osteogenic differentiation markers. After 3 months of ectopic implantation, in vivo bone regeneration was examined by quantitative analysis of histology and micro-CT. The results showed that 10 × 106 cells/ml was the minimum cell seeding density for CHA and β-TCP to generate new bone in vivo. In addition, 20 × 106 cells/ml and 30 × 106 cells/ml were the saturating seeding densities for CHA and β-TCP to produce new bone effectively and stably, respectively. Thus, for different scaffolds, the saturating seeding density should be investigated first to ensure the effectiveness and stability of TEB construction with minimum donor injury, which is essential for the clinical application of TEB.
Keywords
Introduction
Tissue-engineered bone (TEB) is considered a promising strategy to repair bone defects. A large number of animal studies and clinical trials have confirmed the feasibility of using bone marrow mesenchymal stem cell (BMMSC)-based TEB to repair different types of bone defects (3,11,15,20). However, it remains challenging to use bone tissue engineering to reach a stable, satisfactory bone formation, which has limited its clinical application of TEB. The quantity of seeded BMMSCs is recognized as one of the prominent factors that affect the success of constructing TEB. Although some studies have investigated the effects of cell seeding density or number of BMMSCs on TEB, most of these studies focused on the in vitro biology of the cell–scaffold constructs and did not apply it to in vivo quantitative analyses. Few studies were on human BMMSCs (2,5,10,23,24,29). Thus, in order to ensure the stability and effectiveness of bone repair using TEB, hBMMSC quantity on TEB, including both in vitro and in vivo quantitative analyses, needs to be elucidated.
Additional factors that affect TEB construction include cell passage (1,8,18), seeding techniques (9,12,16,21), and scaffolds (17,23). Studies of the effects of passaging on differentiation potential of hBMMSCs suggested that hBMMSCs at earlier passages were suitable for stem cell therapy (6, 28). Other studies (10,24) on optimal seeding density have demonstrated that the rank of cell seeding density should be approximately 106. Besides, static seeding is the most common delivery mode due to its simplicity and versatility across different types of cells and scaffolds and has been clinically proven to be an effective seeding approach for constructing TEB (15,20).
In the present study, TEB was constructed with the static seeding technique using passage 3 (P3) hBMMSCs with the gradient of seeding densities of 5 × 10⁶, 10 × 106, 20 × 106, 30 × 106, and 50 × 106 cells/ml. The in vitro characteristics of seeding efficiency, proliferation, viability, distribution, and osteogenic differentiation of hBMMSCs seeded on two commercial scaffolds, β-tricalcium phosphate (β-TCP) and coral-derived hydroxyapatite ceramic (CHA), were investigated using alamarBlue assay, live/dead staining, confocal laser scanning microscope (CLSM), scanning electronic microscopy (SEM) examination, and mRNA expression analysis of osteogenic differentiation markers. In vivo bone regeneration was examined by quantitative analysis of histology and micro-CT after 3 months of ectopic implantation. Here we demonstrated the dose–effect relationship between hBMMSC seeding quantity and bone yield in two different scaffolds. Also, we obtained two critical parameters of the minimum and saturating cell densities for TEB construction, which provided important information for the establishment of TEB clinical guidelines.
Materials and Methods
Isolation and Characterization of hBMMSCs
Human bone marrow aspirates were harvested from the iliac crest of patients who underwent alveolar cleft correction surgery (n = 4; 17–27 years old; male/female ratio = 3:1). This study was approved by the ethics committee of the plastic surgery hospital of the Chinese Academy of Medical Sciences and Peking Union Medical College (CAMS, PUMC), and informed consent from all of the patients was obtained. The primary hBMMSCs from each donor were isolated by density gradient centrifugation in Ficoll-Paque PLUS (density = 1.077 g/ml; Amersham Biosciences, Piscataway, NJ, USA) and kept as individual culture into 25-cm2 tissue dishes (Corning, Corning, NY, USA) in the medium, consisting of Dulbecco's modified Eagle medium (Hyclone, Logan, UT, USA) supplemented with 10% (v/v) fetal bovine serum (Gibco, Gaithersburg, MD, USA), 100 U/ml penicillin, and 0.1 mg/ml streptomycin, and then incubated at 37°C in a humidified atmosphere (95% air, 5% CO2), which were called P0 hBMMSCs. After 10–14 days of culturing, P0 hBMMSCs were at 80– 90% confluence. Then, cells were washed twice with pre-warmed phosphate-buffered saline (PBS; Hyclone) and detached enzymatically by TrypLETM Express (Gibco), and subcultured into 25-cm2 tissue culture dishes at a density of 5 × 10³ cells/cm2, which were defined as P1 cells. After 3–4 days of culturing, P1 hBMMSCs were at 80–90% confluence and subcultured again at a density of 5 × 10³ cells/cm2, which then was defined as P2. P3 hBMMSCs were obtained in the same way and used for the subsequent experiments in triplicate, and all experiments were repeated four times with different donors.
The surface markers of P3 hBMMSCs were analyzed by flow cytometry (BD Accuri C6; BD Biosciences, San Jose, CA, USA) with specific fluorescein isothiocyanate-conjugated or phycoerythrin-conjugated monoclonal antibodies, including CD34, CD45, CD117, CD71, CD29, CD73, CD90, and CD105 (20 μl antibody per 100 μl cell suspension; eBioscience, San Diego, CA, USA). The multilineage differentiation potentials of hBMMSCs into osteoblasts (4) and adipocytes (25) were also detected by Alizarin red S (Cyagen, Guangzhou, China) and Oil red O (Cyagen) staining as described previously.
Preparation and Characterization of Scaffolds
Two types of commercially available bone graft scaffolds were used: synthetic β-TCP (Bio-Lu Biomaterial Co., Ltd., Shanghai, China) and CHA (Beijing Yi-Hua-Jian Technology and Trade Co., Ltd., Beijing, China). The scaffolds were cut into cuboid shapes of 5 × 5 × 2 mm3 and steam sterilized after cleaning in ultrasonic baths. The morphologies and elemental composition analyses of two scaffolds were detected by SEM/energy dispersive spectrometer (SEM/EDS; Shimadzu SSX-550, Shimadzu Corporation, Kyoto, Japan). These scaffolds were air dried, gold sputter coated by multifunctional surface processor (SBC-2; Kyky, Beijing, China), and observed by SEM/EDS at an accelerating voltage of 10 kV and a spot size range of 55–65 nm.
Construction and Implantation of Cell–Scaffold Complex
Construction of Cell–Scaffold Complex
Before seeding cells, the sterilized scaffolds were washed by culture medium and soaked in it for 2 h in a culture dish (diameter = 35 mm; Corning) to be prewetted. Then the scaffolds were suck dried by negative-pressure equipment and placed into 48-well tissue culture plates with a flat bottom (Corning). The cell suspensions containing different cell densities or with different volumes were slowly dropped onto the surface of the prepared scaffolds (β-TCP and CHA) and were incubated for 30 min to allow cell attaching onto the scaffolds (37°C, 5% CO2, and 95% humidity). Then 1 ml osteogenic medium was slowly dropped along the well wall, and the complexes were cultured in an incubator (37°C, 5% CO2, and 95% humidity) for 1 or 2 weeks. Medium was changed every 2 days. This seeding procedure was performed by one technician to achieve reproducible cell loading.
Group Design
The seeding volumes of 0.5 μl, 2.5 μl, 5 μl, and 10 μl corresponded to 5%, 25%, 50%, and 100% of the internal scaffold volume. To investigate the effects of seeding density on the in vitro biology of hBMMSCs and in vivo bone yield of TEB, 10 μl of P3 hBMMSCs were seeded at five different concentrations of 5 × 10⁶, 10 × 106, 20 × 106, 30 × 106, and 50 × 106 cells/ml on β-TCP and CHA scaffolds, respectively. To further confirm the dose–effect relationship, P3 hBMMSCs were seeded on β-TCP scaffolds at two different concentrations of 10 × 106 and 20 × 106 cells/ml with four different volumes of 0.5 μl, 2.5 μl, 5 μl, and 10 μl, respectively.
Ectopic Implantation of Cell–Scaffold Complex in Nude Mice
All cell–scaffold constructs were osteogenically induced in vitro for 14 days. These constructs were then washed twice by PBS and implanted into nu/nu mice (6–8 weeks old, female). All mouse experiments were approved by the animal care committee of plastic surgery hospital of CAMS, PUMC. Operations were performed under anesthesia by 1% pentobarbital sodium (Ourchem, Sinopharm Chemical Reagent Co., Ltd., Shanghai, China) through intraperitoneal injection. The procedure began with a 1-cm incision of skin at the back of the neck. Blunt dissection was performed beneath the skin, and appropriate subcutaneous lacuna was made at the back. Each mouse received two constructs of different seeding densities in its back for 3 months. One construct was placed at the left rostral position, and the other one was placed at the right rostral position. After implantation, skin was sutured. The mice were sacrificed by decapitation 12 weeks after implantation (n = 8 per group).
In Vitro Analysis of Cell–Scaffold Constructs
Assessment of Seeding Efficiency and Cell Proliferation of hBMMSCs on Scaffolds
The cell seeding efficiency of TEB with different seeding densities was analyzed after 24 h of seeding using the alamarBlue cell metabolic reagent (Beijing CellChip Biotechnology Co., Beijing, China). Half of the cell–scaffold constructs were transferred to a new well, and the rest remained in their original wells. Ten percent (v/v) alamarBlue cell metabolic reagent was added into each well, followed by 8 h of incubation, and then the absorbance of samples was measured by a microplate reader (Ex/Em = 560 nm/585 nm; EnSpire; PerkinElmer, Boston, MA, USA). The absorbance read in the new wells represented the metabolic activity of the adherent cells on scaffolds. The seeding efficiency was calculated as the absorbance in new wells/ the absorbance in original wells × 100%. Cell proliferation with different seeding densities was analyzed at 3, 7, 10, and 14 days using the absorbance in new wells.
Evaluation of hBMMSC Viability on Scaffolds
The viability of hBMMSCs on scaffolds was detected using a live/dead staining kit (eBioscience) at day 7. Reagent A (1%, v/v) and reagent B (1%, v/v) were added into the basal regent to make a working solution. Cell–scaffold constructs were immersed in the working solution for 15 min at 37°C in a humidified atmosphere (95% air, 5% CO2) and visualized using CLSM (LSM710; Zeiss, Oberkochen, Germany).
Observation of hBMMSC Distribution and Matrix Deposition on Scaffolds
Cell morphology and distribution of hBMMSCs seeded on scaffolds were labeled with CM-DiI according to the manufacturer's protocol (Invitrogen, Carlsbad, CA, USA) and observed by CLSM at day 7. Cell growth and matrix deposition of hBMMSCs on scaffolds were examined by SEM at day 14. Each complex was fixed with 500 μl of 2.5% cool glutaraldehyde (SCRC; Sinopharm Chemical Reagent Co., Ltd.) for 30 min, air dried overnight, and then examined by SEM.
Analysis of Gene Expression of Cell–Scaffold Constructs
Constructs collected at day 14 in vitro were minced, and total RNA was extracted using the trizol reagent (Invitrogen). RNA was reverse transcribed into single-stranded cDNA according to the manufacturer's protocol (Promega, Madison, WI, USA). The mRNA expression levels of selected genes for alkaline phosphatase (ALP), runt-related transcription factor 2 (RUNX2), osteopontin (OPN), and osteocalcin (OCN) were analyzed by quantitative PCR using a LightCycler 480 system with a SYBR green kit (Roche Molecular Biochemicals, Mannheim, Germany). The forward and reverse primer pairs are shown in Table 1. To normalize mRNA levels, GAPDH, the housekeeping gene, was amplified and served as an internal control.
Primer Sequences Used for Real-Time PCR

In Vivo Evaluation of Bone Formation of Cell–Scaffold Constructs
Histological Analysis
At 3 months postimplantation, the cell–scaffold constructs were harvested and fixed in 10% neutral formalin (Yili Fine Chemicals Co., Ltd., Beijing, r China) for 7 days and then demineralized with 30% formic acid decalcifying solution (Yili Fine Chemicals) for 2 weeks. After decalcification, the specimens were dehydrated in ascending grades of ethanol, embedded in paraffin, sliced in 5-μm transverse sections and stained with hematoxylin and eosin (H&E; Yili Fine Chemicals) and Sirius red (Muto Pure Chemicals Co., Ltd., Tokyo, Japan). The Sirius red-stained sections were visualized under a polarization microscope (Zeiss) to evaluate the expression of collagen type I. The H&E-stained five serial sections of each specimen were observed under a light microscope (Leica DM3000; Leica Microsystems, Nussloch, Germany) to examine the new bone formation. For each section, five images, representing different areas, were randomly captured and analyzed using image analyzing software (ImageJ; National Institutes of Health, Bethesda, MD, USA). Newly formed bone was presented as a continuous red layer adjacent to the scaffold in H&E staining, while fibro tissue was stained pink and either centered in the pore or lay slightly eccentrically. The positive fraction for TEB was calculated as the number of TEB containing new bone/the total number of TEB implanted. Positively stained area of bone collagen structure within the captured images was segmented by the same designated universal color segment files and measured by routine function of the software (7).
Micro-CT Analysis
Formalin-fixed TEB implant samples and nonimplant blank scaffolds were scanned using a micro-CT system (SkyScan 1076 micro-CT; SkyScan, Kontich, Belgium) at a resolution of 9.4883 μm in the cross-direction of the TEB at 70 kV source voltage and 141 μA current and were used to obtain X-ray radiographs, ensuring that all TEB were encompassed. A Gaussian filter was used to suppress the noise. The scans were reconstructed using NRecon software (SkyScan) and were analyzed by CTAn software (SkyScan) to calculate bone volume fraction (BVF), bone mass fraction (BMF), and trabecular bone pattern factor (Tb.Pf) (19). A region of interest was first chosen by plotting the boundaries manually on the cross-sectional image for each example. The newly formed bone threshold ranges were established by the comparisons of these two groups on the threshold histogram, which is demonstrated by CTan software. The threshold ranges of newly formed bone at TCP and coral scaffold were almost both located from 70 to 120 gray scale indexes.
Statistical Analysis
Cell seeding efficiency, cell proliferation, gene expression, and bone area calculation, as well as the data obtained from micro-CT, were analyzed using a one-way ANOVA and Scheffe post hoc tests with SPSS Statistics 17.0 software (IBM, Armonk, NY, USA). Data were presented as mean ± SEM, and a value of p < 0.05 was considered statistically significant.
Results
Characterization of hBMMSCs and Scaffolds
After osteogenic induction for 2 weeks, P3 hBMMSCs showed extracellular matrix mineralization and calcified nodule formation, which was detected by Alizarin red S staining (Fig. 1A). Adipogenic differentiation of P3 hBMMSCs was revealed by intracellular lipid droplet accumulation using Oil red O staining (Fig. 1B). The P3 hBMMSCs were uniformly positive for CD73, CD90, CD105, and negative for CD34, CD45, and CD71 (Fig. 1C).
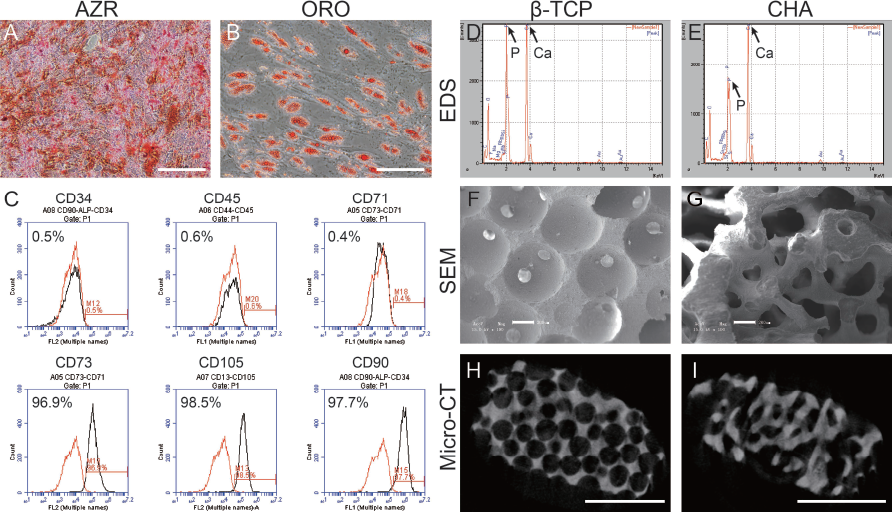
Characterization of human bone marrow mesenchymal stem cells (hBMMSCs) and scaffolds. (A) Alizarin red (AZR). (B) Oil red O. (C) Surface marker of MSCs. (D, E) Energy dispersive spectrometer evaluation of blank scaffolds. (F, G) Scanning electron microscope (SEM) evaluation of blank scaffolds. (H, I) Cross-section from micro-CT. Scale bar: 100 μm (B), 200 μm (A, F, G), and 2 mm (H, I).
EDS showed that the Ca/P ratios of β-TCP and CHA were 1.745 and 2.668, respectively (Fig. 1D, E). Synthesized β-TCP showed regularly round pores after foaming, with a volume porosity of 75 ± 10%, a pore size of 500 ± 150 μm, and a connective pore size of 150 ± 50 μm, whereas the CHA maintained the nature structure of coral after calcinations, displaying highly porous with fully interconnected pore (porosity: 30-70%, average pore size: 200-700 μm) (Fig. 1F-I).
In Vitro Culture of hBMMSCs/β-TCP Constructs
Seeding Efficiency, Proliferation, Viability, and Distribution of hBMMSCs on β-TCP
Seeding efficiency and hBMMSC proliferation were evaluated by the alamarBlue assay, which examines the oxygen metabolic activity of cells to reflect the number of living cells. The results of cell seeding efficiency showed that 76-89% of hBMMSCs adhered onto the β-TCP scaffold after 24 h, but there were no significant differences among the five groups (Fig. 2A). Proliferation of hBMMSCs in all groups increased, and the 5 × 10⁶ cells/ml group showed the significantly lowest metabolic activity compared to the other groups (Fig. 2B).

Cell seeding efficiency, proliferation, viability, and distribution of hBMMSCs seeded on β-TCP scaffold with different seeding density. (A) Seeding efficiency of hBMMSCs seeded on β-TCP scaffold after 24 h. (B) alamarBlue assay showing proliferation of hBMMSCs seeded on β-TCP scaffold. (C1–G1) Live/dead fluorescent staining of hBMMSCs seeded on β-TCP scaffold after 7 days in culture. (C2–G2) CM-DiI-labeled hBMMSCs seeded on β-TCP scaffold after 7 days in culture. Scale bar: 200 μm (C1–G1, C2–G2). *p < 0.05.
Viability and distribution of hBMMSCs on β-TCP were observed by CLSM using live/dead staining and CM-DiI labeling. The amount of living cells labeled by green fluorescence gradually increased with increasing cell seeding density (Fig. 2C1-G1), and hBMMSC CM-Dil labeling was evident in all groups except in the 5 × 10⁶ cells/ml group (Fig. 2C2-G2).
Matrix Deposition and Osteogenic Differentiation of hBMMSCs on β-TCP
The matrix deposition and osteogenic differentiation of hBMMSCs seeded on the β-TCP were evaluated by SEM, and mRNA expression analysis at day 14 of osteogenic-related genes was carried out using real-time PCR. The hBMMSCs were found covering the whole scaffold with abundant extracellular matrix in all groups, except in the 5 × 10⁶ cells/ml group (Fig. 3A-E). There was no statistical differences in the mRNA expression levels of ALP, RUNX2, OPN, or OCN across the five groups, which indicated the osteogenic differentiation of hBMMSCs was similar in all groups before implantation, regardless of cell densities within a certain rank of cell number around 105 (Fig. 3F).

Matrix deposition and osteogenic differentiation of hBMMSCs seeded on β-TCP scaffold with different seeding density. (A–E) SEM showing matrix deposition at day 14 of hBMMSCs seeded on β-TCP scaffold. (F) Gene expression at day 14 of RUNX2, ALP, OPN, OCN evaluated by real-time PCR. Scale bar: 200 μm (A–E).
Ectopic Bone Formation of hBMMSCs/ β-TCP Constructs
Histological Analysis of Ectopic Bone Formation of TEB Constructed by β-TCP and hBMMSCs With Different Cell Seeding Densities
H&E staining showed that new bone tissue formed in all groups except in the 5 × 10⁶ cells/ml group (Fig. 4A1–E1). Osteoblasts grew on the outer surfaces of newly formed bone tissue, and osteocytes were embedded in lacunae in the mineralized bone matrix. The type I collagen deposition detected by Sirius red staining showed a similar pattern as H&E staining (Fig. 4A2–E2). The positive fractions for ectopic bone formation were 5/7, 7/8, 6/8, and 6/8 in the 10, 20, 30, and 50 × 106 cells/ml groups, respectively, but 0/8 in the 5 × 10⁶ cells/ml group (Fig. 4F). Quantitative analysis of bone yield showed that bone area in the 10 and 20 × 106 cells/ml groups was significantly less than that in the 30 and 50 × 106 cells/ml groups. No significant differences were found between the 10 and 20 × 106 cells/ml groups or between the 30 and 50 × 106 cells/ml groups (Fig. 4G).
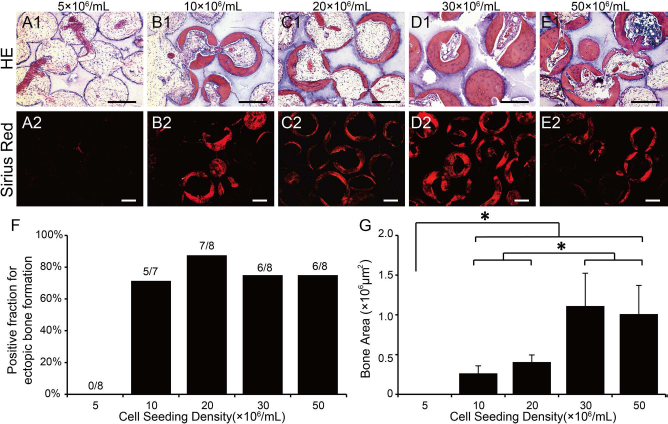
Histological analysis of ectopic bone formation in tissue-engineered bone (TEB) constructed by β-TCP and hBMMSCs with different seeding density after 12 weeks implantation. (A1–E1) H&E staining. (A2–E2) Sirius red at polarized light. (F) Positive fraction of ectopic bone formation determined by H&E staining analysis. (G) Bone area of ectopic bone formation determined by quantitative image analysis of H&E staining. Scale bar: 200 μm (A1–E1, A2–E2). *p < 0.05.
Micro-CT Analysis of Ectopic Bone Formation of TEB Constructed by β-TCP and hBMMSCs with Different Cell Seeding Densities
Micro-CT is a volumetric measuring technique used to quantitatively analyze bone yield. After defining the threshold, the micro-CT scanning slices differed in the zone of new bone (red) from that of undegraded β-TCP scaffold (green; Fig. 5A–E).

Micro-CT analysis of ectopic bone formation in TEB constructed by β-TCP and hBMMSCs with different seeding density after 12 weeks implantation. (A–E) Cross-sections with bidesignated threshold of micro-CT scan. (F–H) Quantifications of bone volume fraction (BVF), bone mass fraction (BMF), and trabecular bone pattern factor (Tb.Pf) in TEB. Scale bar: 2 mm (A–E). *p < 0.05.
BVF is a normalized index, defined as the ratio of bone volume (BV) to total volume (TV), which indicates the proportion of mineralized bone volume in a given volume. The values of BVF increased with hBMMSC seeding density, and a significant difference was found between the 5 × 10⁶ cells/ml group and the other four groups. Moreover, the values of BVF in the 10 and 20 × 106 cells/ ml groups were significantly lower than that in the 30 and 50 × 106 cells/ml groups; there were no significant differences found between the 10 and 20 × 106 cells/ml groups, or between the 30 and 50 × 106 cells/ml groups (Fig. 5F). Similar to the BVF, BMF is the ratio of tissue mineral content (TMC, BV plus tissue mineral density) to bone mineral content (BMC, TV plus bone mineral density), which indicates the fraction of mineralized bone mass in a given mass. The results of BMF in different groups were consistent with that of BVF (Fig. 5G).
Tb.Pf reflects the microstructure of convexity and concavity in bone tissue, which is defined as the positive (trabecular bone in osteoporosis) and negative values (mature lamellar bone), respectively. Results showed that the negative values of Tb.Pf increased with cell seeding densities, indicating that more trabecular bone formed with increasing seeding density in different groups. Statistical analysis showed similar results as BVF and BMF (Fig. 5H).
Histological Analysis of Ectopic Bone Formation of TEB Constructed by β-TCP and hBMMSCs with Different Cell Seeding Volumes
To confirm the minimum seeding quantity of hBMMSCs on β-TCP, the hBMMSCs/β-TCP constructs with cell densities of 10 and 20 × 106 cells/ml and different seeding volumes of 0.5, 2.5, 5, and 10 μl (saturating medium volume for 5 × 5 × 2 mm3) were subjected to H&E staining after 3 months of implantation.
The results showed that, at both 10 and 20 × 106 cells/ ml, bone formation increased with different seeding volumes (Fig. 6A1–D1 and A2–D2). Only one in eight constructs formed new bone in the 5 μl group at 10 × 106 cells/ ml, as well as in 2.5 μl group at 20 × 106 cells/ml. However, new bone tissue was observed in more than 50% of constructs in the 10-μl group at 10 × 106 cells/ml (5/8), and in the 5-μl (5/8) and 10-μl groups (5/7) at 20 × 106 cells/ml (Fig. 6E, F). The results indicated that 1 × 10⁵ cells were a minimum number for hBMMSCs to seed on this certain sized β-TCP to generate new bone in TEB constructs.
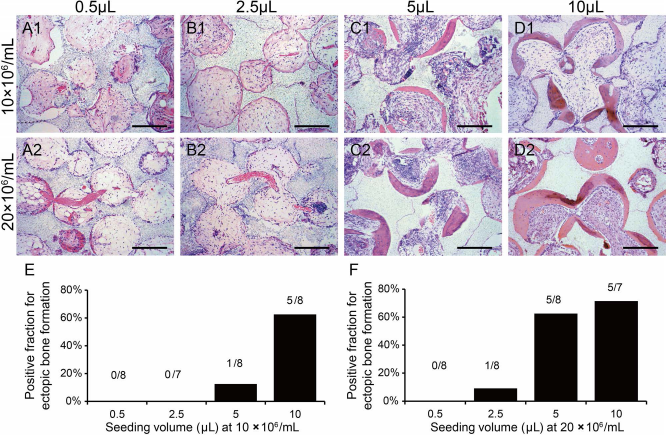
Histological analysis of ectopic bone formation in TEB constructed by β-TCP and hBMMSCs with different seeding volume at different seeding densities after 12 weeks implantation. (A1–D1, A2–D2) H&E staining. (E) Positive fraction of ectopic bone formation in TEB with different seeding volume at 10 × 106 cells/ml. (F) Positive fraction of ectopic bone formation in TEB with different seeding volume at 20 × 106 cells/ml. Scale bar: 200 μm (A1–D1, A2–D2).
Osteogenesis of hBMMSCs/CHA Constructs
To confirm the consistency of the dose–effect relationship between cell seeding quantity and in vivo bone yield, we employed another scaffold of CHA to construct TEB.
In Vitro Characterization of hBMMSCs/CHA Constructs
Results showed that cell viability, distribution, matrix deposition, and osteogenic differentiation of hBMMSCs on CHA were similar to the previous study of β-TCP (data not shown). However, the cell seeding efficiency in the 50 × 106 cells/ml group of hBMMSC/CHA constructs was significantly lower than the other four groups after 24 h, and there was a significant difference in proliferation between the group of 10 × 106 cells/ml and the groups of 20, 30, and 50 × 106 cells/ml after 14 days in culture (Fig. 7A, B).
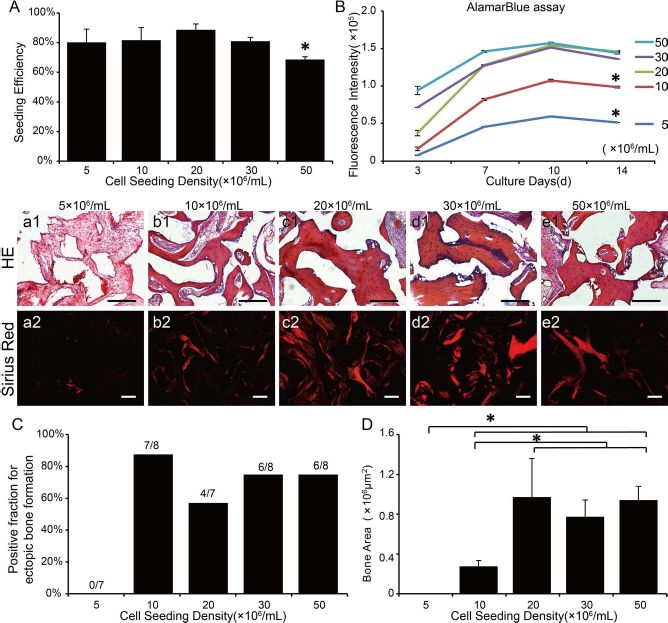
In vitro cell seeding efficiency, proliferation, and histological analysis of in vivo ectopic bone formation of hBMMSCs seeded on CHA scaffold with different seeding density. (A) Seeding efficiency of hBMMSCs seeded on CHA scaffold after 24 h. (B) alamarBlue assay showing proliferation of hBMMSCs seeded on CHA scaffold. (a1–e1) H&E staining. (a2–e2) Sirius red at polarized light. (C) Positive fraction of ectopic bone formation in TEB. (D) Bone area of ectopic bone formation determined by quantitative image analysis of H&E staining. Scale bar: 200 μm (a1–e1, a2–e2). *p < 0.05.
Ectopic Bone Formation of hBMMSCs/CHA Constructs
H&E and Sirius red staining showed similar results to that of the previous study in β-TCP (Fig. 7a1–e1 and a2–e2). Quantitative analysis showed that, under saturating seeding volume, the positive fraction for ectopic bone formation was more than 50% in CHA-based TEB when the seeding density was equal to or more than 10 × 106 cells/ml (Fig. 7C), indicating that 10 × 106 cells/ml was the minimum seeding density of hBMMSCs to generate new bone on CHA as the same as β-TCP. The statistical analysis of the bone area in H&E staining revealed that the bone area in 10 × 106 cells/ml group was significantly less than that in the 20, 30, and 50 × 106 cells/ml groups, and there were no significant differences among the 20, 30, and 50 × 106 cells/ml groups (Fig. 7D). In addition, the results across the BVF, BMF, and Tb.Pf of different groups were consistent with that in the bone area of H&E analysis (Fig. 8).

Micro-CT analysis of ectopic bone formation in TEB constructed by CHA and hBMMSCs with different seeding density after 12 weeks implantation. (A–E) Cross-sections with bidesignated threshold of micro-CT scan. (F–H) Quantifications of BVF, BMF, and Tb.Pf in TEB. Scale bar: 2 μ. *p < 0.05.
Discussion
In the present study, we investigated the dose–effect relationship between cell seeding quantity and the in vivo bone yield on β-TCP and CHA scaffolds. We demonstrated that, using saturating seeding volume, in vivo bone formation of TEB constructs could be achieved when seeding hBMMSCs at a minimum seeding density, while the effectiveness and stability was improved when seeding at a saturating seeding density, which seeding strategy we called the economic application principle. Some investigators have proven that there is a certain amount of hBMMSCs required for in vivo bone formation of TEB (10,13). Seeding hBMMSCs with a density higher than the saturating seeding density is wasteful for patients. The economic application of hBMMSCs in TEB is fundamentally required for clinical use to ensure the effectiveness and stability of TEB-based therapy.
In our study, on β-TCP or CHA, no bone tissue was observed after 3 months transplantation in vivo when seeding hBMMSCs at 5 × 10⁶ cells/ml; however, when the seeding density increased to 10 × 106 cells/ml with the saturating seeding volume, the fraction positive for ectopic new bone formation in TEB could reach 62.5%. Besides, only half of the saturating seeding volume was enough to ensure the feasibility of in vivo bone formation in TEB constructing when increasing the seeding density up to 20 × 106 cells/ml. Thus, we demonstrated that 1 × 10⁵ cells (10 μl saturating seeding volume at 10 × 106 cells/ml or half of saturating seeding volume at 20 × 106 cells/ml) were the minimum cell seeding quantity needed to achieve bone formation on both β-TCP and CHA scaffolds with a size of 5 × 5 × 2 mm3. These findings showed that there was a minimum seeding amount of hBMMSCs to generate new bone for a certain sized scaffold (although the bone yield was not sufficient after 3 months).
Some studies have described the optimal seeding density for TEB construction in vitro, but lacked further in vivo analysis of hBMMSC-based TEB (2,5,29). Our study found that, for β-TCP or CHA, there was a different saturating seeding density in TEB construction, below which the in vivo bone yield increased with cell seeding density and above which the bone yield did not continue to increase. On β-TCP, the 10 and 20 × 106 cells/ml groups were significantly lower across the parameters of bone area, BVF, BMF, and Tb.Pf compared to the 30 and 50 × 106 cells/ml groups, and there were no significant differences between the 30 × 106 cells/ml and 50 × 106 cells/ml groups, which suggests that 30 × 106 cells/ml was the saturating seeding density suitable for β-TCP to form a qualified bone tissue. However, on CHA, the 10 × 106 cells/ml group was significantly lower in the bone-forming related parameters compared to the groups of 20, 30, and 50 × 106 cells/ml, in which the three groups had no significant differences; thus, 20 × 106 cells/ml was considered the saturating seeding density for CHA. We also found that the bone yields of β-TCP-based TEB were significantly higher than CHA-based TEB, which were consistent with another study (14). The higher saturating seeding density and a superior bone formation of β-TCP might be due to more structured pores and a better osteoinductive potential of β-TCP than CHA. This study first demonstrates that there is a distinct saturating seeding density for different scaffolds. The saturating seeding density is an essential factor to guide the clinical use of hBMMSCs, by which the effectiveness and stability of TEB construction can improve and the minimized aspirates of bone marrow can be estimated.
To our knowledge, this is the first report to compare the effects of cell seeding density on both the in vitro biological characteristics of hBMMSCs and on in vivo bone yield. The in vivo results of micro-CT in hBMMSC/ CHA-based TEB was consistent with the in vitro proliferation phenotype, as the groups of 20, 30, and 50 × 106 cells/ml were significantly higher than the 10 × 106 cells/ ml group in both of cell proliferation in vitro and the bone yield in vivo. For hBMMSC/β-TCP constructs, there was no significant difference in cell proliferation in vitro among the 10, 20, 30, and 50 × 106 cells/ml groups, but the in vivo bone yields in 30 and 50 × 106 cells/ml groups were significantly higher than that in 10 and 20 × 106 cells/ml groups. This inconsistency might be due to the limitation of nutrition and waste transportation caused by the smaller connective pore size in β-TCP, especially in higher cell density under in vitro culture condition (22,26,27). Nutrition supply was improved along with the in vivo vascularization, which resulted in the recovery of bone yield in 30 and 50 × 106 cells/ml groups after implantation. This indicates that the minimum seeding density could be determined in vitro; nevertheless, the saturating seeding density would be found out by in vivo study. We already know that different types of scaffolds have a distinct saturating seeding density, but whether the smaller size of scaffold has its predictive power after scale-up needs to be investigated by further studies using different sizes of scaffolds for TEB construction.
Conclusions
We constructed TEB with the gradients of seeding densities and seeding volumes of P3 hBMMSCs on two commercial scaffolds β-TCP and CHA using static seeding technique. We demonstrated a dose–effect relationship between cell seeding quantity and in vivo bone yield, in which a minimum seeding density for the feasibility of bone formation and a saturating seeding density for the effectiveness and stability of TEB construction were found. For different types of scaffolds, the saturating seeding density must be determined, which is very important for the clinical application of TEB.
Footnotes
Acknowledgments
This work was supported by Beijing Municipal Science & Technology Project (D090800046609003), Ministry of Health Clinical Disciplines Key Project, National Natural Science Foundation of China (30871433, 31071305). The authors declare no conflicts of interest.