
Abstract
Primary central nervous system (CNS) atypical teratoid/rhabdoid tumor (ATRT) is an extremely malignant pediatric brain tumor observed in infancy and childhood. It has been reported that a subpopulation of CD133+ cells isolated from ATRT tumors present with cancer stem-like and radioresistant properties. However, the exact biomolecular mechanisms of ATRT or CD133-positive ATRT (ATRT-CD133+) cells are still unclear. We have previously shown that ATRT-CD133+ cells have pluripotent differentiation ability and the capability of malignant cells to be highly resistant to ionizing radiation (IR). By using microRNA array and quantitative RT-PCR in this study, we showed that expression of miR142-3p was lower in ATRT-CD133+ cells than in ATRT-CD133- cells. miR142-3p overexpression significantly inhibited the self-renewal and tumorigenicity of ATRT-CD133+ cells. On the contrary, silencing of endogenous miR142-3p dramatically increased the tumor-initiating and stem-like cell capacities in ATRT cells or ATRT-CD133- cells and further promoted the mesenchymal transitional and radioresistant properties of ATRT cells. Most importantly, therapeutic delivery of miR142-3p in ATRT cells effectively reduced its lethality by blocking tumor growth, repressing invasiveness, increasing radiosensitivity, and prolonging survival time in orthotropic-transplanted immunocompromised mice. These results demonstrate the prospect of developing novel miRNA-based strategies to block the stem-like and radioresistant properties of malignant pediatric brain cancer stem cells.
Keywords
Introduction
Atypical teratoid/rhabdoid tumor (ATRT), primary to the central nervous system, is an extremely malignant tumor that preferentially occurs in patients under 3 years of age and is often fatal within 1 year after diagnosis (5,28,30). Histologically, ATRT is not morphologically homogenous and contains a unique combination of cells including rhabdoid cells, neuroepithelial, peripheral epithelial, and mesenchymal elements (5,20,40). Patients with ATRT have a poor outcome despite surgical and radiochemotherapy and are easily misclassified as primitive neuroectodermal tumor/medulloblastoma due to the histological similarity of the two tumors in magnetic resonance imaging (MRI) and computerized tomography (CT) scans (3,5,30). To improve patient survival, the mechanisms of ATRT's tumorigenesis need to be elucidated.
Some studies have suggested that subsets of cancer stem cells (CSCs) are key contributors to radioresistance and are responsible for tumor progression as well as recurrence after conventional therapies (1). Cluster of differentiation 133 (CD133) was identified as a marker representing a subset population of cancer stem-like cells in several types of cancers (2,4,8,31,39,41). The fraction of CD133-expressing cells was demonstrated to be enriched after radiation in gliomas (1). These CD133-expressing CSCs play a critical role not only in the restoration of a tumor but also in their resistance to radiotherapy (1,4). We previously showed that CD133+ ATRT cells present pluripotent differentiation ability and are highly resistant to ionizing radiation and that the percentage of CD133+ cells in the relapsed tumor is significantly higher than in the original tumor (9).
MicroRNAs (miRNAs)—noncoding small RNA molecules that regulate gene expression—can contribute to the pathogenesis of human malignancies depending on their downstream targets (11). MicroRNAs were reported to be involved in many aspects of brain tumor progression, including glioma malignant progression. Several miRNAs, such as miR10b and miR26a, appear to be prognostic markers in high-grade glioma (22,32), while others, like miR125b, miR326, and miR324-5p, appear to be signature miRNAs in cerebellar neuronal progenitors and tumors and predict prognosis and patient outcomes (16). miRNA-221/222 appear to target cyclin-dependent kinase inhibitor 1B (p27kip1), a cell cycle repressor, and are implicated in the promotion of brain tumor progression (19). Adenovirus-mediated delivery of short hairpin (shRNA) against miR221/222 was shown to suppress glioblastoma progression and, therefore, are implicated as therapeutic targets (42). In ATRT, upregulation of miR221/222 was found in comparison to normal tissue, and suppression of this miRNA is suggested to be an alternative therapy for ATRT (35). However, how a miRNA can mediate ATRT malignancy or regulate tumor initiation and stemness of ATRT is still unclear.
miR142 was found to modulate hematopoietic lineage differentiation including T-cell development in 2004 (7). miR142-3p expression was negatively regulated by the transcriptional regulators, LIM domain only 2 (LMO2), LIM domain binding 1 (LDB1), guanine–adenine–thymine–adenine-binding protein 1 (GATA1), and T-cell acute lymphocytic leukemia 1/transcription factor 3 (TAL1/E47) (45). In addition, miR-142 and miR-223 attenuated the proliferation of hematopoietic cells through a miR-223—cytosine–cytosine–adenine–adenine–thymine (CCAAT)/enhancer-binding protein-β (CEBP-β)—LMO2—miR-142 regulatory pathway (36). In mouse lung, miR142-3p was found upregulated in bronchioalveolar stem cells; aberrant miR142 expression might be involved in converting bronchioalveolar stem cells into lung cancer stem cells (29). In this study, we have isolated cancer stem-like cells from ATRT patient specimens by identifying CD133-expressing cells and comparing their miRNA expression profiles with non-stem-like ATRT cells to identify potential miRNAs that are involved in the regulation of cancer initiation of ATRT. We found that miR142-3p is a negative regulator for stemness properties in ATRT and further identified its downstream targets that regulate cancer stemness and radioresistance. These results might support the development of novel miRNA-based treatment strategies for malignant pediatric brain tumors.
Materials and Methods
Enrichment of Cancer Stem-Like Cells and Isolation of CD133+ Cells
All procedures of tissue acquirements are following the tents of the Declaration of Helsinki and are approved by Institutional Review Committee at Taipei Veterans General Hospital. Between January 1998 and April 2011, a total of 32 patients with ATRT and 114 with medulloblastoma (MB) were treated at our hospital. We had seven samples from ATRT patients. There were five males and two females with a median age of 4.4 years (0.5 months–15 years). We took 25 samples from MB patients. The genders of these patients were 15 male and 10 female with a median age of 9.04 years (4 years–17 years). In brief, after surgical removal of the ATRT tissues, the tissues were washed three times in glucose containing Hanks' balanced salted solution, (HBSS; Invitrogen/Life Technologies, Carlsbad, CA, USA) and then the samples were sliced at a thickness of 300 mm and immersed in 0.1% (w/w) collagenase (Sevapharma, Prague, Czech Republic) in glucose containing HBSS for 15 min at 37°C and shaken on a rotation shaker at 125 rpm. The collagenase-digested cells were centrifuged at 100 × g for 10 min, and the cells were resuspended in cancer stem cell-enriching medium: Dulbecco's modified Eagle's medium (DMEM)/F12 (Gibco, Gaithersburg, MD, USA) supplemented with N2 supplement (R&D, Minneapolis, MN, USA), 10 ng/ml human recombinant basic fibroblast growth factor (bFGF; R&D Systems), and 10 ng/ml epidermal growth factor (EGF; Invitrogen/Life Technologies). CD133+ cells were isolated as follows: dissociated cells from tumor samples of ATRT patients were labeled with 1 ml CD133/L micromagnetic beads/106 cells using a CD133 cell isolation kit (magnetic activated cell sorting; MACS®, Miltenyi Biotec, Auburn, CA, USA). CD133+ cells were cultured in serum-free cancer stem cell-enriching medium prepared as described previously (9,26,27). The role of miRNAs in ATRT malignancy was elucidated by comparing miRNA expression profiles between MB and ATRT cells. Briefly, samples of the medulloblastoma were first obtained to allow full neuropathologic evaluation and diagnosis, as required for the clinical management of the patient's disease. The site of origin of all the tumor samples was cerebellum. The sterile dissection of tumor biopsy was dissociated and plated in six-well tissue culture plates (Corning, Inc., Corning, NY, USA) and expanded in DMEM/F12 supplemented with 1% N-2 supplement (Invitrogen/Life Technologies), 5% fetal bovine serum (FBS; HyClone, Logan, UT, USA), 20 ng/ml recombinant human EGF, and 10 ng/ml recombinant human bFGF (BD Biosciences, San Jose, CA, USA). MB cells were subsequently maintained in DMEM supplemented with 10% FBS and utilized at low passage number (below passage 20 for all studies).
Microarray Analysis and Bioinformatics
Total RNA was extracted from cells using Trizol reagent (Life Technologies) and the Qiagen RNAeasy (Qiagen, Valencia, CA, USA) column for purification. Total RNA was reverse-transcribed with Superscript II RNase H-reverse transcriptase (Gibco) to generate cyanine 3 (Cy3)- and Cy5-labeled (Amersham Biosciences Co., Piscataway, NJ, USA) cDNA probes for the control and treated samples, respectively. The labeled probes were hybridized to a cDNA microarray containing 10,000 gene clone immobilized cDNA fragments. Fluorescence intensities of Cy3 and Cy5 targets were measured and scanned separately using a GenePix 4000B Array Scanner (Axon Instruments, Burlingame, CA, USA). Data analysis was performed using GenePix Pro 3.0.5.56 (Axon Instruments) and GeneSpring GX 7.3.1 software (Agilent, Palo Alto, CA, USA). The average linkage distance was used to assess the similarity between two groups of gene expression profiles as described below. The difference in distance between two groups of sample expression profiles to a third was assessed by comparing the corresponding average linkage distances (the mean of all pairwise distances (linkages) between members of the two groups concerned). The error of such a comparison was estimated by combining the standard errors (the standard deviation of pairwise linkages divided by the square root of the number of linkages) of the average linkage distances involved. Classical multidimensional scaling (MDS) was performed using the standard function of the R program (www.r-project.org) to provide a visual impression of how the various sample groups are related.
Maintenance of Human Embryonic Stem Cells (ESCs) and Mesenchymal Stem Cells (MSCs)
We compared the transcriptome signature of human ATRT cells receiving the indicated treatment with human embryonic stem cell TW1 lines (13) and mesenchymal stem cells, which were cultured and maintained as below.
The procedures involving the use of human ESCs and MSCs follow the tenets of the Declaration of Helsinki and were approved by the Institutional Review Committee at Taipei Veterans General Hospital.
The human ESCs (female, TW1 cell line; p22) were obtained from Biomedical Technology and Device Research Laboratories, Industrial Technology Research Institute and initially cultured on mouse embryonic fibroblasts (MEFs), as directed by the supplier (FIRDI, Taiwan, http://www.firdi.org.tw/). MEFs (p3) after mitomycin-C deactivation were used as feeder cells for culturing the human ESCs. They were plated at a density of 200,000 cells per 9.4-cm2 well in six-well plates. The human ESC culture medium comprised 80% (v/v) knockout (KO) DMEM, 20% (v/v) KO serum replacement, 2 mM l-glutamine, 10 mM nonessential amino acids (all from Invitrogen), 50 μM β-mercaptoethanol (Sigma-Aldrich, St Louis, MO, USA), and 4 ng/ml basic fibroblast growth factor (bFGF).
Bone marrow (BM) was obtained from five healthy adult donors following informed consent (ages 17–63; three males and two females), and the extraction and culture of MSCs was conducted as previously described (10).
Radiation Treatment for Cell Survival Analysis
γ Radiation (ionizing radiation; IR) was delivered by Theratronic cobalt unit T-1000 (Theratronic International, Inc., Ottawa, ON, Canada) at a dose rate of 1.1 Gy/min [source to skin distance (SSD)=57.5 cm]. Cells in the control and IR groups were exposed to different dosages (0, 2, 4, 6, 8, and 10 Gy). After a 10-day incubation, colonies (>50 cells per colony) were fixed with 4% paraformaldehyde (Sigma-Aldrich) for 15 min at room temperature and stained for 20 min with a crystal violet and methanol solution (Sigma-Aldrich). Cell survival was determined with a colony formation assay. Plating efficiency (PE) and survival fraction were calculated as PE = (colony number/inoculating cell number) × 100%; SF = colonies counted/[cells seeded × (PE/100)].
Tumor Sphere-Forming Assay
Tumor cells were dissociated and cultured as tumor spheres in modified DMEM/F-12 supplemented with N2 (R&D), 10 ng/ml EGF (Invitrogen/Life Technologies), 10 ng/ml bFGF (Invitrogen/Life Technologies), and penicillin/streptomycin (P/S; Invitrogen/Life Technologies) at 2 × 10⁶ live cells/75 cm2 flask (Corning, Inc.). Tumor sphere numbers were scored after 14 days.
In Vitro Soft Agar Assay
A 24-well plate Transwell® system with a polycarbonate filter membrane (8-μm pore size; Corning, Ewloe, Flintshire, UK) was used. Cell suspensions were seeded in the chamber's upper compartment, with 1 × 10⁵ cells in 100 μl serum-free medium. The opposite surface of the filter membrane, facing the lower chamber, was stained with Hoechst 33342 (Invitrogen) for 3 min, and migrating cells were visualized under an inverted microscope (IX51, Olympus, Tokyo, Japan). For the soft agar assay, the bottom of each well (35 mm) of a six-well culture dish (Corning, Inc.) was coated with a 2-ml agar mixture [DMEM, 10% (v/v) FBS (Invitrogen), 0.6% (w/v) agar (Lonza, Rockland, ME, USA)]. After the bottom layer solidified, a 2-ml top agar–medium mixture [DMEM, 10% (v/v) FBS, 0.3% (w/v) agar] containing 2 × 10⁴ cells was added and incubated at 37°C for 4 weeks. The plates were stained with 0.5 ml 0.005% crystal violet, and the number of colonies was counted using a dissecting microscope.
In Vitro Cell Invasion Analysis
The 24-well plate Transwell® system with a polycarbonate filter membrane of 8-μm pore size (Corning) was employed to evaluate the invasion ability of cells. The membrane was coated with Matrigel™ (BD Pharmingen, San Diego, CA, USA). The cancer cell suspensions were seeded to the upper compartment of the Transwell chamber at the cell density of 1 × 10⁵ in 100 μl within serum-free medium. The lower chamber was filled with serum-free medium or media with 10% serum. After 24 h of incubation, the medium was removed, and the filter membrane was fixed with 4% formalin (Sigma-Aldrich) for 1 h. Subsequently, the remaining cells of the filter membrane facing the lower chamber were stained with Hoechst 33258 (Sigma-Aldrich). The migrated cancer cells were then visualized and counted from five different visual areas of 100-fold magnification under an inverted microscope.
Quantitative RT-PCR
Total RNA was prepared from cells or tissues using Trizol reagent according to the manufacturer's protocol (Invitrogen). Quantitative (q)RT-PCRs of mRNAs were reverse transcribed using the Superscript III first-strand synthesis system for RT-PCR (Invitrogen). Quantitative RT-PCR reactions on resulting cDNAs were performed on an ABI 7900HT (Applied Biosystems, Foster City, CA, USA), and glyceraldehyde 3-phosphate dehydrogenase (GADPH) expression levels were used as an internal control for data normalization. qRT-PCR was performed with specific primer sets (Table 1). The TaqMan miRNA assay for miR-142-3p (Assay ID: 000464, Applied Biosystems) was also used with the RNU6b (Assay ID: 001093, Applied Biosystems) expression levels being used as an internal control for data normalization.
The Sequences of the Primers for Quantitative RT-PCR

bp, base pairs; ADCY9, adenylate cyclase 9; GFAP, glial fibrillary acidic protein; sox2, sex-determining region Y Box 2; YKL40, tyrosine–lysine–leucine 40 kDA [also known as chitinase 3-like 1 (CHI3L1)]; GAPDH, glyceraldehyde 3-phosphate dehydrogenase.
Prediction of MicroRNA Target Sites and Analysis of MicroRNA Profile
MicroRNA targeting sites were predicted by the online open database, Targetscan (http://www.targetscan.org/). MicroRNA profile analysis was performed by using the open database, NCI60 Cancer Microarray Project (http://genome-www.stanford.edu/nci60/).
Plasmid Constructions and Establishment of Stable Cell Lines
miR-142-3p sponge, scramble, and antisense microRNAs were constructed using a pcDNA 6.2-GW/EmGFP-miR plasmid (Invitrogen) with the following primer sequences: sponge forward 5′-GATCCTCCA TAAAGTACTTACACTAC AAGATCTGGCCGCAC-3′, sponge reverse 5′-TCGAGTGCGGCCAGATCT TGTA GTGT AAGTACTTTATGGAG-3′, whereas scramble control sequences are scramble forward 5′-GATCCCA TTAATGTCGGACAACTCAATCAGATC TGGCCG CAC-3′, scramble reverse 5′-TCGAGTGCGGCCAGA TCTGATT GAGTTGTCCGACACATTAATGG-3′. Antisense forward and reverse sequences are 5′-TGCTGTCC ATAAAGTAGGAAACACTACAGTTTTGGCCAC TGACTGAC-TGTAGTGTCCTACTTTATGGA-3′ and 5′-CCTGTCCATAAAGTAGGACACTACAGTCA GTCAGTGGCCAAAACTGTAGTGTTTCCTACTTT ATGGAC-3′, respectively. MicroRNA sponge sequence design was based on a previous publication (14). Further multiple copy amplifications were done with recovery of BamH1 and XhoI digested fragments and subcloned into pcDNA 6.2-GW/EmGFP-miR plasmid. All constructed expression vectors were sequenced and verified. Transfected cells were cultured in the presence of blasticidin (Sigma-Aldrich)-containing culture medium (DMEM, 10% FBS, penicillin and streptomycin). For adenylate cyclase 9 (ADCY9) and sex-determining region Y box 2 (Sox2) 3′untranslated region (UTR) reporter plasmids, various ADCY9 and Sox2 3′UTR regions were amplified by PCR with high-fidelity DNA polymerase (Takara Bio, Shiga, Japan) from extracted human DNAs with the following primer pairs: Sox2 3′UTR, SOX2-WT-F 5′-ATGCACGCGTGGGCCGG ACAGCGAACTGGAGGGG G-3′, SOX2-D1 5′-ATG CAAGCTTACAATAAATTTACAGAAATATTACA-3, SOX2-D4 5′-ATGCAAGCTTATACAAGGTCCATTCC CCCGCCCTC-3, SOX2-D5 5′-ATGCAAGCTTTTCTTT TTGAGCGTACCGGGTTTTC-3′, SOX2-WT-R 5′-GGA AGCTTTTTCAGTGTCCATATTTCAAAAATT-3, ADCY9 3′UTR, ADCY9-WT-F 5′-ATGCACTAGTGG CGGCGCCCACCCGCTGCCCGAGG-3′, ADCY9-D1 5′-ATCGTTTAAACTGGCTGTTTAGGAAGGCTC AGGG-3′, ADCY9-D2 5′-ATGCG TTTAAACCAAC TCCGACCGGACAACTCGGG-3, ADCY9-D3 5′-ATG CGTTTA AACACACAAAAGAGACATCTGGTTAC-3′, ADCY9-D4 5′-ATGCGTTTAAAC TGCGCATGTGTG CTTACATAGAG-3′, ADCY9-WT-R 5′-ATGCGTTTAA ACTT TTTTTTATATAAATTTTAGAATA-3′. The amplified DNA fragments were subcloned into pMIR-REPORT plasmids (Applied Biosystems), which contain firefly luciferase, green fluorescent protein, and the miRNA target-cloning region. For mut-ADCY9 and mut-Sox2 3′UTR reporter plasmid construction, point mutations were induced into mut-ADCY9 and mut-Sox2 3′UTR region by mutagenesis primers: ADCY9 5′-TTTTTTTT CCTTAAAACAAAGTCCC-3′ and 5′-GGGACTTTGT TTT AAGGAA AAAAAA-3 Sox2 5′-AATCTCCTCCT TATACCCGGGAAAT-3′ and 5′-ATTTCCCGGGTATA AGGAGGAGATT-3′. All plasmid sequences were validated by sequencing.
Short Hairpin RNA Expression Construct and Lentiviral Transduction
Stable ablation of Sox2 and AC9 in ATRT cells was obtained using shRNA probes for the human gene Sox2 and AC9. Control cells stably expressed short hairpin luciferase (shLuc; pLKO.1-shLuc). Cells were infected with a shRNA lentiviral vector generated using a three-plasmid-based lentiviral system [all plasmids are available from the RNAi Consortium (TRC, Broad Institute, Cambridge, MA, USA)]. Lentivirus production was performed by transfecting 293 T-cells (ATCC, Manassas, VA, USA) at 5 × 10⁶ cells per 10-cm plate using Lipofectamine 2000 (LF2000, Invitrogen). Supernatants were collected 48 h after transfection and then were filtered. Subconfluent cells were infected with lentiviral vector in the presence of 8 mg/ml polybrene (Sigma-Aldrich). Infected cells were selected with puromycin (2 mg/ml; Sigma-Aldrich) until control uninfected cells were completely dead.
Luciferase Reporter Assay
ATRT cells were grown in six-well tissue culture dishes to 30% confluence. One day before transfection, culture media were replaced with fresh culture media, and cells were then cotransfected with firefly luciferase expression vectors (pGL3; Promega) (20 ng/well), as indicated in the results along with the internal control vector for renilla luciferase (pRL; Promega) (2 ng/well). The transfection procedures were performed using the liposome-mediated transfection method with Lipofectamine 2000 (Invitrogen/Life Technologies) as a transfection reagent at a final concentration of 0.38 ml/ml. Forty-eight hours after transfection, the cells were washed twice with phosphate-buffered saline (Invitrogen/Life Technologies) and were lysed, and cell lysates were collected in microcentrifugation tubes (Eppendorf, New York, NY, USA). Cell extracts were subjected to firefly and Renilla luciferase activities detection using a dual luciferase assay (Promega). Luminance signals were detected by luminance recorder (Sirius single tube luminometer; Berthold Detection Systems, GmbH, Pforzhein, Germany). Relative expression levels were measured with the firefly luciferase activities normalized to Renilla luciferase activities.
Flow Cytometry
Cells were stained with anti-CD133 antibody conjugated to phycoerythrin (Miltenyi Biotech) with labeling according to the manufacturer's instructions. Red (>650 nm) fluorescence emission from 10,000 cells illuminated with blue (488 nm) excitation light was measured with a FACSCalibur (Becton Dickinson, Franklin Lakes, NJ, USA) using CellQuest software. In cell-sorting experiments, cells were labeled and sorted using FACSAria (BD Biosciences, San Jose, CA, USA).
MTT Assay
For evaluation of cell survival, cells were seeded on 24-well plates (Corning, Inc.) at a density of 2 × 10⁴ cells/well, followed by the addition of methyl thiazol tetrazolium (MTT; Sigma-Aldrich) at the end of cell culture. The amount of MTT formazan product was determined using a microplate reader at an absorbance of 560 nm (SpectraMax 250; Molecular Devices, Sunnyvale, CA, USA).
Immunoblotting Assay
Cell protein extraction and immunoblotting analysis were performed as previously described (26). Fifteen microliters of sample was boiled at 95°C for 5 min and separated by 10% sodium dodecyl sulfate-polyacrylamide gel electrophoresis (SDS-PAGE; Sigma-Aldrich). The proteins were transferred to Hybond-ECL nitrocellulose paper or polyvinylidene difluoride (PVDF) membrane (Amersham, Arlington Heights, IL, USA) by wet transfer. Primary antibodies ADCY9 (ab14783, Abcam, Inc., Cambridge, MA, USA), β-actin (mAB1501, Millipore, Inc., Billerica, MA, USA), CD133 (#3663, Cell Signaling Technology, Inc., Danvers, MA, USA), fibronectin (AB1954, Millipore, Inc.), GAPDH (Ab9385, Abcam, Inc.), SOX2 (#2748, Cell Signaling Technology, Inc.), and vimentin (#3390, Cell Signaling Technology, Inc.) were added as indicated in Table 2. Reactive protein bands were detected by the ECL detection system (Amersham, GE Healthcare BioSciences, Piscataway, NJ, USA).
List of Proteins Tested by Antibodies

CD133, cluster of differentiation 133; WB, Western blot; mmab, mouse monoclonal antibody; rpab, rabbit polyclonal antibody.
In Vivo Orthotopic ATRT-Transplanted Nude Mice
All procedures involving animals were in accordance with the institutional animal welfare guidelines and approved animal protocol of the Taipei Veterans General Hospital. Female BALB/c nude mice, 6–8 weeks of age, were obtained from the National Laboratory Animal Center (Taipei, Taiwan). Nude mice were subcutaneously (SC) or intracranially (IC) injected with a total of 2 × 10⁵ cells of ATRT, ATRT/CD133+/pLV, or ATRT/CD133+/pLVmiR142-3p in 20 ml PBS. For SC, the mouse was anesthetized with ketamine/xylazine (Sigma-Aldrich) and then was implanted SC in the lower left flank with 2 × 10⁵ ATRT, ATRT/CD133+/pLV or ATRT/CD133+/pLVmiR142-3p cells per mouse. For IC injection, the skulls of the mice were immobilized in a stereotaxic apparatus and a ~1.5-mm hole was created in the cranium by rotating fine handheld tweezers in a circular motion; 2 × 10⁵ tumor cells were then slowly transplanted into the left striatum of nude mice using a Hamilton syringe (Reno, NV, USA).
3T-MRI
Tumor size was measured at weekly intervals using a 3T-MR imaging Biospect system (Bruker, Ettlingen, Germany) with a miniquadrature coil for radiofrequency transmission and reception of 3T-MR imaging signals. The volume was calculated [(length × width2)/2] and then analyzed using Image-Pro Plus software (Media Cybernetics, Rockville, MD, USA).
Statistical Analysis
Results are reported as mean ± SD. Statistical analysis was performed using Student's t test or a one-way or two-way analysis of variance (ANOVA) followed by Tukey's test. Results were considered statistically significant at p < 0.05.
Results
miR142-3p Expression Is Significantly Different Between ATRT and Medulloblastoma
ATRT bears a very dismal prognosis with a rapid evolution and relapse within the first year even with complete resection followed by adjuvant chemoradiation. We sought to elucidate the role of miRNAs in ATRT malignancy by comparing miRNA expression profiles between medulloblastoma (MB) and ATRT in four independent cell lines and found 22 miRNAs diversely expressed (up or down) between MB and ATRT cell lines (Fig. 1A). To further validate the microarray data, we collected 25 MB and seven ATRT patient specimens and analyzed the expression levels of these 22 miRNAs by quantitative RT-PCR (data not shown); miR142-3p demonstrated the most significant difference between MB and ATRT specimens (Fig. 1B). We further searched the NCI60 tumor database (a data set of gene expression and miRNA profiles of 60 National Cancer Institute cell lines) and screened for targets whose expression levels were negatively correlated with that of miR142-3p. The result showed that Sox2 (a transcriptional factor generally expressed in embryonic stem cells as well as CSCs of several types of tumor) and ADCY9 (AC9, a membrane-bound adenylate cyclase highly expressed in brain) have an opposite expression pattern to miR142-3p. Sox2 and AC9 were highly expressed in the brain tumor cell lines in the NCI60 database, whereas miR142-3p expression was relatively low, compared to other cell lines in the database (Fig. 1C). Quantitative RT-PCR analysis of Sox2 and AC9 mRNA levels in the 25 MB and seven ATRT patient specimens indicated that the two potential miR142-3p targets were indeed preferentially expressed in the ATRT tissues (Fig. 1D), while miR142-3p expression was more highly expressed in the MB tissues (Fig. 1B). A statistical analysis of the mRNA expression of miR142-3p, Sox2, and AC9 in the seven pairs of ATRT and MB specimens revealed a strong negative correlation between miR142-3p and the two potential targets (Fig. 1E). Collectively, these data indicate that miR142-3p expression is inversely correlated with the aggressive behavior of ATRT and the mRNA levels of Sox2 and AC9.

mir142-3p expression is correlated with Sox2, AC9, and ATRT CD133+ cells. (A) Microarray analysis (gene tree) of the 22 microRNAs that were differentially expressed in four medulloblastoma (M1–M4) and four atypical teratoid/rhabdoid tumor (ATRT; A1–A4) cell lines as demonstrated by the hierarchy heat map. The changes in the expression of the 22 genes are presented as a log scale of the expression values. (B) Quantitative miR142-3p expression levels in 25 medulloblastoma (MB) and seven ATRT cells were assessed by qRT-PCR. (C) Microarray analysis from the NCI60 database of tumor cells was performed, and the negative correlation between sex-determining region Y box 2 (Sox2), adenylate cyclase 9 (AC9; ACDY9), and miR142-3p was identified. miR142-3p expression was low in brain tumor cell lines, whereas Sox2 and AC9 expressions were high. (D) Analysis of Sox2 and AC9 expression levels in MB and ATRT by qRT-PCR (*p < 0.05). (E) The protein levels of Sox2 and AC9 were correlated with the expression level of miR142-3p in seven pairs of cluster of differentiation 133 positive (CD133+) and CD133- ATRT cells. Statistical analysis revealed an inverse correlation of miR142-3p expression with the expression of Sox2, AC9, and CD133.
miR142-3p Is Downregulated in the Cancer Stem-Like Subsets Isolated From ATRTs
Recent reports suggest that malignant pediatric brain tumors, including ATRTs, possess CSC-like properties and present characteristics of aggressive tumor. It has been reported that bFGF and EGF enrich the subpopulation of normal neural stem cells from the hippocampal region of rodent brain (38) and cancer stem cells (CSCs) derived from brain tumors (17). To investigate the involvement of miR142-3p in the CSC-like properties of ATRT cells, we enriched the sphere-forming ATRT cells in a serum-free bFGF/EGF culture system. Quantitative RT-PCR analysis showed that the miR142-3p expression level was lower in sphere-forming ATRT than in ATRT cultured in ordinary serum-containing medium (Fig. 2A).

miR142-3p is downregulated in ATRT and is related to stemness capacity. (A) Sphere-forming (SB) ATRT cell lines were generated by culturing parental ATRT cell in serum-free neurobasal media supplemented with fibroblast growth factor/epidermal growth factor (FGF/EGF). The expression level of miR142-3p was analyzed by qRT-PCR and compared between SB-ATRT and parental ATRT, which were cultured in Dulbecco's modified Eagle's medium (DMEM) containing 10% fetal bovine serum (FBS) (right). A representative microscopic image of the spheroids from two independent ATRT cell lines (ATRT1 and ATRT2) is shown on the left. (B) The CD133+ and CD133- ATRT cells were isolated by flow cytometry sorting. The endogenous expression of miR142-3p was detected by qRT-PCR. The quantitative result of miR142-3p levels in CD133+ and CD133- ATRT cells is shown on the right. (C) Side populations (SP) of ATRT cells were separated and isolated by cell sorter (left). The expression level of miR142-3p was analyzed by qRT-PCR and compared between SP+- and SP--ATRT cells (right; *p < 0.05).
Moreover, the subpopulation of CD133+ lineage or side population-positive (SP+) subsets has been considered as the candidate markers of cancer stem cells in brain tumors (2,12,15,21,31,41,43). Our previous studies also demonstrated that CD133+ ATRT cells not only preserve the cancer stem-like properties but also have a pluripotent differentiation ability (9). We then isolated CD133+ and SP+ CSC-like ATRT cells from ATRT cell lines (Fig. 2B, C, left). Similar to ATRT tumor sphere, isolated ATRT-CD133+ (Fig. 2B) and ATRT-SP+ (Fig. 2C) cells exhibited low levels of miR142-3p, supporting the notion that miR142-3p expression is inhibited in ATRT-CSCs.
ATRT-CD133+ Cells Represent High Tumorigenic and Radioresistant Properties
CD133 (prominin-1: PROM1), a five-transmembrane glycoprotein, has been identified as a CSC-like marker in pediatric brain tumors, including ATRT (9). Based on these studies as well as our finding that miR142-3p is low in ATRT-CD133+ but high in ATRT-CD133- cells, we further explored the relationship between miR142-3p and the cancer stemness properties of ATRT. We first validated the CSC-like properties of the isolated ATRT-CD133+ cells by comparing ATRT-CD133+ with ATRT/CD133- in terms of their proliferation, self-renewal, clonogenesis, motility, and radioresistance. We showed that ATRT-CD133+ cells had a higher proliferation rate than ATRT-CD133- cells, as assessed by the MTT assay (p < 0.05) (Fig. 3A). The self-renewing and clonogenic abilities of ATRT-CD133+ cells were elevated in comparison to ATRT-CD133- cells, as the number of sphere (Fig. 3B) and soft agar colonies (Fig. 3C) of ATRT-CD133+ cells was higher. ATRT-CD133+ cells also presented better migration (Fig. 3D) and invasion (Fig. 3E) ability and were more resistant to radiation treatment (Fig. 3F). More importantly, in our in vivo tumor-initiating assay, we demonstrated that ATRT-CD133+ had better tumor-initiating potential than ATRT-CD133- cells. Around 100 to 500 ATRT-CD133+ cells are able to form tumor nodules in immunocompromised mice, while ATRT-CD133- needed more cells (at least 10,000) to generate in vivo tumors (Table 3). These data indicated that ATRT-CD133+ cells present several characteristics of CSC-like properties in comparison to ATRT-CD133- cells.

CD133+ ATRT cells present characteristics of CSC-like properties. (A) Proliferation analysis by MTT assay with CD133+ and CD133- ATRT cells. (B) CD133+ and CD133- ATRT cells were subjected to a sphere formation assay. The average number of spheres in each visual field was quantified and presented in the chart. (C–E) CD133+ and CD133- ATRT cells were subjected to soft agar colony formation (C), Transwell migration (D), and invasion (E) assays. (F) CD133+ and CD133- ATRT cells were treated with radiation (up to 10 Gy) and subjected to MTT assay to assess cell viability. Data shown here are the mean ± SD of three independent experiments.
miR142-3p Downregulation Increased the Tumor-Initiating Activity of ATRT In Vivo
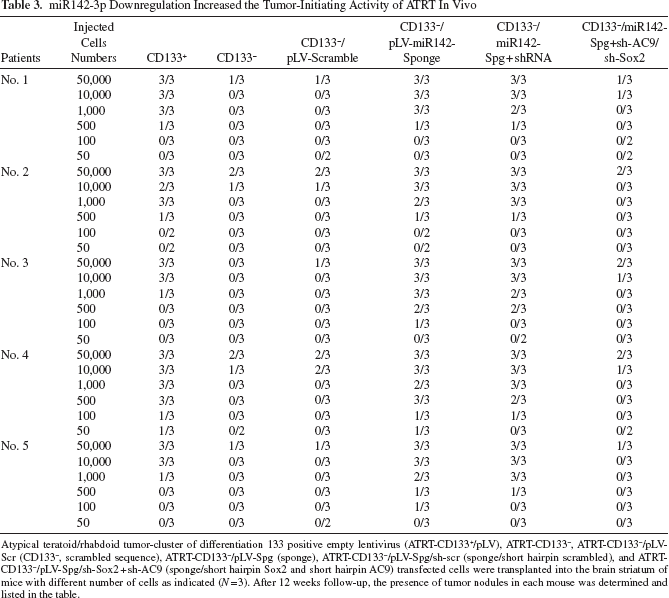
Atypical teratoid/rhabdoid tumor-cluster of differentiation 133 positive empty lentivirus (ATRT-CD133+/pLV), ATRT-CD133-, ATRT-CD133-/pLV-Scr (CD133-, scrambled sequence), ATRT-CD133-/pLV-Spg (sponge), ATRT-CD133-/pLV-Spg/sh-scr (sponge/short hairpin scrambled), and ATRT-CD133-/pLV-Spg/sh-Sox2 + sh-AC9 (sponge/short hairpin Sox2 and short hairpin AC9) transfected cells were transplanted into the brain striatum of mice with different number of cells as indicated (N = 3). After 12 weeks follow-up, the presence of tumor nodules in each mouse was determined and listed in the table.
miR142-3p Directly Targets the 3′UTR Regions of Sox2 and AC9 in ATRT-CD133+ Cells
The inverse correlation between miR142-3p and Sox2/AC9 (Fig. 1C–E) prompted us to investigate whether miR142-3p directly regulates Sox2 and AC9. We constructed luciferase reporter plasmids containing wild-type (WT) or serial deleted forms (D1–D5) of the 3′UTR regions of Sox2 and AC9 (Fig. 4A, B, right; Fig. 4C). The luciferase reporter assay was performed by cotransfecting the reporter plasmids with or without miR142-3p in the cultured ATRT-CD133+ cells (Fig. 4A, B, left). The results showed that miR142-3p suppressed the luciferase activities of Sox2-3′UTR-WT, AC9-3′UTR-WT, and AC9-3′UTR-D1, but not the others (Fig. 4A, B). It indicates that the nonoverlapping sequences between Sox2-3′UTR-WT and Sox2-3′UTR-WD1, as well as between AC9-3′UTR-D1 and AC9-3′UTR-D2, may be important for miR142-3p-mediated suppression, though a miR142-3p targeting sequence was not identified in both 3′UTR sequences by the Targetscan prediction program (www.targetscan.org). According to this result, we aligned the miR142-3p sequence with the likely region of each 3′UTR, and predicted the miR142-3p targeting region in Sox2 and AC9 (Fig. 4E). We then constructed luciferase reporter plasmids containing WT or mutated miR142-3p targeting regions (Fig. 4D, E). The reporter assay showed that miR142-3p inhibited the luciferase activity of the WT targeting site but not the mutated site (Fig. 4D), implying that the miR142-3p-mediated inhibition of Sox2 and AC9 is dependent on the identified sequences. To confirm the miR142-3p-dependent inhibition of Sox2 and AC9, miR142-3p antisense and SPONGE constructs, competitive inhibitors of miRNAs consisting of transcripts containing multiple, tandem binding sites to a miRNA of interest (14), were cotransfected with WT or mutated 3′UTR reporters in recurrent ATRT cells; the inhibition effects were no longer observed with miR142-3p antisense and SPONGE (data not shown). Taken together, these data support that Sox2 and AC9 are direct inhibitory targets of miR142-3p in ATRT-CD133+ cells.

miR-142-3p directly targets Sox2 and AC9 3′UTRs regions in ATRT cells. (A, B) The wild-type (WT) and serial deleted (D1–D5) forms of the 3′untranslated region (UTR) reporter plasmids were constructed as shown in the schematic presentation in the right panels. Luciferase activity of these 3′UTR was analyzed with or without miR142-3p (left panels). (C) Schematic presentation of the constructed 3′UTR reporter plasmids. (D) The effects of miR142-3p on WT or mutated (MT) Sox2 and AC9 3′UTR were assessed by the luciferase activity. Only the WT 3′UTRs were inhibited by miR142-3p. Data shown here are the mean ± SD of three independent experiments. (*p < 0.05). (E) The putative miR142-3p target sites in Sox2 and AC9 3′UTR are shown. The designed mutated nucleotides are underlined.
Overexpression of miR142-3p Inhibited Tumorigenic and Migratory/Invasive Abilities in ATRT-CD133+ Cells
To examine the role of miR142-3p in regulating the aggressive property of ATRT, miR142-3p was overexpressed by lentivirus infection in 2 ATRT-CD133+ cell lines (ATRT-CD133+/pLV-miR142-3p). An empty vectortransfected control (ATRT-CD133+/pLV) was also generated simultaneously. The ectopic miR142-3p expression and the endogenous Sox2 and AC9 protein levels of these cell lines were validated by Western blot (Fig. 5A).
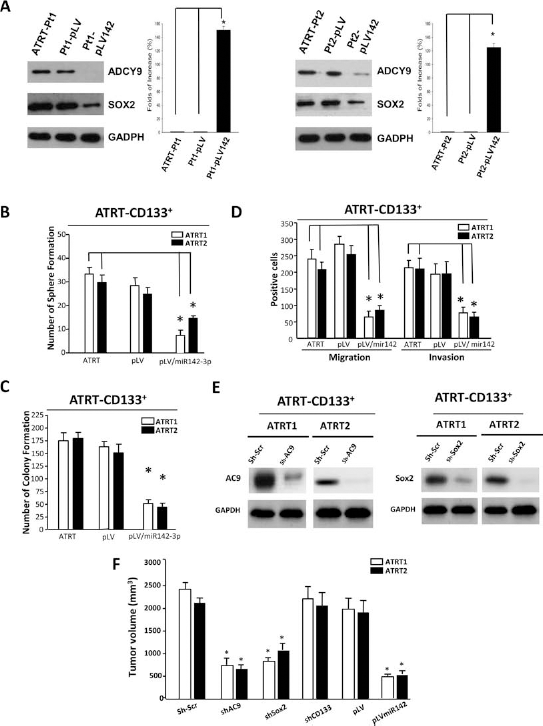
miR142-3p attenuated the self-renewal and tumorigenicity of ATRT cells. (A) miR142-3p-overexpressing ATRT cell lines (pLV-miR142-3p) were generated from two ATRT-CD133+ cell lines (ATRT1 and ATRT2). Empty vector-transfected controls (pLV) were also generated simultaneously. The expressions of miR142-3p, Sox2, and AC9 were validated by Western blot (A). (B–D) The established cell lines were subjected to sphere formation (B), soft agar colony formation (C), and migration and invasion (D) assays. Ectopic miR142-3p suppressed these cell properties in ATRT-CD133+ cells. (E) AC9 and Sox2 were, respectively, knocked down (sh-AC9, and sh-Sox2, respectively) in ATRT-CD133+ cells using short hairpin RNA (shRNA) lentivirus plasmids containing luciferase and green fluorescent protein (GFP) expression sequence. Scrambled control shRNA (sh-Scr) was used to generate control cell lines. The knockdown efficiency was assessed by Western blot. (F) Nude mice were transplanted with ATRT-CD133+/sh-Scr (scrambled), ATRT-CD133+/shSox2, ATRT-CD133+/shAC9, ATRT-CD133+/pLV (empty vector), or ATRT-CD133+/pLV-miR142-3p cells. The tumor size was assessed by 3T-MRI. The results showed that in vivo tumorigenicity of ATRT-CD133+ cells was significantly suppressed by overexpressed miR142-3p and shRNA-mediated silencing of Sox2 or AC9 (right, each group, N = 6, *p < 0.05).
Functional analysis on these cell lines showed that both ATRT-CD133+/pLV-miR142-3p cell lines had reduced sphere formation ability (Fig. 5B), less soft agar colony number (Fig. 5C), and inhibited migration and invasion capacity (Fig. 5D), compared with their ATRT-CD133+/pLV control and parental ATRT-CD133+ cells.
We further investigated the involvement of the two miR142-3p targets, Sox2 and AC9, in the regulation of ATRT tumorigenesis. Using the shRNA-mediated gene silencing method, we specifically knocked down Sox2 and AC9 in ATRT-CD133+ cells (Fig. 5E) and subjected them to in vivo tumor formation assay. Similar to ATRT-CD133+/pLV-miR142-3p cells, ATRT-CD133+/sh-Sox2 and ATRT-CD133+/sh-AC9 cells produced a smaller tumor volume in immunocompromised mice in comparison to their controls (Fig. 5F). In vitro functional analysis showed ATRT-CD133+/sh-Sox2 and ATRT-CD133+/sh-AC9 cells presented inhibited sphere formation (Fig. 6A), anchorage-independent clonogenic growth (Fig. 6B), migration (Fig. 6C), and invasion (Fig. 6D).

miR142-3p and Sox2/AC9 mediated ATRT-CD133+ tumorigenicity. (A–D) ATRT-CD133+/sh-Scr, ATRT-CD133+/shSox2, and ATRT-CD133+/shAC9 cell lines were subjected to sphere formation (A), soft agar colony formation (B), migration (C), and invasion (D) assays. (E) Stable cell lines with double knockdown or coexpression of Sox2 and AC9 were generated in previously established ATRT-CD133+/pLV-miR142 cells. The expression or knockdown efficiency of Sox2 and AC9 was validated by Western blot. (F) Nude mice were transplanted with ATRT-CD133+/pLV, ATRT-CD133+/pLV-miR142, ATRT-CD133+/pLV-miR142/sh-Scr, ATRT-CD133+/pLV-miR142/shSOX2+shAC9, ATRT-CD133+/pLV-miR142/vector, and ATRT-CD133+/pLV-miR142/Sox2+AC9, respectively. The tumor size was assessed by 3T-MRI (each group, N = 6, *p < 0.05).
To determine if Sox2 and AC9 mediate the miR142-3p-dependent suppressive effect, we coknocked down or cooverexpressed Sox2 and AC9 in the previously established ATRT-CD133+/pLV-miR142-3p cells (Fig. 6E, middle and right) and subjected these cells to a xenograft tumor model. As expected, Sox2/AC9 double knockdown had little effect in tumor growth, as Sox2 and AC9 expression was already low ATRT-CD133+/pLV-miR142-3p cells (Fig. 6F). However, co-knockdown of Sox2 and AC9 elevated the miR142-3p-suppressed tumor volume to a level close to the ATRT-CD133+/pLV control cells (Fig. 6F). We conclude that miR142-3p- and Sox2/AC9-mediated ATRT-CD133+ tumorigenicity are concurrent events and that miR142-3p overexpression reduced the tumor aggressive characters in ATRT partially, if not totally, through inhibition of Sox2 and AC9.
The Expression Level of miR142-3p Determined the Cancer Stem-Like and Tumor-Initiating Capabilities in ATRT Cells
To further support the role of miR142-3p in ATRT CSC-like properties, we knocked down endogenous miR142-3p in ATRT-CD133- cells using the miRNA sponge strategy and subjected the cells to in vitro functional assays as well as bioinformatics analysis. The miR142-3p-knocked down cells (ATRT-CD133-/Spg) expressed elevated protein levels of Sox2 and AC9 (Fig. 7A) and increased colony formation and sphere-formation abilities (Fig. 7B). We also examined the successful sphere formation over serial passages of culture, a key behavior for evaluating the persistent self-renewal property of CSCs and showed that the self-renewal capacity of ATRT-CD133-/Spg cells is conserved for several passages of culture (Fig. 7C). Moreover, migratory and invasive abilities were also significantly greater in ATRT-CD133-/Spg than in ATRT-CD133- or ATRT-CD133-/Scr cells (p < 0.05) (Fig. 7D). In addition, bioinformatics analysis on transcriptome signature suggested that ATRT-CD133-/Spg expressed a gene pattern relatively close to human ESCs and ATRT-CD133+ rather than ATRT-CD133-, while the gene expression pattern of ATRT-CD133+/pLV-miR142-3p is closer to ATRT-CD133- than its parental ATRT-CD133+ cells (Fig. 7E). Moreover, multidimensional scaling (MDS) analysis demonstrated that suppression of miR142-3p in ATRT-CD133- cells promoted a signature shift toward that of ESCs (Fig. 7F, G).
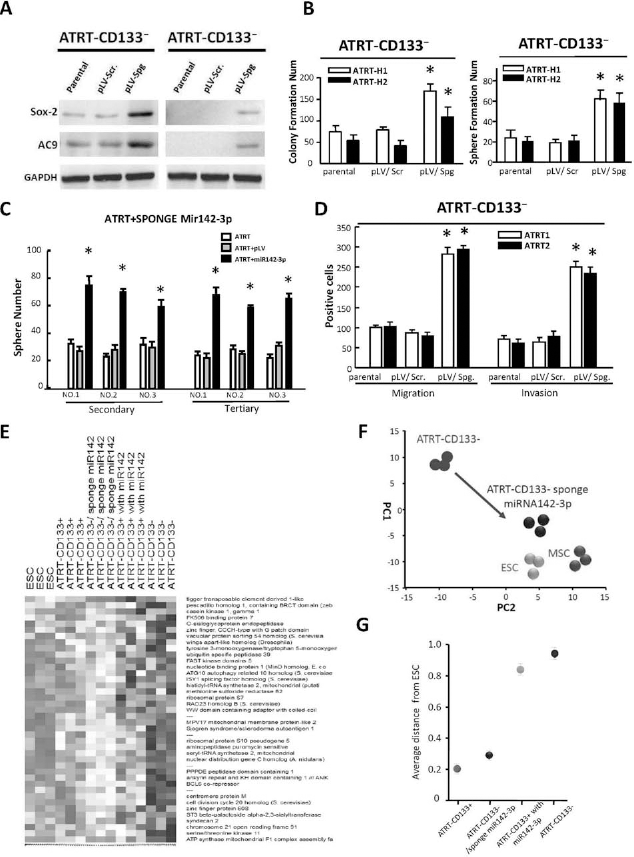
miR142-3p sponge restored the stemness and tumor-initiating ability in ATRT cells. (A) miR142-3p was knocked down in ATRT-CD133- cells by stably transfecting miR142-3p sponge (pLV-Spg) in two ATRT-CD133- cell lines. Scrambled sponge control transfected cell lines were generated simultaneously (pLV-Scr). The elevated endogenous Sox2 and AC9 in ATRT-CD133-/pLV-Spg and ATRT-CD133-/pLV-Scr were assessed by Western blot. (B) ATRT-CD133-/pLV-Spg, ATRT-CD133-/pLV-Scr, and parental ATRT cells were subjected to soft agar colony formation (left) and sphere formation (right) assays. ATRT-CD133-/pLV-Spg cells had increased sphere formation and colony formation ability (*p < 0.05). (C) Silencing of endogenous miR142-3p enhanced spheroid formation and self-renewal ability of ATRT-CD133- cells over several passages of culture. (D) The established cell lines were subjected to Transwell migration and invasion assays (*p < 0.05). (E, F) Microarray and bioinformatics analysis on the transcriptome signature of human embryonic stem cell (ESC) H9 line, human mesenchymal stem cell (MSC), ATRT-CD133-/pLV-Scr, and ATRT-CD133-/pLV-Spg cells indicated that sponge-mediated silencing of endogenous miR142-3p in ATRT-CD133- significantly promoted a shift of transcriptome expression signature toward that of ESCs and MSCs. (G) Multidimensional scaling analysis illustrated the average lineage transcriptome distances between ESCs and ATRT-CD133-, ATRT-CD133-/pLV-Spg, ATRT CD133+, or ATRT-CD133+/pLV-miR142 cells.
A similar phenomenon was also observed when comparing the gene expression signature of these stable cell lines with human MSCs. The gene expression pattern of ATRT-CD133-/Spg was close to ATRT-CD133+ and MSCs and divert from its parental ATRT-CD133- cells (Fig. 8A). The identified pathways that were upregulated (Fig. 8A, top right) and downregulated (Fig. 8A, bottom right) in ATRT-CD133- and ATRT-CD133+/pLV-miR142 cells, compared with the other three cells (in triplicate), showed that miR142-3p tends to reduce mesenchymal and induce neuronal transcriptomes, while silencing miR142-3p-induced mesenchymal transcriptomes (Fig. 8A). MDS analysis revealed that knockdown of miR142-3p reprogrammed ATRT-CD133- cells toward a mesenchymal signature, whereas miR142-3p over-expression in ATRT-CD133+ diverted it from mesenchymal toward a proneuronal signature (Fig. 8B, C). These data supported that the presence or absence of miR142-3p determines ATRT cell characteristics in terms of their stemness signature.

miR142-3p and Sox2/AC9 expression regulate the mesenchymal transformation and proneuronal transition in ATRT-CD133+ cells. (A) Microarray and bioinformatic analysis of the transcriptome profiling in MSCs, ATRT-CD133-, ATRT-CD133-/pLV-Spg, ATRT/CD133+, and ATRT-CD133+/pLV-miR142 cells. The pathways that upregulated (top right) or downregulated (bottom right) in the ATRT-CD133- and ATRT-CD133+/pLV-miR142 cells, compared with the other three cell types, were listed. (B, C) Multidimensional scaling analysis illustrated the average lineage transcriptome distances between the cell lines indicated (B). The distance between MSC and ATRT-CD133-, ATRT-CD133-/pLV-Spg, ATRT CD133+, or ATRT-CD133+/pLV-miR142 cells is shown in (C). The result showed that miR142-3p overexpression reduced mesenchymal and induced neuronal transcriptomes of ATRT/CD133+ cells, while miR142-3p knockdown reprogrammed ATRT/CD133- cells toward a mesenchymal signature. (D, E) Stable cell lines, as indicated in the chart, were subjected to qRT-PCR analysis of the expression levels of mesenchymal markers [tyrosine–lysine–leucine 40 kDA (YKL40), fibronectin, vimentin] and a glial lineage marker (glial fibrillary acidic protein; GFAP).
To determine the involvement of Sox2 and AC9 in the miR142-3p-dependent mesenchymal transformation, the mRNA expression of a panel of mesenchymal-favored markers [tyrosine–lysine–leucine 40 kDA (YKL40); also known as chitinase 3-Like 1 (CHI3L1), fibronectin, and vimentin] and glial fibrillary acidic protein (GFAP, a specific glial-lineage marker) (6) was compared. With Sox2/AC-9 double knockdown or miR142-3p overexpression, ATRT-CD133+ cells expressed a decrease of YKL40, fibronectin, and vimentin and an increase of GFAP transcript (Fig. 8D). Contrarily, Sox2/AC9 overexpression or miR142-3p silencing in ATRT-CD133- resulted in repressed GFAP but elevated mesenchymal-favored markers (Fig. 8E). Notably, the miR142-3p-mediated suppression of mesenchymal-favored markers in ATRT-CD133+ cells was enhanced by additional cooverexpression of Sox2/AC9, and miR142-3p SPONGE enhancement of mesenchymal-favored markers in ATRT-CD133- cells was repressed by double knockdown of Sox2/AC9 (Fig. 8E).
We next determined whether the miR142-3P-Sox2/AC9 pathway regulates tumor-initiating activity of ATRT in vivo. Compared with scrambled ATRT-CD133-/Scr cells, which needed at least 10,000 cells to form tumor nodules in nude mice, ATRT-CD133-/Spg was able to produce tumors with a much lower number of cells (as few as 50 cells per mice) (Table 3). This evidence supports that downregulation of miR142-3p in ATRT renders stem-like properties to initiate and regenerate new tumors. Furthermore, the elevated tumor-initiating property in ATRT-CD133-/Spg cells was repressed by co-knockdown of Sox2 and AC9. These data indicate that miR142-3p may suppress tumor initiation in ATRT by inhibiting Sox2 and AC9. Overall, maintaining miR142-3p at a low expression level is crucial for ATRT cells to retain CSC properties and in vivo tumor-initiating activity.
Downregulating miR142-3p Increased the Ionizing-Radiation Resistance in Radiosensitive Primary ATRT
The property of resistance to irradiation treatment is one of the major clinical criterion to characterize CSC in malignant pediatric tumors (1). We therefore evaluated the role of miR142-3p in regulating radiosensitivity in ATRT. To determine radiosensitivity, we used an ionizing radiation (IR) dose from 0 to 10 Gy to treat ATRT-CD133+ with or without overexpressed miR142-3p. As shown in Figure 9A, after IR treatment, the numbers of surviving ATRT-CD133+ cells without miR142-3p overexpression (ATRT-CD133+/pLV and parental ATRT-CD133+ cells) were significantly higher than those of ATRT-CD133+/pLV-miR142-3p (p < 0.01). In contrast, ATRT-CD133-/Spg had a better survival rate and also possessed a higher degree of radioresistance compared with the ATRT-CD133-/Scr and parental ATRT-CD133- cells (Fig. 9B).

miR142-3p, SOX2, and AC9 modulate the tumor-initiating ability and radiosensitivity of ATRT cells. (A) ATRT-CD133+/pLV, ATRT-CD133+/pLV-miR142-3p, and parental ATRT-CD133+ cells were subjected to survival tests after radiation exposure as indicated. Overexpression of miR142-3p reduced the radioresistance of ATRT/CD133+ cells (p < 0.01). (B) ATRT-CD133-/pLV-Scr, ATRT-CD133-/pLV-Spg, and parental ATRT/CD133- cells were subjected to survival tests after radiation exposure as indicated. Silencing of endogenous miR142-3p enhanced the radioresistance of ATRT/CD133- cells. (C) Immunocompromised mice were transplanted with ATRT-CD133+/pLV or ATRT-CD133+/pLV-miR142-3p cells and treated with or without radiation. The tumor size of each group was monitored for 6 weeks. Overexpressed miR142-3p enhanced the efficacy of IR to reduce tumor growth in vivo. (D) Mice transplanted with ATRT-CD133-/pLV-Scr, ATRT-CD133-/pLV-Spg, or ATRT-CD133-/pLV-Spg/sh-Sox2 + sh-AC9 cells were with or without radiation treatment. Silencing of endogenous miR142-3p significantly increased the resistance to radiotherapy in ATRT/CD133- cells, whereas additional silencing of SOX2/AC9 repressed the resistance. (E) Immunocompromised mice were injected with 1,000 or 10,000 ATRT-CD133-/pLV-Spg, ATRT-CD133-/pLV-Spg/sh-SC, or ATRT-CD133-/pLV-Spg/sh-Sox2 + sh-AC9 cells, with or without radiation treatment. The numbers of tumor-bearing mice were calculated and listed in the chart. Double knockdown of Sox2 and AC9 inhibited the tumor-initiating ability and increased the radiosensitivity of the miR142-3p-knocked down ATRT-CD133- cells.
To further validate the radiosensitizing effect of miR142-3p in ATRT, ATRT-CD133+/pLV-miR142-3p- and ATRT-CD133+/pLV-transplanted mice were treated with 4 Gy IR, and the tumor growth was monitored for 6 weeks (Fig. 9C). ATRT-CD133+/pLV cells formed a larger brain tumor 6 weeks after transplantation, and the IR treatment had limited inhibitory effect on tumor growth (ATRT-CD133+/pLV/IR). On the contrary, miR142-3p overexpression dramatically repressed tumor growth (ATRT-CD133+/ miR142-3p), and with additional IR treatment, the size of the tumor was maintained at a merely detectable level (ATRT-CD133+/miR142-3p/IR). This result not only confirmed the inhibitory role of miR142-3p on tumor growth, but also presented a synergetic effect of miR142-3p and IR treatments.
Furthermore, to investigate the involvement of Sox2 and AC9 in the miR142-3p-mediated radiosensitivity, mice transplanted with ATRT-CD133-/Scr, ATRT-CD133-/Spg, or ATRT-CD133-/Spg/sh-Sox2 + sh-AC9 cells were treated with or without IR and monitored by MRI (Fig. 9D). The results showed that silencing of endogenous miR142-3p (ATRT-CD133-/Spg) significantly promoted tumor growth even with the IR treatment, compared with the radiosensitive control pATRT/Scr cells (Fig. 9D). With additional co-knockdown of Sox2 and AC9 (ATRT-CD133-/Spg/sh-Sox2 + sh-AC9), the radiosensitivity of ATRT-CD133-/Spg was increased. Moreover, the rescue effect of double knockdown Sox2 and AC9 on radiosensitivity was also observed in the in vivo tumor-initiating ability of ATRT-CD133- (Fig. 9E). The miR142-3p-SPONGE-mediated elevation of tumor-initiation capacity in ATRT-CD133- cells was repressed by Sox2/AC9 double knockdown, and this repression was even more dramatic with IR treatment. Collectively, these data indicated that miR142-3p sensitizes ATRT cells to IR, in which Sox2 and AC9 are involved.
Discussion
ATRT is the most common primary brain tumor with a dismal prognosis. Most patients relapse within months after aggressive surgical and radiochemotherapy. In this study, expression of miR142-3p was lower in patients with ATRT than those in medulloblastoma (MB), and ATRT-CD133+ cells with coexpression of Sox2 and AC9 and suppressed miR142-3p had strong tumor-initiating abilities. miR142-3p regulated tumor-initiating properties and mesenchymal transformation in ATRT and ATRT-CD133+ cells by targeting Sox2 and AC9. Increased miR142-3p reduced tumorigenicity, mesenchymal transformation, and radioresistance in ATRT-CD133+ cells, while miR142-3p downregulation promoted tumor-initiating and radioresistant properties in ATRT-CD133- cells and appears to be a marker of progression and malignancy in ATRT patients. Therefore, miR142-3p may be involved in the transcriptional network of CSC reprogramming and mediate mesenchymal transformation in brain tumors. Most importantly, overexpression of miR142-3p effectively blocked tumor growth and mesenchymal-transitional properties and synergetically enhanced radiotherapeutic effects in ATRT-CD133+-derived orthotopic xenografts. To the best of our knowledge, this is the first study to identify miR142-3p as a critical modulator in cancer stem-like properties and recurrence in ATRT, and suggest that miR142-3p may be a potential biomarker and could be an effective miRNA-based approach for ATRT treatment.
The involvement of miRNAs in tumorigenicity has been a major research focus in the search for alternative cancer therapy; accumulating evidence has been reported supporting the involvement of miRNAs in CSC-like properties (18,24,25,34). For example, ectopic expression of lethal-7 (let-7), miR200c, and miR30 suppress the tumorigenicity of breast CSCs (33,44). Recently, Iliopoulos and colleagues reported that miR200b regulates CSC properties through directly targeting suppressor of zeste 12 homolog (Suz12), a subunit of a polycomb repressor complex (23). In the present study, miR142-3p directly targeted Sox2 and AC9 3′UTRs, leading to repressed stemness and tumorigenicity in ATRT cells. Knockdown of miR142-3p expression significantly activated ATRT-CSC self-renewal and repressed pluripotency gene expression. Furthermore, we showed that sponge-miR142-3p increases the in vivo tumor-initiating ability of primary ATRT by 1,000-fold (Table 3). This evidence supports that downregulation of miR142-3p in ATRT leads to stem-like properties, conferring ATRT cells with the ability to initiate and regenerate new tumors. MiR142-3p appears to negatively regulate stemness gene expression, and reduced miR142-3p expression promotes CSC-related self-renewal and radioresistant properties. Overexpression of Sox2 promotes the medulloblastoma tumor-initiating cell and is negatively correlated with medulloblastoma patient survival (37). Our data further demonstrates that co-knockdown of Sox2 and AC9 repressed the tumor-initiating and radioresistant capabilities in ATRT cells induced by the downregulation of miR142-3p. Further investigation on miR142-3p-modulated dedifferentiation or reprogramming of ATRT or ATRT-CSCs will provide deeper insights on the role of miR142-3p in ATRT progression.
In conclusion, miR142-3p regulates tumor-initiating properties and mesenchymal transformation in ATRT through suppressing Sox2 and AC9. Elevated miR142-3p expression decreases cancer stem-like characteristics and stemness; miR142-3p inhibition enhances the tumorigenic properties of ATRT. Thus, miR142-3p is potentially a novel therapy for brain tumor in children.
Footnotes
Acknowledgments
This study was assisted in part by the Division of Experimental Surgery of the Department of Surgery, and Center for Stem Cell Research, Taipei Veterans General Hospital. This study was funded by the Department of Health Cancer Center Research of Excellence (DOH-TD-C-111-005), NSC-(3111-B-039, 3111-B-075-001-MY3, 2632-B-039-001, 2314-B-341-001-MY3), Taipei Veterans General Hospital (Stem Cell Project E96-99), Yen-Tjing-Ling Medical Foundation (96-99), and National Yang-Ming University (Ministry of Education, Aim for the Top University Plan). The authors declare no conflicts of interest.