
Abstract
It is well documented that specialized mesenchymal stem/stromal cells (MSCs) constitute the hematopoietic stem cell (HSC) niche in the bone marrow (BM), and these MSCs support/maintain the HSCs in an undifferentiated state. A number of studies have demonstrated that BM-derived MSCs (BM-MSCs) can support HSCs in vitro. However, it remains unclear whether nonhematopoietic tissue-derived MSC-like cells, such as dental pulp stem cells (DPSCs), have the ability to support HSCs. In this study, we prospectively isolated DPSCs from mouse mandibular incisors by fluorescence-activated cell sorting (FACS) using BM-MSC markers, such as PDGFRα and Sca-1. The PDGFRα and Sca-1 double-positive DPSCs and BM-MSCs showed similar morphologies and expression patterns of MSC markers. The ability of the DPSCs to support hematopoietic stem/progenitor cells (HSPCs) was then analyzed by an in vitro coculture system. Moreover, their HSC-supporting activity was evaluated by in vivo xenotransplantation assays using NOD/Shi-scid/IL-2Rγcnull (NOG) mice. Interestingly, the DPSCs supported human cord blood (CB)-derived CD34-positive (CD34+), as well as CD34-negative (CD34–), HSCs. The supporting activities of DPSCs for human CB-derived CD34+ and CD34– HSCs were comparable to those of BM-MSCs. The results of the present study demonstrated, for the first time, that prospectively isolated murine PDGFRα and Sca-1 double-positive DPSCs could support primitive human CD34+ and CD34– HSCs in vitro.
Keywords
Introduction
Hematopoietic stem cells (HSCs) can self-renew and differentiate into all types of blood cells (2,14,29). These HSCs are maintained in an undifferentiated state in a specialized environment, which is called the HSC niche (17,19). The HSC niche in bone marrow (BM) has been suggested to comprise BM-derived mesenchymal stem/stromal cells (BM-MSCs) (18), osteoblasts (3,43), endothelial cells (9), chemokine C-X-C motif ligand 12 (CXCL12) abundant reticular (CAR) cells (27,39), and so on. A number of studies have suggested that BM-MSCs isolated from different species have the potential to support undifferentiated HSCs obtained from different species (8,30,40,42). For example, mouse BM-derived MSCs could support human HSCs in an undifferentiated state in vitro (40,42).
Many investigators have since reported the establishment of MSC-like cells from a variety of fetal (29) and adult mesenchymal tissues, including nonhematopoietic tissues (31,32,34,36). The potential of MSC-like cells isolated from nonhematopoietic tissues to support HSCs still remains unclear, while the HSC-supporting potential of BM-MSCs is well documented. Recent studies demonstrated that MSC-like cells isolated from mouse and human adipose tissue (adipose tissue-derived MSCs; ADSCs) could support human cluster of differentiation 34-positive (CD34+) HSCs in vitro (24,26). These results therefore suggest that other nonhematopoietic tissue-derived MSC-like cells may also support HSCs.
The dental pulp is the mesenchymal tissue in the tooth, and it is surrounded by dentin and enamel. Dental pulp is a nonhematopoietic tissue, although blood vessels are extended into the dental pulp. Previous studies have reported that MSC-like dental pulp stem cells (dental pulp-derived MSCs, DPSCs) exist in the dental pulp (16,25). One of the major roles of DPSCs is thought to be their ability to supply hard tissue components by differentiating into odontoblasts (10). BM-MSCs have also been suggested to supply hard tissue components by differentiation into osteoblasts (28). On the other hand, it remains uncertain as to whether DPSCs are capable of supporting undifferentiated HSCs in vitro like BM-MSCs. As previously mentioned, ADSCs can support undifferentiated HSCs in vitro, which thus suggests that DPSCs may have similar properties. In order to explore whether murine DPSCs can support human HSCs in an undifferentiated state, we extensively investigated the potential of mouse DPSCs to support HSCs in vitro. We herein demonstrate, for the first time, that prospectively isolated mouse platelet-derived growth factor receptor a (PDGFRα) and stem cell antigen-1 (Sca-1) double-positive DPSCs can support primitive human HSCs.
Materials and Methods
Animals
Female 5-week-old C57BL/6 mice were purchased from Shimizu Laboratory Supplies (Kyoto, Japan). Female 6-week-old nonobese diabetic/severe combined immunodeficient/interleukin-2 receptor g chain knockout (NOD/Shi-scid/IL-2Rγcnull; NOG) mice were purchased from the Central Institute of Experimental Animals (Kawasaki, Japan). For the isolation of dental pulp cells and BM cells, we used 5 to 10 C57BL/6 mice for each individual experiment. For severe combined immunodeficient (SCID)-repopulating cell (SRC) assays, we used 36 NOG mice. All mice were handled under sterile conditions and were maintained in germ-free isolators located in the Central Laboratory Animal Facilities of Kansai Medical University. All mice were fed ad libitum and maintained in compliance with Kansai Medical University's guidelines for the care and use of laboratory animals in research. The animal experiments were approved by the Animal Care Committees of Kansai Medical University.
Preparation of Mouse Cells
The preparation of mouse incisor pulp tissue-derived cells has been described previously (25). In brief, the cells were suspended in Ca2+ and Mg2+-free Dulbecco's phosphate-buffered saline (PBS–; Nacalai Tesque, Kyoto, Japan) containing 2% fetal calf serum (FCS; Thermo Trace Ltd., Noble Park, Australia). The BM cells were isolated from euthanized C57BL/6 mice by an enzymatic isolation method as described previously (21,22). The BM cells were hemolyzed by lysing buffer (BD Pharm Lyse, BD Biosciences, San Jose, CA, USA), and BM mononuclear cells (MNCs) were prepared for the purification of BM-MSCs by fluorescence-activated cell sorting (FACS).
Antibody Staining and Isolation of Mouse DPSCs and BM-MSCs by FACS
Dissociated dental pulp cells and BM MNCs were preincubated with mouse BD Fc Block (BD Biosciences) to reduce nonspecific binding and then were stained with the following antibodies: allophycocyanine (APC)-conjugated chemokine C-X-C receptor 4 (CXCR4) (247506, R&D Systems, Minneapolis, MN, USA), and PDGFRα (APA5, eBioscience, San Diego, CA, USA), Pacific Blue-conjugated Sca-1 (lymphocyte antigen 6A/E; Ly6A/E; D7, BioLegend, San Diego, CA, USA), fluorescein isothiocyanate (FITC)-conjugated CD45 (30-F11, eBioscience), TER119 [hybridoma clone TER-119 antigen (lymphocyte antigen 76; ly76), eBioscience], CD45R/B220 (RA3–6B2, eBioscience), Gr-1 [lymphocyte antigen 6G (Ly6G); RB6–8C5, eBioscience], T-cell receptor α β (TCRαβ; H57–597, eBioscience), TCRγδ (GL3, eBioscience), CD11b (M1/70, eBioscience), phycoerythrin (PE)-conjugated CD29 (HMb1–1, eBioscience), CD49e (HMa5–1, eBioscience), CD49f (GoH3, eBioscience), CD71 (R17.217.1.4, eBioscience), CD90 (53–2.1, BD Biosciences), CD105 (MJ7/18, eBioscience), CD133 (13A4, eBioscience), c-kit (2B8, eBioscience), PDGFRα (APA5, eBioscience), and PDGFRβ (APB5, eBioscience). All antibodies without antihematopoietic lineage-specific antibodies (CD11b, CD45, CD45R/B220, Gr-1, TCRab, TCRγδ, and TER119) were diluted 25-fold in PBS- containing 2% FCS. Antihematopoietic lineage-specific antibodies were diluted 50-fold in PBS– containing 2% FCS. Subsequently, the cells were washed with annexin V binding buffer (Beckman Coulter, CA, USA) and stained with a FITC-conjugated annexin V antibody (Beckman Coulter) at a dilution of 25-fold in annexin V binding buffer. Finally, the cells were stained with 100-fold diluted 7-amino-actinomycin D (7-AAD; Beckman Coulter). The 7-AAD fluorescence was measured, and a live cell gate was defined to exclude the cells positive for 7-AAD. Next, a specialized fraction of the DPSCs or BM-MSCs was sorted by gating as described in the Results section. The cultured cells were dissociated using cell dissociation buffer (enzyme-free, Hank's-based; Gibco, Tokyo, Japan). The dissociated cells were stained with a PDGFRα (1:25; APA5; eBioscience) or Sca-1 (1:25; Ly6A/E; BioLegend) antibody, and then a flow cytometric (FCM) analysis was performed.
Flow Cytometric Analysis and Cell Sorting
The FCM analysis and cell sorting were performed using a BD FACSAria cell sorter (BD Biosciences) or BD FACSCanto II flow cytometer (BD Biosciences), and the data were processed using the FlowJo software program (Treestar, Ashland, OR, USA).
Cell Proliferation Assay
One hundred sorted dental pulp cells were seeded onto a Falcon Optilux 96-well cell culture plate (BD Biosciences) in basal medium containing α modified minimum essential medium (α-MEM; Gibco) supplemented with 10% FCS. The cell culture plates were incubated at 37°C with 5% CO2 in air. A proliferation assay was performed 1, 3, 5, 7, 9, and 11 days after seeding. The cells were washed with PBS–, and 0.1 mg/ml of calcein-AM solution (Dojindo, Osaka, Japan) diluted with PBS-was added to each well. The plates were incubated for 30 min at room temperature. The fluorescence intensity (FI) of cellular calcein-AM (λex = 490 nm, λem = 515 nm) was measured using the Wallac 1420 ARVO-SX Fluorescence Multilabel Counter (Perkin-Elmer, Waltham, MA, USA). The background FI of the PBS– was subtracted from the FI of each well, and these FIs were then compared with the intensity of the calcein-AM solution free from cells.
For the fibroblastic colony formation (CFU-F) assay, 50 sorted DPSCs and BM-MSCs were seeded onto a 10 cm in diameter cell culture dish (BD Biosciences) in basal medium containing α-MEM supplemented with 10% FCS. The cell culture dishes were incubated at 37°C with 5% CO2 in air. After 2 weeks, the cells were stained with 0.1 mg/ml of calcein-AM solution, and the fluorescence of cellular calcein-AM from fibroblastic colonies was visualized using an image analyzer (Typhoon9400, GE Healthcare, Tokyo, Japan).
Alkaline Phosphatase Staining
Alkaline phosphatase (ALP) staining was carried out using a tartrate-resistant acid phosphatase (TRAP)/ALP staining kit (Wako Pure Chemicals, Osaka, Japan) according to the protocol provided in the kit. Two hundred sorted DPSCs and BM-MSCs were seeded onto 24-well cell culture plates (BD Biosciences) in basal medium containing α-MEM supplemented with 10% FCS. The cell culture plates were incubated at 37°C with 5% CO2 in air. When the cultured DPSCs and BM-MSCs reached confluence, they were stained with an ALP substrate solution.
Differentiation Assay
The induction of the adipogenic, osteogenic, and chondrogenic differentiation of DPSCs was performed using a Mouse Mesenchymal Stem Cell Functional Identification Kit (R&D Systems) according to the manufacturer's instructions. The induction of osteogenic and adipogenic differentiation and immunofluorescent staining with osteopontin and fatty acid-binding protein 4 (FABP4), respectively (both R&D Systems; 10 μg/ml), were performed as previously described (25). Chondrocyte pellets were prepared for frozen sectioning, and collagen II was detected by immunofluorescent staining 3 weeks after the induction of differentiation. The cell section was incubated overnight at 4°C in a humidified chamber with the collagen II-specific primary antibody (1:500; sheep anti-mouse collagen II antibody; R&D Systems). Subsequently, the cells were incubated with an Alexa Fluor-594-conjugated or Alexa Fluor-488-conjugated secondary antibody (1:1,000; Molecular Probes, Eugene, OR, USA). The nuclei were counterstained with Hoechst 33342 (1:10,000; Invitrogen, Carlsbad, CA, USA), and then the cells were observed under a BX-50 fluorescence microscope (Olympus, Tokyo, Japan).
RNA Preparation and PCR
Nucleotide Sequences of the Primers Used in This Study

Purification of Human 18 Lineage-Negative CD34+ and CD34– Cells From Human Cord Blood
Recently, we developed a high-resolution purification method for primitive human CD34-negative (CD34-) HSCs (7). Using this method, human cord blood (CB)-derived 18 lineages (CD2, CD3, CD4, CD7, CD10, CD14, CD16, CD19, CD20, CD24, CD41, CD56, CD235a, CD11b, CD33, CD45RA, CD66c, and CD127)-negative (18Lin–) CD34+ or 18Lin-CD34– cells were sorted for the following experiments. Human CB samples were obtained from normal full-term deliveries after the patients provided signed informed consent. This study was approved by the Institutional Review Board of Kansai Medical University. We used a total of 59 pooled male and female CB samples in three sorting experiments to isolate 18Lin–CD34+/– cells. The CB-derived lineage-negative (Lin-) mononuclear cells were separated using an immunomagnetic cell separation device (EasySep, StemCell Technologies, Vancouver, BC, Canada). The pooled Lin– cells from multiple donors were stained with monoclonal anti-human antibodies (1:50). The monoclonal anti-human antibodies used in the study were reported previously (7). Subsequently, an FCM analysis and cell sorting were performed.
Coculture of Human 18Lin– CD34+ or 18Lin– CD34– Cells with Mouse DPSCs or BM-MSCs and the Analysis of the Culture-Generated Human Cells by Flow Cytometry
The coculture system and assay were performed as reported previously (7). A total of 2,000 purified human CB-derived 18Lin– CD34+ or 18Lin–CD34– cells per well of 24-well plates (BD Biosciences) were plated without a feeder layer or were plated onto irradiated (12 Gy using a cesium-137 γ-ray irradiator; Gammacell 40 Exactor, Best Theratronics, Ontario, Canada) mouse DPSC or mouse BM-MSC layers and cultured in StemPro-34 medium (Gibco) and a cocktail of cytokines (7). After 1 week, all of the cells were collected, and the number of human CD34+ cells was analyzed by FCM as reported previously (7).
SCID-Repopulating Cell Assay and Serial Analysis of Human CD45+ Cell Engraftment in NOG Mice by Flow Cytometry
The SRC assay was originally developed by Dick and colleagues (4). We modified their method using an intra-BM injection (IBMI) technique as precisely reported previously (41). A total of 1,000 purified CB-derived 18Lin–CD34+ or 18Lin–CD34– cells were cocultured with mouse BM-MSCs or DPSCs for 1 week, as described above (7). Next, the cocultured cells were recovered and transplanted by an IBMI method into sublethally irradiated (250 cGy using a cesium-137 γ-ray irradiator) 7- to 8-week-old NOG mice. The repopulation of human CD45+ hematopoietic cells in NOG mouse BM was analyzed by FCM 20 weeks later.
Statistical Analysis
Two-tailed Student's t tests were used to compare the differences in the mean expression levels of each gene between the DPSCs and BM-MSCs. The Bonferroni's multiple comparison procedures were used to compare differences in each pair for the percentages of CD34+ cells after cocultures with BM-MSCs and DPSCs. The Mann–Whitney U tests with Bonferroni correction were used to compare differences in the medians for the human hematopoietic cell reconstitution rate in recipient mice.
Results
Prospective Isolation and Identification of Mouse DPSCs
Using cell surface markers that are useful for the identification of BM-MSCs, DPSCs were prospectively isolated by FACS (Fig. 1A). Freshly isolated mouse dental pulp cells were stained with antibodies against hematopoietic lineage-specific and MSC markers. First, the R1 gate was set as shown in Figure 1A-a. A live cell gate was defined to exclude the cells positive for 7-AAD, as shown in Figure 1A-b. The hematopoietic (CD11b+, CD45+, CD45R/B220+, Gr-1+, TCRαβ+, TCRγδ+, and TER119+) cells and preapoptotic cells, which were annexin V+, were gated out as shown in Figure 1A-c. The resulting hematopoietic lineage-negative cells were subdivided into four distinct populations based on their surface expression of PDGFRα and Sca-1 (Fig. 1A-d). Approximately 1,000 PDGFRα+Sca-1+ cells (DPSCs) were obtained from the mandibular tissues of five mice (data not shown) and then were cultured in basal medium containing α-MEM with 10% FCS. The DPSCs adhered to the cell culture dishes and proliferated (Fig. 1B).
The flow cytometry (FCM) analysis and isolation of mouse DPSCs. (A) Representative FACS profiles of mouse platelet-derived growth factor α-positive stem cell antigen-1-positive (PDGFRα+Sca-1+) dental pulp stem cells (DPSCs). (a) The forward scatter/side scatter (FSC/SSC) profile of dental pulp cells. The R1 gate was set in order to exclude cell debris. (b) The R2 gate was set for the living cells (7-amino-actinomycin D negative; 7-AAD–). (c) The hematopoietic {cluster of differentiation 11b positive [CD11b+], CD45+, CD45R/B220+, Gr-1+ [lymphocyte antigen 6G positive; Ly6G+], T-cell receptor α β positive [TCRαβ+], TCRγδ+, and TER119+ [hybridoma clone TER-119 antigen (lymphocyte antigen 76; ly76)]} cells and annexin V+ cells (preapoptotic cells) were gated out. The R3-gated cells were further subdivided according to their PDGFRα and Sca-1 expression. (d) Cells residing in the R4 gate were classified as PDGFRα and Sca-1 double-positive cells. (B) A representative phase-contrast image of sorted dental pulp-derived cells (R4-gated cells). These images were magnified with 10× (a) and 20× (b) objective lenses. Scale bars: 100 μm (a) and 25 μm (b).
Cellular Characterization of DPSCs
The sorted Lin–PDGFRα+Sca-1+ DPSCs (R4 gate in Fig. 1A-d) were adherent and exhibited a high logarithmic growth pattern, as shown in Figure 2A and B. However, the other cell fractions, which are shown in Figure 1A-d (PDGFRα+Sca-1– cells, PDGFRα–Sca-1+ cells, and PDGFRα–Sca-1– cells), did not show any growth potential (Fig. 2B). The DPSCs seeded onto six-well culture plates (1,000 cells per well) were almost confluent on day 12 (Fig. 2A). Both PDGFRα and Sca-1 were still expressed on the cell surface even after 14 days of culture (Fig. 2C). The DPSCs expressed LIM [Lin11, islet 1 (Isl-1) and mitosis entry checkpoint-3 (Mec-3)] homeo-box 6 (Lhx6), and osteocalcin, which are potential markers of odontoblast progenitor cells. However, the DPSCs did not express dentin sialophosphoprotein (Dspp), an odontoblast marker (Fig. 2D). On the other hand, dental pulp tissues expressed all odontoblast and progenitor cell markers, while whole BM cells did not express these markers (Fig. 2D). The DPSCs exhibited the ability to differentiate into osteocytes, chondrocytes, and adipocytes in vitro (Fig. 2E).
Cellular characterization of PDGFRα+Sca-1+ dental pulp-derived cells. (A) Representative phase-contrast images of PDGFRα+Sca-1+ DPSCs, which were cultured for 3, 5, 8, and 12 days after sorting, respectively. Scale bars: 100 μm, respectively. (B) The cell growth potential correlated with the FI of calcein-AM incorporated into living cells. The PDGFRα+Sca-1+ cells are indicated by closed circles; PDGFRα+Sca-1– cells, closed squares; PDGFRα–Sca-1+ cells, open squares; PDGFRα–Sca-1– cells, open circles. The bars represent the means ± SE of four independent experiments. (C) The PDGFRα and Sca-1 expression on the surface of PDGFRα+Sca-1+ DPSCs cultured for 14 days. Representative FACS profiles are shown. Solid histograms indicate isotype controls; open histograms, specific antibodies, as indicated. (D) Representative results of the RT-PCR analysis of the expression of odontoblast-specific genes. The mRNA expression levels of LIM homeobox 6 (Lhx6), dentin sialophosphoprotein (Dspp), and osteocalcin were analyzed. Glyceraldehyde 3-phosphate dehydrogenase (Gapdh) was used as an internal control. (E) The induction of the osteocytic, chondrogenic, and adipocytic differentiation of PDGFRα+Sca-1+ DPSCs. Representative fluorescence microscopic images are shown. (a) Osteogenic induction of PDGFRα+Sca-1+ DPSCs. The cells were cultured in an osteogenic induction medium (osteogenic differentiation). Immunofluorescence staining of osteopontin (red) and nuclear Hoechst staining (blue) are shown. (b) Chondrogenic induction of PDGFRα+Sca-1+ DPSCs. The cells were cultured in a chondrogenic induction medium (chondrogenic differentiation). Immunofluorescence staining of collagen II (green) and nuclear staining (blue). (c) Adipogenic induction of PDGFRα+Sca-1+ DPSCs. The cells were cultured in an adipogenic induction medium (adipogenic differentiation). Immunofluorescence staining of fatty acid-binding protein 4 (FABP4) (red) and nuclear staining (blue) are shown. Scale bars: 100 μm, respectively.
A Comparative Analysis for the Cellular Characterization of DPSCs and BM-MSCs
Both the cultured PDGFRα+Sca-1+ DPSCs and PDGFRα+Sca-1+ BM-MSCs showed adherent fibroblastlike morphologies (Fig. 3A). Next, we compared the colony-forming unit-fibroblast (CFU-F) activities of primary cultured DPSCs and BM-MSCs. DPSCs seeded onto 10-cm cell culture dishes (50 cells per dish) formed a significant number of CFU-F colonies (approximately 13 colonies per dish) after 14 days of culture (Fig. 3B-a). However, BM-MSCs formed few colonies (approximately two colonies per dish) (Fig. 3B-b). To investigate whether the primary cultured DPSCs and BM-MSCs possessed ALP activity, ALP staining was carried out. The DPSCs showed high ALP activity, while the BM-MSCs showed much lower ALP activity (Fig. 3C-a, b).
A comparative analysis of the cellular characterization of DPSCs and BM-MSCs. (A) Representative phase-contrast images are shown of PDGFRα+Sca-1+ DPSCs (a) and PDGFRα+Sca-1+ BM-MSCs (b), which were cultured for 5 days after sorting. Scale bars: 100 μm, respectively. (B) Comparison of the CFU-F activities of primary cultured PDGFRα+Sca-1+ DPSCs (a) and PDGFRα+Sca-1+ BM-MSCs (b). Fifty sorted cells were seeded onto a 10 cm in diameter cell culture dish, and the CFU-F activities were analyzed after 2 weeks. The CFU-F activities were analyzed by four independent experiments, and representative images are shown. (C) The alkaline phosphatase (ALP) activities of primary cultured DPSCs (a) and BM-MSCs (b). When the cultured cells reached confluence, the cells were stained with ALP substrate solution. The ALP activities were analyzed by four independent experiments, and representative images are shown.
A Comparative FCM Analysis for Cell Surface Markers of DPSCs and BM-MSCs
The FCM analysis showed that DPSCs (Fig. 4A, the R4 gate) expressed various MSC markers, such as CD29, CD49e, CD90, CD105, and PDGFRβ (Fig. 4A). The BM-MSCs (Fig. 4B, the R4 gate) also expressed all of these MSC markers (Fig. 4B). However, CD49f and CD71 were detected specifically in DPSCs (Fig. 4A, B). In addition, the expression levels of certain MSC markers, such as CD90, CD105, and PDGFRβ, on the BM-MSCs were comparatively weaker than those of DPSCs (Fig. 4A, B). The expression of CD133, c-kit, and CXCR4, which are markers of undifferentiated HSCs, were not detected in either of the cell types (Figs. 4A, B).
A comparative FCM analysis of cell surface markers of DPSCs and BM-MSCs. (A) Representative FACS profiles and the results of the FCM analyses for cell surface markers of PDGFRα+Sca-1+ DPSCs. (B) Representative FACS profiles and the results of the FCM analyses for cell surface markers of PDGFRα+Sca-1+ BM-MSCs, the FSC/SSC profiles of the cells. The R1 gate was set in order to exclude cell debris. The R2 gate was set for the living cells. The hematopoietic (CD11b+, CD45+, CD45R/B220+, Gr-1+, TCRαβ+, TCRγδ+, and TER119+) cells and annexin V+ cells (preapoptotic cells) were gated out (the R3 gate). Cells residing in the R4 gate were classified as PDGFRα and Sca-1 double-positive cells. Representative results of the FCM analyses for cell surface markers expressed on freshly isolated PDGFRα+Sca-1+ dental pulp-derived (A) and BM-derived stem cells (B) (R4 gated cells). Solid histograms, isotype controls; open histograms, specific antibodies, as indicated. All of the experiments were repeated, and representative FACS profiles are shown. CXCR4, chemokine C-X-C motif receptor 4.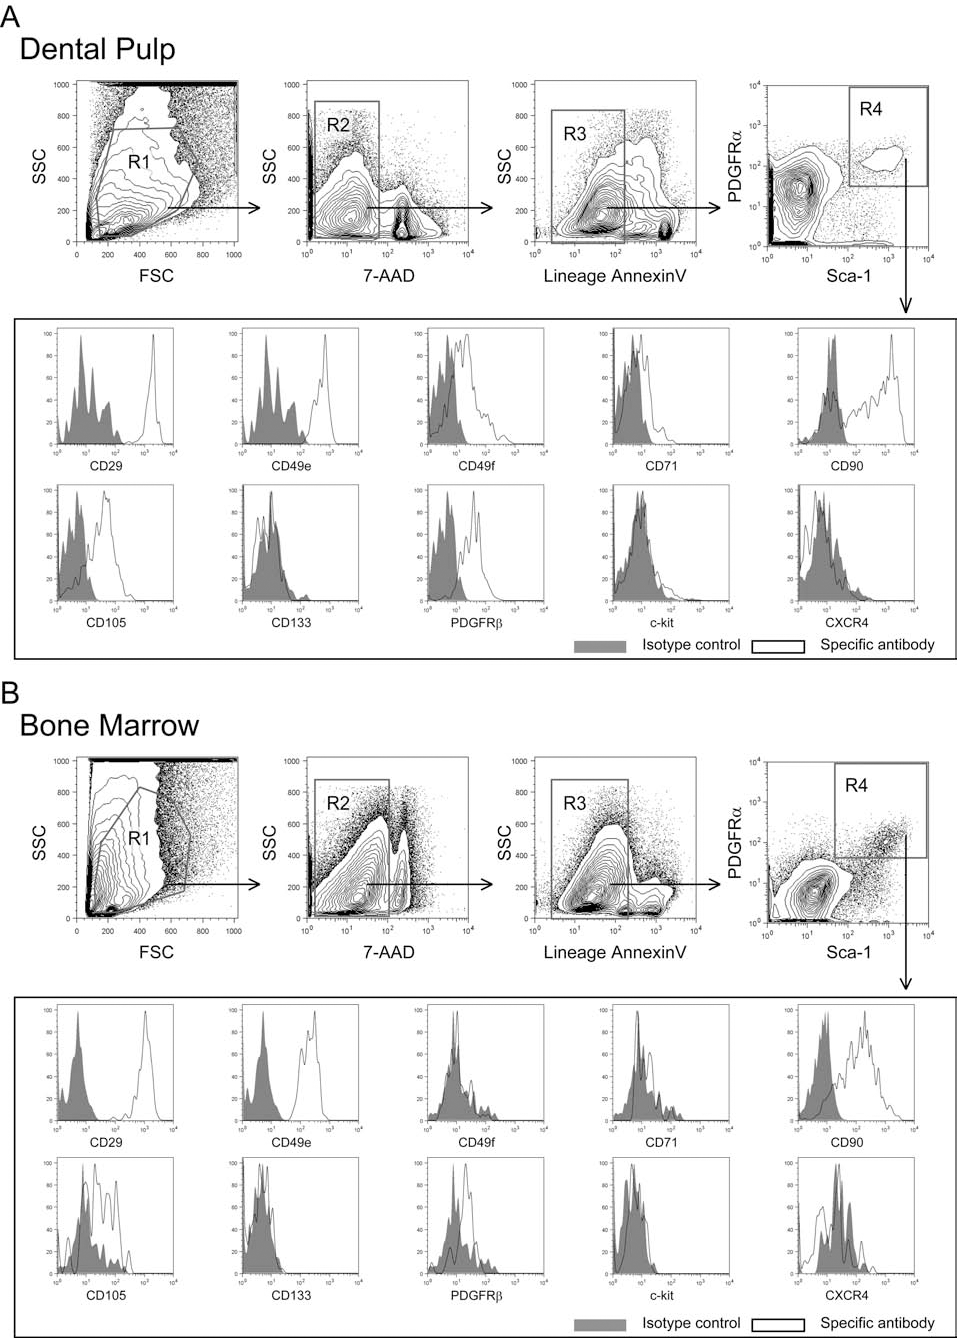
Gene Expression Profiles of DPSCs and BM-MSCs
The quantitative real-time RT-PCR analysis revealed that the DPSCs and BM-MSCs had different gene expression patterns, as shown in Figure 5. Among the genes encoding notch receptors, their related genes and ligands, the DPSCs tended to express higher levels of Notch1, 2, 3, and Lfng. They expressed a significantly higher level of Jag1 compared to the BM-MSCs (p = 0.03). On the other hand, the expression levels of other notch ligand genes, such as Jag2 and Dll1, were not significantly different between DPSCs and BM-MSCs. Furthermore, we investigated the gene expression levels of Nestin, Angpt1, and Cxcl12, which are known to be related to the support/maintenance of HSCs. The DPSCs expressed significantly higher levels of Cxcl12 compared to the BM-MSCs (p < 0.05). The expression level of Nestin in DPSCs was comparatively (but not significantly) higher than that in BM-MSCs.
Gene expression profiles of DPSCs and BM-MSCs. The quantitative real-time RT-PCR analysis revealed differentially expressed genes between PDGFRα+Sca-1+ BM-MSCs and PDGFRα+Sca-1+ DPSCs. The quantitative real-time RT-PCR analysis was repeated three times. The gene expression of BM-MSCs is shown in the left column and that of DPSCs is shown in the right column of each graph. The signal intensities of DPSCs were compared with the intensities of BM-MSCs, and bars represent the means ± SD of three independent measurements. Data were evaluated by the two-tailed Student's t test. The p values are indicated in each graph; n.s. means no significant difference (p > 0.05). The p value of nestin gene expression in DPSCs was in the range of 0.05 to 0.1. Lfng, lunatic fringe homolog; Hes1, hairy and enhancer of split 1; Jag1, jagged 1; Dll1, delta-like 1; Angpt1, angiopoietin 1; Cxcl12, chemokine C-X-C motif ligand 12.
HSPC-Supporting Potential of DPSCs and BM-MSCs
As reported previously, CB-derived CD34– SRCs could produce CD34+ SRCs in vitro (7,11–13,41). In order to investigate whether DPSCs and BM-MSCs have the potential to support human hematopoietic stem/progenitor cells (HSPCs) in vitro, 2,000 human CB-derived 18Lin– CD34+ or 18Lin–CD34– cells (shown in Fig. 6A) were cocultured with DPSCs or BM-MSCs in the presence of a cocktail of cytokines [i.e., stem cell factor, fms-related tyrosine kinase 3 (flt3) ligand, thrombopoietin (TPO), interleukin (IL)-3, IL-6, and granulocyte colony-stimulating factor (G-CSF)] for 1 week. These human CB-derived 18Lin-CD34+ and 18Lin-CD34- cells proliferated and formed large cobblestone areas in cocultures with the DPSCs and BM-MSCs (Fig. 6B). On the other hand, the 18Lin-CD34+ and 18Lin-CD34- cells were proliferating, but in a floating state, in the feeder-free cultures (Fig. 6B).
Coculture of 18Lin–CD34+ or 18Lin–CD34– cells with mouse BM-MSCs or DPSCs. (A) Representative FACS profiles of human cord blood (CB)-derived 18Lin–CD34+ or 18Lin–CD34– cells. (a) The FSC/SSC profile of immunomagnetically separated lineage-negative cells. The R1 gate was set on the blast-lymphocyte window. (b) The R2 gate was set for the living cells (7AAD-negative) and 18 lineage markers-negative (18Lin–) cells. (c) The 18Lin– cells residing in the R2 gate were further subdivided into two fractions: 18Lin–CD45+CD34+ (R3) and 18Lin–CD45+CD34– (R4) cells, according to their expression levels of CD34. (B) 18Lin–CD34+ or 18Lin–CD34– cells were cocultured with mouse BM-MSCs (mBM-MSCs) or DPSCs (mDPSCs) in the presence of six cytokines [stem cell factor, fms-related tyrosine kinase 3 (flt3) ligand, thrombopoietin (TPO), interleukin (IL)-3, IL-6, and granulocyte colony-stimulating factor (G-CSF)] for 1 week. Representative photomicrographs taken on day 7 are presented. Human CB-derived 18Lin–CD34+ and 18Lin–CD34– cells generated large cobblestone areas in the presence of BM-MSCs or DPSCs (shown as feeder cells). In contrast, 18Lin–CD34+ and 18Lin–CD34– cells did not form cobblestone areas without feeder cells (shown as feeder free). Scale bars: 80 μm, respectively. (C) The rates of human CD45+CD34+ cells in feeder-free cultures and cocultures with BM-MSCs and DPSCs in the presence of 18Lin–CD34+ cells (a) and 18Lin–CD34– cells (b). The percentages of CD34+ cells derived from the 18Lin–CD34+ or 18Lin–CD34– cells cocultured with mouse BM-MSCs were significantly higher than the percentages of CD34+ cells cocultured with mouse DPSCs (p < 0.01 or p < 0.05). In contrast, the percentages of CD34+ cells derived from 18Lin–CD34+ or 18Lin–CD34– cells in the feeder-free culture conditions (shown as feeder free) were significantly lower (p < 0.01) than those of cocultures with BM-MSCs or DPSCs (shown as feeder cells). The bars represent the means ± SD of four independent experiments. Data were evaluated by t test and Bonferroni correction for multiple comparisons.
After 1 week, the cells in each well were collected by vigorous pipetting, and were then counted and analyzed for the CD34+ cell content by FCM. The percentages of CD34+ cells after 7 days of cocultures with BM-MSCs and DPSCs were significantly higher than those from feeder-free culture conditions (p < 0.01) (Fig. 6C). In the cocultures of 18Lin-CD34+ and 18Lin-CD34- cells with BM-MSCs, the percentages of CD34+ cells were significantly higher than those of 18Lin-CD34+ and 18Lin–CD34– cells cocultured with DPSCs (p < 0.05) (Fig. 6C).
SRC Activities of 18Lin-CD34+ and 18Lin-CD34- Cells Cocultured with DPSCs and BM-MSCs
Then, the SRC activities of human CB-derived 18Lin-CD34+ and 18Lin-CD34- cells cocultured with mouse BM-MSCs or DPSCs were evaluated using NOG mice as reported previously (7,11–13,41). Human CB-derived 18Lin-CD34+ or 18Lin-CD34- cells cocultured with mouse BM-MSCs, DPSCs, or without feeder cells were transplanted into NOG mice by the IBMI method. The human CD45+ cell rates in the recipient mouse BM was analyzed 20 weeks after transplantation by aspiration, as reported previously (7) (Fig. 7). In the feeder-free condition, one or two of the six mice that received transplants of cultured 18Lin-CD34+ and 18Lin-CD34- cells were engrafted; however, the median repopulation rates were low (<0.01%). On the other hand, most of the mice that received the 18Lin-CD34+ and 18Lin-CD34- cells cocultured with mouse BM-MSCs or DPSCs were engrafted. There was no significant difference in the median engraftment levels between these two groups (2.23% vs. 11.03% of 18Lin-CD34+ cells transplanted and 4.56% vs. 8.91% of 18Lin–CD34– cells transplanted) (Fig. 7A, B).
Human hematopoietic cell reconstitution in NOG mice. Human CB-derived 18Lin-CD34+ or 18Lin-CD34- cells were cocultured with mouse BM-MSCs (mBM-MSCs) or DPSCs (mDPSCs) for 1 week in the presence of a cocktail of cytokines. Then, the cocultured cells were recovered and injected into the left tibia of nonobese diabetic/severe combined immunodeficient/interleukin 2 receptor γ chain knockout (NOD/Shi-scid/IL-2Rγcnull; NOG) mice by IBMI. The human CD45+ cell rates in the contralateral sites of injection of recipient mice were analyzed by the aspiration method 20 weeks after transplantation by flow cytometry. The upper graph (A) shows the repopulation levels of mice that received 18Lin–CD34+ cells cultured under feeder-free conditions and cocultured with BM-MSCs or DPSCs. The lower graph (B) shows the repopulation levels of mice that received 18Lin-CD34- cells cultured under feeder-free cultures or cocultured with BM-MSCs or DPSCs. In the feeder-free condition, (A) one of six mice or (B) two of six mice that received transplants of cultured 18Lin-CD34+ or 18Lin-CD34- cells were successfully engrafted. (A) Six of six mice and (B) four of five mice that received the 18Lin-CD34+ or 18Lin-CD34- cells cocultured with mouse BM-MSCs were engrafted, and (A) four of six mice and (B) six of six mice that received the 18Lin-CD34+ or 18Lin-CD34- cells cocultured with mouse DPSCs were engrafted. The bars represent the median human CD45+ cell rates of recipient mice. The statistical significance of differences was calculated using the Mann–Whitney U test with Bonferroni correction; n.s. means no significant difference (p > 0.05).
All of the recipient mice were euthanized 28 weeks after transplantation, and the human cell repopulations in the mouse BM were finally analyzed. As a result, the transplanted 18Lin-CD34+ or 18Lin-CD34- cells cocultured with mouse BM-MSCs or DPSCs showed distinct multi-lineage human cell repopulation. As shown in Figure 8, both the CD34+ and CD34- SRCs cocultured with BM-MSCs or DPSCs generated CD34+ stem/progenitor cells (Fig. 8A–D-a), B-lymphoid (CD19+) (Fig. 8A–D-b), myeloid (CD33+) (Fig. 8A–D-c), monocytic (CD14+; data not shown), megakaryocytic (CD41+; data not shown), and erythroid lineage cells (CD235a+; data not shown). These data suggest that the HSC-supporting potential of BM-MSCs and DPSCs is comparable.
Long-term multilineage reconstitution of human CB-derived 18Lin-CD34+ or 18Lin-CD34- cells cocultured with mouse DPSCs or BM-MSCs. All of the human cell-engrafted mice were analyzed 28 weeks after transplantation, and representative FACS profiles of human cell repopulation in the mouse BM are shown. (A) Human 18Lin-CD34+ cells cocultured with mouse DPSCs, (B) human 18Lin-CD34+ cells cocultured with mouse BM-MSCs, (C) human 18Lin-CD34- cells cocultured with mouse DPSCs, and (D) human 18Lin-CD34- cells cocultured with mouse BM-MSCs, 28 weeks after transplantation. The human CD45+ cells were gated as R1. The expression of surface markers, including CD34 (a), CD19 (b), and CD33 (c) on the R1-gated cells was analyzed by six-color FCM. The percentages of positive cells in each scattergram (CD19, CD33, and CD34) are presented in the upper right corner.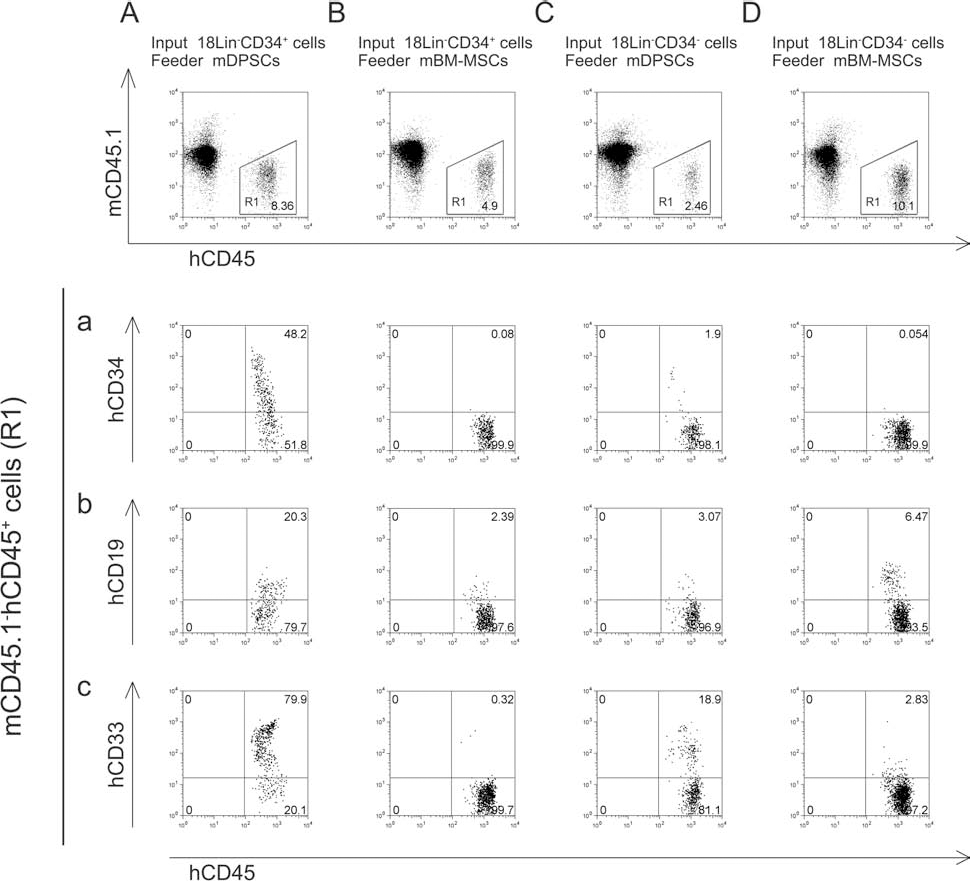
Discussion
It is well documented that BM-MSCs likely contribute to the formation of the hematopoietic niche, which can support HSCs in an undifferentiated state in the BM. On the other hand, several studies reported that MSC-like cells can be established from nonhematopoietic tissues, including adipose tissue (44). In this study, we successfully identified and isolated novel DPSCs using MSC markers, such as PDGFRα and Sca-1. The PDGFRα+ Sca-1+ DPSCs resembled PDGFRα+Sca-1+ BM-MSCs in their expression pattern of cell surface markers specific for MSCs, except for CD49f and CD71. We could not detect the expression of CXCR4 on DPSCs and BM-MSCs. On the other hand, several studies reported that BM-MSCs expressed CXCR4 on their cell surfaces (15,33). It is well documented that CXCR4 binds stromal cell-derived factor 1 (SDF-1) and is internalized but is recycled to the cell surface in the absence of SDF-1 (1). Previously, we reported that mouse HSCs [c-kit+Sca-1+ Lineage– (KSL) cells] freshly isolated from BM expressed very low to undetectable levels of CXCR4 but upregulated the receptor expression within 2 h of incubation in vitro (35). Therefore, it is conceivable that CXCR4 could be internalized in freshly isolated DPSCs and MSCs as they were in KSL cells. In addition, the PDGFRα+Sca-1+ DPSCs expressed the putative HSC maintenance genes, including Notch1, 3, Lfng, Angpt, and Nestin. Moreover, they expressed higher levels of the Jag1 and Cxcl12 genes compared to BM-MSCs. As shown in the Results section, human CB-derived 18Lin-CD34+ and 18Lin–CD34– cells cocultured with DPSCs showed the maintenance/production of CD34+ cells in vitro. These cocultured cells also showed distinct SRC activities for 28 weeks after transplantation into NOG mice. Therefore, these data clearly demonstrated that PDGFRα+Sca-1+ DPSCs have the potential to support human HSPCs in vitro.
Morikawa and colleagues reported that undifferentiated and proliferative PDGFRα+Sca-1+ BM-MSCs can be prospectively isolated by FACS (21,22). Likewise, we isolated DPSCs by FACS using the same markers as were used for the BM-MSCs. However, as shown in this study, the PDGFRα+Sca-1+ DPSCs expressed CD49f and CD71, while PDGFRα+Sca-1+ BM-MSCs did not express these markers. Furthermore, the expression levels of CD90, CD105, and PDGFRβ were different between these two types of MSCs. In addition, these MSCs showed different CFU-F activity and alkaline phosphatase activity in primary culture. These results suggest that the functional characteristics of these two types of MSCs are different.
Concerning the potential of these nonhematopoietic tissue-derived cells to support HSCs, some studies showed that ADSCs can support CD34+ human HSCs in vitro, and the supported cells could be engrafted into immunodeficient mice (24,26). In this study, we demonstrated, for the first time, that our newly established DPSCs can support human CB-derived CD34+, as well as CD34- SRCs (HSCs). A previous study reported that ADSCs support CD34+ HSCs better than BM-MSCs (24,26). On the other hand, our study demonstrated that DPSCs and BM-MSCs showed almost the same supporting potential for CD34+ and CD34- SRCs. These findings suggested that BM-MSCs and MSC-like cells, which are established from various nonhematopoietic tissues, can all support HSCs, but may provide different degrees of support for HSCs.
From another point of view, it was reported that nestin+ BM-MSCs were involved in supporting CD34+ HSCs in the BM (18). This report also showed that suppression of the number of HSCs and inhibition of the migration of HSCs into the BM occurred following the conditional knockout of nestin+ cells in the BM. On the other hand, our present study showed that DPSCs have the potential to support CD34+ and CD34- HSCs in vitro. The real time RT-PCR analysis showed that the expression level of Nestin in DPSCs was comparatively higher than that in BM-MSCs. However, the 18Lin-CD34+ and 18Lin-CD34- cells cocultured with DPSCs showed comparable SRC activity to those cocultured with BM-MSCs. These observations suggested that the nestin gene expression alone cannot predict the HSC-supportive activity of DPSCs. Further studies will be required to clarify the molecular mechanisms involved in the HSC-supporting activity of DPSCs.
In this study, we succeeded in prospectively isolating DPSCs from mouse incisors using BM-MSC markers, such as PDGFRα and Sca-1. Besides mouse incisors, human extracted teeth have been suggested to also be a source of stem or progenitor cells. Many studies have so far reported the existence of human dental tissue-derived stem cells, such as human DPSCs (5), stem cells from human exfoliated deciduous teeth (SHED) (20), periodontal ligament stem cells (36), stem cells from the apical papilla (SCAP) (37,38), dental follicle progenitor cells (23), and tooth germ progenitor cells (TGPCs) (6). These reported human dental tissue-derived stem/progenitor cells have similarities to mouse DPSCs and mouse/human BM-MSCs. Collectively, these observations suggest that human DPSCs and other human dental tissue-derived stem cells can support human HSCs. In summary, this study demonstrated, for the first time, that prospectively isolated PDGFRα and Sca-1 double-positive DPSCs can support human CB-derived primitive CD34+ and CD34- HSCs in vitro.
Footnotes
Acknowledgment
This work was supported by Grants-in-Aid for Young Scientists B (Grant Nos. 21791958 and 23792304) and Scientific Research C (Grant Nos. 21591251 and 24591432) from the Ministry of Education, Culture, Sports, Science and Technology (MEXT) of Japan; a grant from the Science Frontier Program of the MEXT; a grant from the Strategic Research Base Development program for Private Universities from the MEXT; MEXT-Supported Program for the Strategic Research Foundation at Private Universities; a grant from the Promotion and Mutual Aid Corporation for Private Schools of Japan; a grant from the Japan Leukemia Research Foundation; a grant from the Mitsubishi Pharma Research Foundation; a grant from the Takeda Science Foundation; a grant from the Terumo Life Science Foundation; and a grant from SENSHIN Medical Research Foundation. A grant for Young Scientists B was given to R.N., and all other grants were awarded to Y.S. We are grateful to the Japanese Red Cross Kinki Cord Blood Bank for providing the samples used in this study. Kyowa Kirin Company (Tokyo, Japan) is also acknowledged for providing the various growth factors used in this study. The authors declare no conflicts of interest.