
Abstract
Pluripotent stem cells, including human embryonic stem cells (hESCs) and induced pluripotent stem cells (hiPSCs), have been regarded as useful sources for cell-based transplantation therapy. However, immunogenicity of the cells remains the major determinant for successful clinical application. We report the examination of several hESC lines (NTU1 and H9), hiPSC lines, and their derivatives (including stem cell-derived hepatocytes) for the expression of major histocompatibility complex (MHC), natural killer (NK) cell receptor (NKp30, NKp44, NKp46) ligand, immune-related genes, human leukocyte antigen (HLA) haplotyping, and the effects in functional mixed lymphocyte reaction (MLR). Flow cytometry showed lower levels (percentages and fluorescence intensities) of MHC class I (MHC-I) molecules, β2-microglobulin, and HLA-E in undifferentiated stem cells. The levels were increased after cotreatment with interferon-γ and/or in vitro differentiation. Antigen-presenting cell markers (CD11c, CD80, and CD86) and MHC-II (HLA-DP, -DQ, and -DR) remained low throughout the treatments. Recognition of stem cells/derivatives by NK lysis receptors were lower or absent. Activation of responder lymphocytes was significantly lower by undifferentiated stem cells than by allogeneic lymphocytes in MLR, but differentiated NTU1 hESCs induced a cell number-dependent lymphocyte proliferation comparable with that by allogeneic lymphocytes. Interestingly, activation of lymphocytes by differentiated hiPSCs or H9 cells became blunted at higher cell numbers. Real-time reverse transcriptase PCR (RT-PCR) showed significant differential expression of immune privilege genes (TGF-β2, Arginase 2, Indole 1, GATA3, POMC, VIP, CALCA, CALCB, IL-1RN, CD95L, CR1L, Serpine 1, HMOX1, IL6, LGALS3, HEBP1, THBS1, CD59, and LGALS1) in pluripotent stem cells/derivatives when compared to somatic cells. It was concluded that pluripotent stem cells/derivatives are predicted to be immunogenic, though evidence suggests some level of potential immune privilege. In addition, differential immunogenicity may exist between different pluripotent stem cell lines and their derivatives.
Keywords
Introduction
Human embryonic stem cells (hESCs) (10,35) and human induced pluripotent stem cells (hiPSCs) (40) are pluripotent stem cells, capable of maintaining self-renewal and differentiating into all cell lineages. In recent years, there has been a growing interest in deriving cells from pluripotent stem cells for cell-based transplantation therapy (13). However, some obstacles remain to be overcome before these cells can become clinically applicable. Firstly, it is known that the major histocompatibility complex [MHC; known as human leukocyte antigen (HLA) in humans] is the major determinant of immunogenicity for transplantation. The donor cells can be grafted for long periods only when they are HLA matched with the recipient. In addition, the practical strategies of using hESC- or hiPSC-derived cells for transplantation likely will be the use of stem cell banks, which can provide multiple cell lines for HLA matching (29,34). Therefore, in order to reduce the complex problems of prolonged immune suppressants needed in cases with imperfect HLA match, it is necessary to analyze the immune responses that may occur after transplantation of stem cell-derived progeny. Previous studies have provided some information on this issue (3–5,18,21,23,29,33). However, reports on hiPSCs and the comparison between multiple stem cell lines are scarce. This study therefore aimed to examine the immunogenicity of several hESC and hiPSC lines and their derivatives, including pluripotent stem cell-derived hepatocyte-like cells (24). The data from this report suggest that derivatives of hESCs or hiPSCs likely will induce an immune response, although characteristics of immune privilege could occur through lower expression levels of MHC, antigen-presenting cells, and the modulation of immune privilege genes.
Materials and Methods
Pluripotent Stem Cell Culture, Differentiation, and Treatment
The protocols of pluripotent stem cell culture were modified from previous reports (8–10,29). Several pluripotent stem cell lines were used, including NTU1 hESCs (karyotype 46, XX) derived by us (10), H9 hESCs (karyotype 46, XX; WiCell, WI, USA) (35), and hiPSCs derived by us (iGra1, iGra2, iDPC3, iCFB46, and iCFB50; see below). The pluripotent stem cells had been frozen and thawed periodically, while being continuously maintained on mouse embryonic fibroblasts (MEFs; Laboratory Animal Center, National Taiwan University, Taipei, Taiwan) using ReproCELL serum-free medium (ReproCELL, Shinyokohama, Japan). The cells were split weekly using 30-gauge insulin needles (Terumo Medical Corporation, Tokyo, Japan) or by 1 mg/ml dispase and 1 mg/ml collagenase type IV (both Gibco, Gaithersburg, MD, USA) according to the previous protocols (9,10,22). For in vitro differentiation, colony pieces were put evenly on gelatinized dishes (Sigma, St. Louis, MO, USA) without MEFs and cultured using Dulbecco's modified Eagle's medium (DMEM) plus 15% fetal bovine serum (FBS; Gibco). The medium was changed every 3 days, and the cells were collected at predetermined time points. The details about stem cell-derived hepatocytes have recently been published by us (24), in which the progressive differentiation of stem cell-derived hepatocytes and the expression of hepatocytespecific markers in comparison to normal hepatocytes were included. The stem cells were also treated with interferon-γ (IFN-γ; 25 ng/ml for 48 h; Sigma) before or after differentiation in some experiments.
Preparation and Culture of Somatic Cells
Human somatic cells, peripheral blood mononuclear cells (PBMCs; from six female voluntary donors, ranging from 28 to 32 years old), and donor cells for hiPSC production, including dermal papilla cells (parental cells of iDPC3; adult female origin, 32 years old), foreskin fibroblast cells (parental cells of iCFB46 and iCFB50; adult male origin, 29 years old), and granulosa cells (parental cells of iGra1 and iGra2; from ovarian aspirates described below) were used in this study. Human skin fibroblasts and dermal papilla cells were expanded on gelatin-coated culture dishes using human fibroblast medium: a modified minimum essential medium (MEM-α; Gibco) supplemented with 10% FBS (Gibco) until confluency and then collected for further study. Human granulosa cells were obtained from ovarian follicular aspirates during oocyte retrieval in in vitro fertilization programs conducted in the National Taiwan University Hospital. Briefly, cell pellets from different patients (32–37 years old) were pooled and centrifuged at 400 × g for 10 min. The cells were first resuspended in Dulbecco's phosphate-buffered saline (DPBS; Life Technologies Corp., Grand Island, NY, USA), layered on 50% Ficoll–Paque (GE Healthcare, Little Chalfont, Buckinghamshire, UK), and centrifuged at 400 × g for 30 min until red blood cells formed a pellet. The cells at the Ficoll–plasma interface were collected by a Pasteur pipette (Volac, Royston, Hertfordshire, UK) and washed three times with DPBS. The cells were then plated onto a culture flask with culture medium [90% Roswell Park Memorial Institute (RPMI)-1640 supplemented with 10% FBS, 100 U/ml penicillin, and 100 μg/ml streptomycin; all the above were from Gibco] and incubated at 37°C in a 5% CO2 humidified air environment. Human PBMCs from different donors were separated for the study. The preparation and culture of PBMCs are described in the Mixed Lymphocyte Reaction section. Additional cells include the JEG-3 cell line (ATCC HTB-36; female placental epithelial choriocarcinoma), placentaltrophoblasts (female, three donors aged 29, 32, and 34 years old), antigen-presenting cells (APCs; female, three donors aged 28, 30, and 31 years old), and the HeLa cell line (ATCC CCL-2; female). These cells were either collected from voluntary donors or commercially purchased from Academia Sinica Taiwan (Taipei, Taiwan). The use of the above human cells was approved by the Internal Research Board of Academia Sinica and the Ethical Committee of National Taiwan University Hospital. Informed consents were obtained from all involved subjects.
Flow Cytometry and HLA Haplotyping
The MHC profiling (MHC class I, II, and nonclassical MHC molecules) of pluripotent stem cells was analyzed by flow cytometry using modified protocols from a previous report (8). All the primary antibodies were used at 1:10 dilutions, and secondary antibodies were used at 1:200 dilutions. The antibodies included HLA class I (HLA-I; mAb W6/32; BioLegend, San Diego, CA, USA), HLA class II (HLA-II; antihuman HLA-DP, -DQ, -DR; Dako, Carpinteria, CA, USA), HLA-E (3D12; BioLegend), HLA-G (nonclassical MHC-I; 87G; BioLegend), β2-microglobulin (2M2; BioLegend), and markers for APCs [cluster of differentiation 11c (CD11c), CD80, CD86; BD Biosciences Pharmingen, San Jose, CA, USA]. Appropriate secondary antibodies were used including goat anti-rat IgG (Alexa Fluor 488; Jackson ImmunoResearch, West Grove, PA, USA) and goat anti-mouse IgG (Alexa Fluor 488; Jackson ImmunoResearch). As negative controls, the cells were stained with appropriate isotype-matched controls. Natural killer (NK) cell receptor ligand (ligands for NKp30, NKp44, and NKp46) expression was examined using recombinant fusion proteins including human NKp30/natural cytotoxicity-triggering receptor 3 (NCR3) Fc Chimera (NKp30 Ig; R&D Systems, Minneapolis, MN, USA; 1849-NK), human NKp44/NCR2 Fc Chimera (NKp44 Ig; R&D Systems; 2249-NK), and human NKp46/ NCR1 Fc Chimera (NKp46 Ig; 1850-NK; R&D Systems). Secondary antibody [PE-conjugated F(ab')2 goat antihuman IgG, Fc γ; Jackson ImmunoResearch] was used to recognize the fusion proteins. A FACSCalibur Flow Cytometer (BD Biosciences, San Jose, CA, USA) was used for flow cytometry, and the acquired data were analyzed using WinMDI 2.9 software (The Scripps Institute, Flow Cytometry Core Facility, La Jolla, CA, USA). HLA haplotyping was examined by an AlleleSEQR HLA-sequencing kit (Abbott, Chicago, IL, USA) and analyzed using the allele identification software (Conexio Genomics, Applecross, Australia).
Real-Time RT-PCR
Real-time RT-PCR was performed to examine the expression of IFN-γ receptors (IFN-γ-R1 and IFN-γg-R2) and the selected immune genes in the pluripotent stem cells/derivatives and somatic cells. TaqMan Gene Expression Assays System (Applied Biosystems, Grand Island, NY, USA) was used, and the primers and probes Assay ID are listed in Table 1. Briefly, at predetermined time points, cells were collected and treated with RLT lysis buffer (Qiagen, Valencia, CA, USA) to harvest total RNA. cDNA was prepared by random hexamer primers, and the synthesis was carried out using SuperScript III One-Step RT-PCR kit (Invitrogen) according to the manufacturer's instructions. The PCR conditions were designed according to the manufacturer's protocol (Applied Biosystems). The relative concentration of each mRNA was calculated using the ΔΔCT method according to the earlier reports (11,12).
TaqMan Primers and Probe Assay ID (Applied Biosystems) of the Genes Used in Real-Time RT-PCR

GATA, guanine–adenine–thymine–adenine-binding protein; CD, cluster of differentiation.
Mixed Lymphocyte Reaction (MLR)
An MLR assay was used to evaluate the stimulation of pluripotent stem cells/derivatives on allogeneic and syngeneic T-cell proliferation. The “lymphocytes” described in this section were human PBMCs isolated from healthy volunteers, and these cells were used as the sources of enriched responder lymphocytes. Two hESC (NTU1 and H9), two hiPSC (iGra2 and iCFB50) lines, or PBMCs were used as the source of stimulator lymphocytes. These stem cells were tested both in their undifferentiated states and after spontaneous in vitro differentiation for 15 days in adherent culture. Briefly, PBMCs were isolated by Ficoll-Paque separation (1.077 g/cm3; Amersham Bioscience, Pittsburgh, PA, USA) and washed three times with complete culture medium (CCM: RPMI-1640 medium supplemented with L-glutamine, penicillin/streptomycin, HEPES, and 10% FBS; all the above products from Gibco). Stem cells (0.25, 0.5, 1, or 10 × 104) and control stimulator lymphocytes (syngeneic and allogeneic origins) were treated with mitomycin-C (Sigma) before coculture with responder lymphocytes. For evaluation of undifferentiated stem cells, the responder PBMCs were cultured with mitomycin-C-treated stimulator cells in 0.2 ml of CCM in 96-well plates (Costar; Corning, Corning, NY, USA) in humidified air with 5% CO2 for 3 days, then at the end of coculture 5 mg/ml 3-(4,5-dimethylthiazol-2-yl)-2,5-diphenyl tetrazolium bromide (MTT; Life Technologies Corp.) solution was added, and formazan crystal was dissolved in acid-isopropanol. Optical density was measured at 570 nm in a microplate spectrophotometer (SPECTRAmax 340PC384; Molecular Devices, Sunnyvale, CA, USA). For the evaluation of pluripotent stem cell derivatives, 10 μl/well Premix WST-1 (Premix WST-1 Cell Proliferation Assay System; MK400; Takara, Shiga, Japan) was added to the cells cultured in 100 μl/well with CCM (1:10 dilution). After incubation for 2 h at 37°C, optical density was measured at 450 nm in the microplate spectrophotometer. All cultures and examinations were repeated at least in triplicates.
Microarray Analysis
Total RNA (10 μg) purified by Trizol (Invitrogen, Carlsbad, CA, USA) was used for cDNA synthesis and to generate a biotin-labeled cRNA probe, which was hybridized to an Affymetrix GeneChip Human Genome U133 Plus 2.0 Array (Affymetrix, Santa Clara, CA, USA) by the Affymetrix Gene Expression Service Laboratory (Academia Sinica, Taipei, Taiwan). Chips were scanned with an Affymetrix GeneChip Scanner 7G, and GeneSpring X software (Agilent, Santa Clara, CA, USA) was used for data mining. Raw data were normalized by robust multichip average (RMA), and the weakly expressed signals (<20% of total samples) were excluded. The selected genes were clustered by Pearson centered complete clustering. The raw microarray data are available through the Gene Expression Omnibus (GSE27280 and GSE28406; http://goo.gl/ZYpmo).
Statistical Analysis
A Student's t-test, paired t-test, and one-way ANOVA were used where appropriate for statistical analyses in this study. Post hoc tests including Fisher's least significant difference (LSD) and Scheffe method were used after ANOVA. The SPSS statistical package (IBM, Armonk, NY, USA) was used, and a value of p < 0.05 was considered statistically significant.
Results
Microarray Analysis of the MHC Expression
We examined the MHC expression of two hESCs (H9 and NTU1 cells) and five hiPSC lines, respectively, from foreskin fibroblasts (iCFB46 and iCFB50) (24), granulosa cells (iGra1 and iGra2), and dermal papilla cells (iDPC3) (24), by microarray analysis (Fig. 1). The data showed consistently lower levels of MHC-I (HLA-A, HLA-B, HLA-C), HLA-E, HLA-F, HLA-G, and b2-microglobulin in undifferentiated stem cells, when compared to the parental somatic cells (Fig. 1A, B). In contrast, MHC-II levels were low both in somatic cells and undifferentiated pluripotent stem cells and were generally lower than those of MHC-I subtypes (using HLA-B as a control) in somatic cells (Fig. 1C).

Microarray analysis of major histocompatibility complex (MHC) and immune-related gene expression in the undifferentiated pluripotent stem cells. Undifferentiated pluripotent stem cells including human embryonic stem cells (hESCs) and human induced pluripotent stem cells (hiPSCs) and their parental somatic cells, as described in Materials and Methods. (A) Heat map of the MHC expression. (B) Relative levels of classical MHC class I (MHC-I) and nonclassical MHC antigens. (C) Relative levels of MHC class II (MHC-II) antigens in the cells using human leukocyte antigen (HLA)-B (a MHC-I antigen) as a comparison. (D) Heat map of the immune-related gene expression. (E) Relative levels of immune-related genes showing significant differential expression between undifferentiated pluripotent stem cells and somatic cells. DPC, human dermal papilla cells. Foreskin, human foreskin fibroblasts. Granulosa, human granulosa cells. H9 and NTU1, hESCs. iCFB46, iCFB50, iDPC3, iGra2, and iGra3, hiPSCs. B2M, β2-microglobulin; HLA, human leukocyte antigen. See Table 1 for definition of genes.
Flow Cytometric Analysis of HLA Molecules in Pluripotent Stem Cells Before and After Differentiation
Moderate to high percentages of pluripotent stem cells expressed b2-microglobulin (88–93%) and HLA-I molecules (49–84%) in the undifferentiated state, compared to those of human granulosa cells (99%). However the fluorescence intensities were much lower in pluripotent stem cells (e.g., b2-microglobulin: 37–57 vs. 294, stem cells vs. granulosa cells) (Fig. 2 and Table 2). For both stem cells and granulosa cells, the percentages were low for HLA-II (0.7–1.3%), HLA-E (4.4–7.9%), HLA-G (2.1–4.4%), and the marker for APCs (CD11c, 2.2–2.9%) (Fig. 2 and Table 2). Other APC markers were also low (CD80, 0.3–0.8%, and CD86, 1.3–3.1%). Positive controls (including JEG-3 cells, placental trophoblasts, and APCs) for the expression of HLA-II, HLA-E, HLA-G, and APC markers have been incorporated in the study to confirm the technical validity and differences of expression (data not shown). No significantly different expression levels of HLA-related molecules were found between the three cell lines (NTU1, iCFB50, and iGra2 cells), except for the HLA-I molecule that was significantly different between the NTU1 and iGra2 cells (p < 0.05; Tukey's post hoc test; Table 2). After spontaneous differentiation, consistent trends were found showing slightly decreased percentages of cells expressing β2-microglobulin and HLA-I on day 15 (compared to undifferentiated cells and day 7 differentiation), and then values returned on day 30 to the day 7 level or higher for NTU1 and iCFB50 cells (Fig. 3 and Tables 3 and 4). For example, HLA-I in NTU1 cells was 84%, 56%, 29%, and 43%, respectively, on days 0, 7, 15, and 30 (Fig. 3 and Table 3). Although maintaining good self-renewal, iGra2 cells were not consistently stable for further evaluation on day 30 of differentiation, and therefore only days 0, 7, and 15 data were presented (Table 5). The hESC-derived hepatocyte-like cells at various developmental stages [in vitro differentiation stage 2 (IVDS2, cells collected on day 9 of differentiation) to stage 3 (IVDS3, cells collected on day 30 of differentiation)] showed a pattern of MHC expression similar to those of mixed cellular populations of spontaneously differentiated NTU1 cells, except for a slightly higher CD80 expression (e.g., 3.1% vs. 5.6% in day 30 differentiated NTU1 cells vs. day 30 hepatocyte-like cells) (Fig. 4 and Table 3). The stages of hepatocyte-like cell differentiation from stem cells were based on the previous report (24). The percentages of cells expressing HLA-II, HLA-G, and HLA-E remained low even after differentiation for 30 days in these cell lines (Tables 3–5). The APC marker was increased slightly after differentiation of NTU1 hESCs in CD80 (0.7% vs. 3.1–3.6%, undifferentiated vs. differentiated) (Table 3).

Flow cytometric analysis of classical and nonclassical major histocompatibility complex (MHC) molecules, β2-microglobulin, and antigen-presenting cell marker (CD80, CD11c, CD86) in undifferentiated pluripotent stem cells. Undifferentiated pluripotent stem cells include human embryonic stem (hESCs: NTU1) and human induced pluripotent stem (hiPSCs: iCFB50 and iGra2 cells), and somatic cells (granulosa cells), as described in Materials and Methods. The percentage shown in the images indicate the percentage of cells expressing the molecule. The number following the percentage indicates the median fluorescence intensities. The experiments were repeated for at least three to five times.

Flow cytometric analysis of classical and nonclassical major histocompatibility complex (MHC) molecules, β2-microglobulin, and antigen-presenting cell markers (CD11c, CD80, CD86) in the differentiated human embryonic stem cells (hESCs) (NTU1 cells) after in vitro differentiation for 7–30 days. The percentages shown in the images indicate the percentages of cells expressing the specific molecule. The numbers following the percentages indicate the median fluorescence intensities. The experiments were repeated at least three to five times.
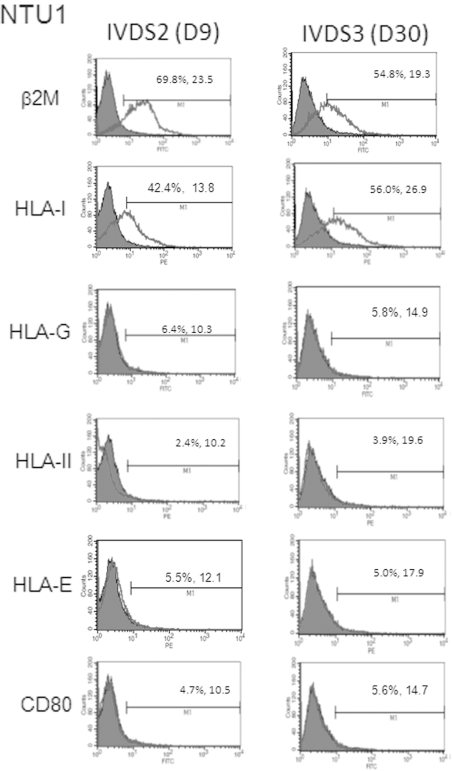
Flow cytometric analysis of classical and nonclassical major histocompatibility complex (MHC) molecules, β2-microglobulin, and antigen-presenting cell marker (CD80) in the human embryonic stem cells after in vitro differentiation for 9–30 days toward hepatic lineage (stem cell-derived hepatocytes), according to the protocols described in Materials and Methods. IVDS2, in vitro differentiation stage 2 (on day 9 of directed differentiation toward hepatic lineage). IVDS3, in vitro differentiation stage 3 (on day 30 of directed differentiation, indicating mature hepatocytes). The percentages shown in the images indicate the percentages of cells expressing a specific molecule. The numbers following the percentages indicate the median fluorescence intensities. The experiments were repeated at least three to five times.
Flow Cytometric Analysis of Major Histocompatibility Complex (MHC)-Related Molecules and Antigen-Presenting Cell Markers in Undifferentiated Human Embryonic Stem Cells (hESCs: NTU1 Cells) and Human Induced Pluripotent Stem Cells (iCFB50 and iGra Cells)

The data are shown as mean ± SD. β2M, β2-microglobulin; HLA, human leukocyte antigen.
The statistical significance among the groups of cells, including NTU1 cells, iCFB50 cells, and iGra2 cells (one-way ANOVA).
p < 0.05 (post hoc analysis using Turkey's range test). Within a row, values with the same letter are significantly different from each other.
Flow Cytometric Analysis of MHC-Related Molecules in Human Embryonic Stem Cells (NTU1 Cells) After In Vitro Differentiation for 7–30 Days

The data are shown as mean ± SD.
The statistical significance among the groups of cells, including day 0, day 7, day 15, and day 30 NTU1 hESCs (one-way ANOVA).
p < 0.05 (post hoc analysis using Turkey's range test). Within a row, values with the same letter are significantly different from each other.
Flow Cytometric Analysis of MHC-Related Molecules in Human Induced Pluripotent Stem Cells (iPSCs: iCFB50 cells) After In Vitro Differentiation for 7–30 Days

The data are shown as mean ± SD.
The statistical significance among the groups of cells, including day 0, day 7, day 15, and day 30 iCFB50 hiPSCs (one-way ANOVA).
p < 0.05 (post hoc analysis using Turkey's range test). Within a row, values with the same letter are significantly different from each other.
Flow Cytometric Analysis of MHC-Related Molecules in Human Induced Pluripotent Stem Cells (iGra2 Cells) After In Vitro Differentiation for 7–15 Days

The data are shown as mean ± SD.
The statistical significance among the groups of cells, including day 0, day 7, and day 15 iGra2 hiPSCs (one-way ANOVA).
p < 0.05 (post hoc analysis using Turkey's range test). Within a row, values with the same letter are significantly different from each other.
MHC Expression After IFN-γ Treatment
Real-time PCR showed that pluripotent stem cells expressed significantly lower IFN-γ-R1 (IFN-γ receptor 1) (p < 0.001) but similar IFN-γ-R2 levels compared to foreskin fibroblasts (Fig. 5A), suggesting that these stem cells might be responsive to IFN-γ. The response to IFN-γ was further demonstrated by flow cytometry, showing increased percentages of cells with enhanced fluorescence intensities producing HLA molecules (HLA-I, β2-microglobulin, and HLA-E) before differentiation (Fig. 6A). After IFN-γ treatment of undifferentiated stem cells, the expression was enhanced for HLA-I (e.g., iGra2 cells: 64.3% vs. 96.7%, without vs. with IFN-γ treatment) and HLA-E (iCFB50 cells: 5.3% vs. 48.4%) (Figs. 2 and 6A). Similar trends of response to IFN-γ were also found in stem cells after in vitro differentiation for 7–30 days (Fig. 6B–D). For each experiment, flow cytometric analyses were repeated at least three to five times.

Real-time RT-PCR analysis of the expression of interferon-γ (IFN-γ) receptors and selected immune-related genes in the pluripotent stem cells under various conditions. Real-time RT-PCR analysis of the expression of IFN-γ receptors (IFN-γ-R1 and IFN-γ-R2) (A) and the selected immune-related genes (B-Z1) in the human embryonic stem cells (NTU1 and H9) and human induced pluripotent stem cells (iGra2 and iCFB50) (before or after differentiation and without or with IFN-γ treatment), and the parental somatic cells (human granulosa cells, foreskin fibroblasts, and dermal papilla cells), as described in Materials and Methods. Glyceraldehyde 3-phosphate dehydrogenase (GADPH) was used as the internal control for quantitation in these plots. The bars represent mean ± SD. +IFN-γ, cotreatment with IFN-γ for 48 h. -IFN-γ, without IFN-γ cotreatment. The legends for B-Z1 are the same and are representatively put in C, E, I, J, O, P, S, X. The p values (statistical significance) between treatments are shown for some points of comparison. The experiments were repeated at least three to five times. *p < 0.05, **p < 0.01, ***p < 0.001. See Table 1 for gene abbreviations.

Flow cytometric analysis of classical and nonclassical major histocompatibility complex (MHC) molecules, β2-microglobulin, and antigen-presenting cell marker (CD11c, CD80, CD86) in the human pluripotent stem cells under interferon and/ or differentiating conditions. Flow cytometric analysis of classical and nonclassical major histocompatibility complex (MHC) molecules, β2-microglobulin, and antigen-presenting cell marker (CD11c, CD80, CD86) in the hESCs (NTU1) and hiPSCs (iCFB50 and iGra2) under cotreatment with interferon-γ (IFN-γ; 25 ng/ml) for 48 h, before (A) and after (B–D) differentiation for 7–30 days, as described in Materials and Methods. (A) Undifferentiated NTU1, iCFB50, and iGra2 cells. (B) Differentiated NTU1 hESCs. (C) Differentiated iGra2 hiPSCs. (D) Differentiated iCFB50 hiPSCs. The percentages shown in the images indicate the percentages of cells expressing the specific molecule. The numbers following the percentages indicate the median fluorescence intensities. The experiments were repeated at least three to five times.
NK Receptor Ligand Expression in Pluripotent Stem Cells Before and After Differentiation
Flow cytometric analysis showed the expression of NKp44-Ig in pluripotent stem cells before and after differentiation but with lower percentages than that of HeLa cells (Fig. 7 and Table 6). The percentages of cells expressing NKp46-Ig and NKp30-Ig were generally low in stem cells and their derivatives (Fig. 7 and Table 6).

Flow cytometric analysis of natural killer (NK) cell receptor specific ligands (ligands for NKp44, NKp30, and NKp46) expression in undifferentiated and differentiated (for 7–30 days) hESCs (NTU1), hiPSCs (iCFB50, iGra2), and HeLa cells, as described in Materials and Methods. (A) Undifferentiated NTU1, iCFB50, iGra2, and HeLa cells. (B) Differentiated NTU1 hESCs. The percentages shown in the images indicate the percentages of cells expressing the specific molecule. The numbers following the percentages indicate the median fluorescence intensities. NTU1D7, day 7 differentiated NTU1 hESCs. The experiments were repeated for at least three to five times.
Flow Cytometric Analysis of Natural Killer (NK) Cell Receptor Specific Ligands (Ligands for NKp44, NKp30, and NKp46) Expression in Undifferentiated and Differentiated (for 7–30 Days) Human Embryonic Stem Cells (NTU1 hESCs), Human Induced Pluripotent Stem Cells (iCFB50, iGra2 hiPSCs), and HeLa Cells

The data are shown as mean ± SD.
The statistical significance among the groups of cells, including day 0, day 7, day 15, and day 30 stem cells (NTU1, iCFB50, and iGra2 cells), and HeLa cells (one-way ANOVA).
p < 0.05 (post hoc analysis using Turkey's range test). Within a row, values with the same letter are significantly different from each other.
HLA Haplotyping in the Three Pluripotent Stem Cell Lines
In order to confirm that MHC antigens are actually expressed in the stem cells that we used for this study, we examined the HLA haplotyping of three cell lines, NTU1, iGra2, and iCFB50. The data showed wide variations of HLA haplotypes of different cell lines (Table 7). No completely similar haplotypes in the tested loci were shared by any two cell lines. However, when the criteria of similarity are loosened, it is found that B*58 and C*07 are shared by two cell lines, respectively.
HLA Haplotyping of One Human Embryonic Stem Cell (NTU1 hESCs) and Two Human Induced Pluripotent Stem Cells (iGra2 and iCFB50 hiPSCs) Examined by PCR

Note: MHC class I (MHC-I; HLA-A, HLA-B, and HLA-C) and class II (MHC-II; HLA-DRB, and -DQB).
Expression of Immune-Related Genes by Microarray and Real-Time RT-PCR
By microarray analysis of the 75 immune-related genes, we observed that several were significantly downregulated [transforming growth factor (TGF)-β1, TGF-β2, TGF-β3, Serpine1, heme oxygenase 1 (HMOX1), cystatin A (CSTA), interleukin (IL)-6, lectin, galactoside-binding soluble 3 (LGALS3), heme-binding protein 1 (HEBP1), and CD59], and others were upregulated [arginase 2, Indole1 (IDO1), guanine–adenine–thymine–adenine-binding protein 3 (GATA3), and embigin homolog (EMB)] in undifferentiated pluripotent stem cells (Fig. 1D, E). We also identified an upregulation of GATA3 gene in the hiPSC lines (iDPC3, iCFB46, and iCFB50), but not in the others [H9 and NTU1 (hESCs), iGra1, and iGra2 (hiPSCs)], suggesting differential expression in different cell lines (Fig. 1D, E). Real-time PCR was performed for the differentially expressed genes depicted by microarray analysis and a number of immunologically important genes such as the ocular immune privilege genes (31). For this purpose, undifferentiated and differentiated (for 15 days) pluripotent stem cells were cultured with or without IFN-γ treatment and subsequently examined. We showed that microarray data were generally compatible with those by real-time PCR (Figs. 1 and 5). The expression levels in 14 of the 26 tested genes by real-time PCR were significantly lower (e.g., TGF-β1; Fig. 5B) and eight significantly higher (e.g., Arginase 2; Fig. 5K) in some undifferentiated stem cells when compared to somatic cells (Fig. 5). We also observed that most low expression level genes were upregulated after in vitro differentiation to the levels close to [TGF-β1, TGF-β3, Serpine1, CSTA, interleukin 1 receptor antagonist (IL-1RN), CD55] or over (TGF-β2, CD46, CD95L) those of somatic cells. However, this trend was not universal, since the levels of several genes [HOMX1, IL-6, LGALS3, HEBP1, thrombospondin 1(THBS1), LGALS1, CD59] did not increase after in vitro differentiation and/or IFN-γ treatment. Several tested genes were already highly expressed in the undifferentiated stem cells [Arginase 2, Indole 1, EMB, proopiomelanocortin (POMC), calcitoninrelated polypeptide a (CALCA), CALCB, complement component (3b/4b) receptor 1-like (CR1L)] or were upregulated after in vitro culture [GATA3, vasoactive intestinal peptide (VIP)] to higher levels than somatic cells. Similarly, the effects of in vitro differentiation and/or IFN-γ treatment differed between different pluripotent stem cells. For example, IL-6 increased significantly over the levels observed in parental somatic cells in differentiated iGra2 hiPSCs, but not in NTU1, H9, and iCFB50 cells (p < 0.001) (Fig. 5H). The study showed significant effects of IFN-γ treatment on the expression of several genes [Indole 1, GATA3, EMB, CALCA, CALCB, macrophage migration inhibitory factor (MIF), IL-1RN, CD95L, CR1L], but mostly for only part of the tested cell lines, especially iGra2 cells. In most others, the effect of short-term IFN-γ treatment was not as apparent as the effects of in vitro differentiation. Taken together, most of the tested genes were significantly different in expression levels between differentiated stem cells and somatic cells. These include generally upregulated genes: TGF-β2, Arginase 2, Indole 1, GATA3, POMC (α-MSH), VIP, CALCA, CALCB, IL-1RN, CD95L, and CR1L and some downregulated genes: Serpine 1, HMOX1, IL6, LGALS3, HEBP1, THBS1, CD59, and LGALS1 in differentiated pluripotent stem cells.
Mixed Lymphocyte Reaction (MLR)
The syngeneic lymphocyte reaction in MLR (Fig. 8) indicated that both the stimulator and responder lymphocytes were from the same cell donor. For allogeneic lymphocyte reaction, the stimulator and the responder lymphocytes were obtained from different cell donors with unmatched HLA. MLR showed comparable levels of responder T-cell proliferation by undifferentiated pluripotent stem cells than that by syngeneic lymphocytes, but significantly lower than that by allogeneic lymphocytes (Fig. 8A). This result suggests potentially lower immunogenicity of undifferentiated stem cells than allogeneic lymphocytes. However, day 15 derivatives of NTU1 hESCs induced a cell number-dependent increase in responder lymphocyte proliferation to the level comparable to allogeneic lymphocytes (Fig. 8B). In contrast, the activation of responder lymphocytes by differentiated hiPSCs (iCFB50 and iGra2 cells) was also higher than by syngeneic lymphocytes. The activation became blunted at higher cell numbers (5 × 10⁴–1 × 10⁵ cells) (Fig. 8B). Significant differences of activation effects could be found between derivatives of different stem cell lines. For example, 1 × 10⁴ hiPSC derivatives (from both iCFB50 and iGra2 cells) induced a significantly higher responder cell proliferation than the same number of NTU1 hESC derivatives (Fig. 8B).

Results of mixed lymphocyte reaction (MLR) by MTT test (A) or the Premix WST-1 Cell Proliferation Assay System (B) to evaluate the action of undifferentiated and differentiated (for 15 days) human pluripotent stem cells on T-cell proliferation. Pluripotent stem cells include hESCs (NTU1) and hiPSCs (iCFB50 and iGra2), as described in Materials and Methods. Syngeneic, syngeneic lymphocytes as the stimulator. Allogeneic, allogeneic lymphocytes as the stimulator. NTU1, iCFB50, iGra2, the respective pluripotent stem cells as the stimulators. NTU1D15, iCFB50D15, iGra2D15, the respective differentiated stem cells (differentiation for 15 days) as the stimulators. OD570, OD450, optical density measured at 570 (MTT) (A) or 450 nm (WST) (B), respectively, by a spectrophotometer (SPECTRAmax 340PC384, Molecular Devices). Results are expressed as mean optical density (OD) ± SD stimulated minus resting. *p < 0.05, **p < 0.01, ***p < 0.001.
Discussion
The classical MHC-I molecules are expressed on all nucleated cells and composed of a heavy chain, interacting with β2-microglobulin, and a nonclassical HLA-E on the cell surface. In contrast, MHC-II molecules are expressed on B lymphocytes, macrophages, and dendritic cells (2,27). Together, the expression of MHC-I and -II antigens on stem cell-derived grafts theoretically will determine the immunological reaction after transplantation (6,29,30,32,33). Previous reports showed that MHC-I molecules were not detected in mouse ESCs (1,17) but were detectable in undifferentiated hESCs at low levels (16,18,19,21,26). However, the expression of MHC-I molecules is increased after differentiation of mouse ESCs (15,38) and hESCs (4,19–21,38). The present study, in more detail, revealed approximately 2–7 orders lower transcript levels of MHC-I, β2-microglobulin, and nonclassical MHC-I in undifferentiated pluripotent stem cells compared to somatic cells. By flow cytometric analysis, although the percentages of cells expressing MHC molecules were only marginally lower in stem cells than somatic cells, the actual levels of MHC-I and β2-microglobulin proteins in stem cells were much lower (1–3 orders). In addition, no further change of both percentages and fluorescence intensities of MHC-I molecules was found after in vitro differentiation, which remained lower than somatic cells. However, we observed consistent changes of β2-microglobulin and MHC-I molecule expression in the differentiated cells, with a down-regulation on day 15 and then an increase thereafter. The mechanism of changes remains unclear. However, since the spontaneously differentiated stem cells were a mixture of many cell types, the fluctuations might result from the changes of cellular subpopulations at different time points. Similar fluctuation in MHC levels was also found in the hESC-derived hepatocytes, which to our knowledge is the first report in literature about the MHC expression in a specific stem cell-derived cell lineage. It was also interesting to find that the percentages of stem cell-derived hepatocytes expressing CD80 molecules were higher than the differentiated cell mixtures. This result may indicate a higher level of APC marker expression in this specific cell lineage, suggesting enhanced immunogenicity, but with unknown clinical significance at present. Taken together, pluripotent stem cells and the derivatives express comparatively lower levels of HLA-I-related molecules than the average somatic cells, suggesting a potentially reduced immunogenicity. However, since treatment with IFN-γ resulted in increased levels of MHC-I, β2-microglobulin, and HLA-E, it is expected that MHC-I related molecule expression will be enhanced after transplantation. This argument can be further supported by the functional MLR study, which showed a comparable stimulation on responder lymphocyte proliferation by NTU1 cell derivatives to that by allogeneic lymphocytes. Interestingly, in contrast to NTU1 hESCs, we identified that lymphocyte activation was blunted at higher cell numbers in the other three cell lines (including hESCs and hiPSCs). The latter observation suggests that different cell lines may have differential immunogenicity. This observation is of great interest when we refer to a recent study by Zhao et al. (41), which shows that, in contrast to derivatives of mouse ESCs, abnormal gene expression in differentiated mouse iPSCs can induce T-cell-dependent immune response and rejection in syngeneic recipients.
In addition, the results also show that the immune surveillance of human stem cell derivatives will be of greater complexity than the current data have suggested. For example, this study demonstrated NK receptor (NKp44) ligand expression in human pluripotent stem cells and derivatives at levels close to those of somatic cells. Since NK cells are known to target cells with low levels of MHC-I antigens, the results identify the possibility that NK cells may also attack human pluripotent stem cell-derived cells, even though they express lower levels of MHC-I molecules. This condition was further complicated by the increased expression of HLA-E in pluripotent stem cells/derivatives after IFN-γ treatment, since NK cells can recognize HLA-E/HLA-I peptide complex to modulate the cytotoxic activity.
Nature provides our organs (e.g., eye, brain, and placenta) with altered immune reaction to foreign antigens in a carefully balanced way (31). Previously, Robertson et al. showed that, despite the immunogenicity of mouse ESCs, inherent immune privilege might promote immune tolerance (29). The tolerance induction was attributed to the paucity of APCs and the TGF-β2 expression in the differentiated ESCs (21,29). The present study further supports the above findings in human stem cells by showing that markers for APCs remained low in differentiated stem cells even after IFN-γ treatment, indicating paucity of endogenous APC population. Therefore, although HLA-E expression was increased by IFN-γ, the function of antigen processing and presentation may not be intact in human pluripotent stem cell derivatives. The potential immune privilege of human stem cells might also originate from the differential expression of immune-related genes as opposed to those in somatic cells. For example, we observed significant upregulation of 7 out of the 10 immune privilege genes reported to be active in the ocular system (14,31,39). These gene products may exert diverse actions on the human immune system to foster immune privilege. For example, TGF-β2 signaling may suppress the activation of T-cells, NK cells, and macrophages, which induces the tolerance-promoting properties on APC (31,37). In agreement with the report in mouse ESCs (29), our study showed a high level (up to more than a 5–15-fold increase) of TGF-β2 expression in differentiated human pluripotent stem cells than somatic cells. Another example is Fas ligand (CD95L), which has recently been demonstrated to be expressed in a number of tumors to induce tumor escape (36). The highly expressed CD95L gene in the differentiated stem cells suggested that these cells might also escape immune surveillance in a way similar to some tumors. Further, we also showed significant upregulation of immune genes active in other systems, including Arginase2, Indole 1, GATA3, EMB, CALCB, and CR1L, which have been reported to enhance immune tolerance (7,25,28). In addition, although similar in the expression of most other tested genes, different pluripotent cells (especially hiPSC lines, e.g., iGra2 vs. iCFB50 cells) may have subtle differences in some immune-related gene expression. For example, the levels of CD55, CD46, and CD95L were significantly higher than those of somatic cells in iGra2 hiPSCs, but not in NTU1, H9 hESCs, and iCFB50 hiPSCs. The mechanism(s) remain obscure. However, the impact of reprogramming level and somatic cell origins of hiPSCs or the inherent characteristics could be the reasons. For example, mature human granulosa cells (parental somatic cells of iGra2 hiPSCs) are cells actively proliferating and participating in the ovarian follicular growth, in contrast to the foreskin fibroblasts (parental cells of iCFB50 cells), which are relatively inactive. The differential expression of immune-related genes between different somatic cells, as shown in this study, further supports that different somatic cell origins might affect subsequent gene expression in hiPSCs. Therefore, the possibilities cannot be excluded that even after reprogramming, hiPSCs may retain some original characteristics of the parental somatic cells. The idea that different pluripotent stem cells may retain different immune-related gene expression and immune reaction after transplantation can also be supported by a recent report (41), which showed the immune rejection of iPSCs (but not ESCs) in syngeneic recipients, likely due to overexpression of several specific genes including cytochrome P450, family 3, subfamily a, polypeptide 11 (Cyp3a11).
It is concluded that pluripotent stem cells and their progeny expressed MHC-related molecules and NK receptor ligand and therefore are predicted to be immunogenic, although evidence of potential immune privilege was also present. Functional MLR studies further suggested that the derivatives of pluripotent stem cells might activate lymphocytes and also showed differential immunogenicity in different pluripotent stem cell lines. Since human ESCs, iPSCs, and their derivatives are potentially future cell sources for cell transplantation, and immunogenicity is the determinant factor for success, this report provides informative data that are closely related to cell transplantation and can guide future in vivo studies in this field. Therefore, further in vivo studies will be the next step to determine to what levels the appropriately and terminally differentiated stem cell lineages will induce the immune response after transplantation. This part of the study is now going on actively in this lab, and hopefully useful data can be reported in due course for future reference in improving cell transplantation therapy.
Footnotes
Acknowledgments
This work was supported by grants from the National Science Council of the Republic of China (NSC98-3111-B-002-003, NSC98-3111-B-002-001, NSC99-3111-B-002-009, NSC99-2314-B-002-106-MY3), and the research fund from National Taiwan University Hospital (MG 237, the Stem Cell Research Fund, donated by Mr. Ted Wen). Affymetrix GeneChip assays were performed by the Affymetrix Gene Expression Service Lab (http://ipmb.sinica.edu.tw/affy/) supported by Academia Sinica. The authors declare no conflicts of interest.