
Abstract
Definitive endoderm (DE) derived from stem cells holds potential to differentiate into hepatocytes. Stem cell therapy using those cells has potential for a treatment of liver disease. To date, various ways of inducing hepatocytes from embryonic stem (ES) cells have been reported by researchers. However, it has not been proved enough that induced pluripotent stem (iPS) cells behave in the same manner as ES cells in endoderm differentiation. The purpose of this study was to establish an efficient method to induce DE from iPS cells, through comparatively analyzing the efficacy of endoderm formation from mouse ES cells. Furthermore, the efficiency of a serum-free medium in the differentiation into DE was investigated. Mouse ES cells and iPS cells were floated in culture medium for 2 or 5 days and embryoid bodies (EB) were formed. Subsequently, DE was induced with 100 ng/ml activin A and 100 ng/ml basic fibroblast growth factor (bFGF). RT-PCR and real-time PCR analyses were carried out at each step to determine the gene expression of EB markers. The difference in cellular proliferation between serum-containing and serum-free media was examined by an MTS assay in EB and DE induction. iPS cells showed the paralleled mRNA expression to ES cells in each step of differentiation into EB, but the levels of expression of Sox17 and Foxa2 were relatively higher in ES cell-derived DE, whereas Cxcr4 expression was higher in iPS cell-derived DE. The utilization of serum-free medium for iPS cells showed significantly favorable cellular proliferation during EB formation and subsequent DE induction. Forming EB for 5 days and subsequently DE induction with activin A and bFGF with serum-free medium was an appropriate protocol in iPS cells. This may represent an important step for generating hepatocytes from iPS cells for the development of cell therapy.
Introduction
In the last decade, embryonic stem (ES) cells have been established as pluripotent stem cells that can be differentiated into various cell lineages. For instance, several reports have demonstrated that hepatocytes are generated from ES cells through definitive endoderm (DE) (1, 12, 17). The organ-specific cells induced from ES cells show an equal gene expression to innate cells and have a biological potential as functional cells. For example, ES cell-generated hepatocytes have functions of albumin production, glycogen storage, urea synthesis, and other metabolic activities. These successes in generating hepatocytes from ES cells raise the possibility that the cells can support a failed liver function, and correct metabolic diseases in the long term (9). Although ES cells provide a potential source sufficient amounts of hepatocytes due to their infinitely proliferating capacity in vitro, an ethical issue associated with ES cell derivation from embryos and the need for immunosuppression after allotransplantation of differentiated ES cells impede clinical therapeutic application.
Recently, induced pluripotent stem (iPS) cells had been successfully established from mouse and human fibroblasts using defined factors (20, 21, 23). iPS cells are pluripotent and are able to proliferate unlimitedly in vitro. This technical breakthrough in creating iPS cells from somatic cells has noteworthy implications for overcoming the immunological rejection and the ethical issues associated with the derivation of embryonic stem (ES) cells from embryos.
Current studies have demonstrated that iPS cells can differentiate into various lineages of organ-specific cells, but it has not been ascertained whether iPS cells show the identical behavior to ES cells in the differentiation processes. Provided that iPS cells share the similar process with ES cells in DE induction and in further differentiation, previously reported differentiation-inducing protocols on ES cells will be potentially useful in iPS cells.
To determine a reliable protocol on iPS cell differentiation for the development of cell therapies, we comparatively examined the gene expression profile of mouse iPS cells up to the process of DE formation in comparison with mouse ES cells in the present work. We found that iPS cells behave similarly to ES cells in embryoid body (EB) formation and DE induction in terms of morphological assessment and gene expression profiles.
Materials and Methods
Cell Culture
The mouse ES cells, strain Balb/c x 129sv (Dainippon Pharmaceutical, Osaka, Japan), of passages 5–20 were used in this study. The cells were maintained by culture on a feeder layer of mouse embryo fibroblasts (MEF) (Dainippon Pharmaceutical) inactivated by mitomycin C (Biomol, Enzo Life Sciences International, PA) on gelatin (Specialtymedia, Chemicon International, MA)-coated plates. The mouse iPS cells were kindly provided by Riken Cell Bank (Cell No. APS0001, Cell name iPS-MEF-Ng-20D-17, Lot No. 006) (11). Mouse iPS cells of passages 11–20 were maintained by culture on a feeder layer of inactivated SNL (DS Pharma Biomedical, Osaka, Japan) or inactivated MEF on gelatin-coated plates. ES cells and iPS cells were cultured with Complete ES cell medium (Specialtymedia, Chemicon International) supplemented with 1000 U/ml recombinant leukemia inhibitory factor (LIF) (ESGRO™, Chemicon International) at 37°C in 5% CO2. Every passage was carried out before cells reached confluency (20).
Formation of Embryoid Bodies
ES cells or iPS cells growing on feeder cells were dispersed by treatment with trypsin-EDTA (Sigma-Aldrich Japan, Tokyo, Japan) and collected by centrifugation at 800 rpm for 3 min. Cells were then resuspend in two different EB formation medium. One medium was DMEM/F12-based EB formation medium consisting of DMEM/F12 (Gibco, Invitrogen, CA), 15% fetal bovine serum (FBS) (HyClone, Thermo Fisher Scientific, Northumberland, UK), 1% nonessential amino acids (MP Biomedicals, CA), 1% nucleosides (DS Pharma Biomedical, Osaka, Japan), 1% penicillin/streptomycin (Sigma-Aldrich Japan), and 1% l-glutamic acid (DS Pharma Biomedical). The other medium was Knockout DMEM-based EB formation medium consisting of Knockout DMEM (Gibco), 15% knockout serum replacement (KSR) (Gibco), 1% nonessential amino acids, 1% 2-mercaptoethanol (Gibco), 1% penicillin/streptomycin, and 1% l-glutamic acid. ES cells or iPS cells were then transferred to ultra-low attachment six-well plates (Corning, NY) at a density of 1 × 10⁵ cells/ml and cultured free floating in the culture medium to induce the formation of EB (at day 0). Half of the medium was replaced daily.
Assessment of Cell Proliferation in EB Formation
ES cells or iPS cells growing on feeders were dispersed by treatment with trypsin-EDTA and collected by centrifugation. Cells were divided into two groups and then resuspend in DMEM/F12-based or Knockout DMEM-based EB formation medium, as described above. Then 100 μl of the medium containing 1 × 10⁴ cells were transferred to each well of a low attachment 96-well plate (Lipidure-coat 96-well plate, NOF Corporation, Tokyo, Japan) and cultured free floating in the medium. An MTS assay was performed at days 0, 1, 2, 3, and 5, by using a CellTiter 96 Aqueous one solution reagent (Promega, WI). Absorbance of the samples of 492 nm was measured 1 h after supplementation of 10 μl of the reagent.
Induction of Definitive Endoderm
At days 2 and 5, EB were collected by centrifugation at 1000 rpm for 3 min and were transferred to a gelatin-coated six-well plate. EB were cultured for an additional 5 days in presence or absence of 100 ng/ml activin A (R&D Systems, MN) and 100 ng/ml basic fibroblast growth factor (bFGF) (Peprotech, NJ). Two kinds of medium were employed for DE induction. One medium was RPMI-1640-based DE induction medium that contained RPMI1640 (Gibco), 1% penicillin/streptomycin, 1% l-glutamic acid, and varying concentrations of ES cell qualified FBS (Gibco): 0% for the first 24 h, 0.2% for the second 24 h, and 2.0% for subsequent days of differentiation. The other medium was Knockout DMEM-based DE induction medium that contained Knockout DMEM, 1% penicillin/streptomycin, 1% l-glutamic acid, and varying concentrations of KSR: 0% for the first 24 h, 0.2% for the second 24 h, and 2.0% for subsequent days of differentiation. Half of the medium was replaced daily.
Assessment of Cell Proliferation in DE Induction
Two-day-old EB, which was formed in Knockout DMEM-based EB formation medium, were collected by centrifugation at 1000 rpm for 3 min and EB were divided into two groups and then resuspended in two different kinds of DE induction medium. One was RPMI-1640 supplemented with 1% penicillin/streptomycin, 1% l-glutamic acid, and 2% ES cell qualified FBS. Another was Knockout DMEM supplemented with 1% penicillin/streptomycin, 1% l-glutamic acid, and 2% KSR. To each well of a 96-well plate, 100 μl of the medium containing EB was transferred and cultured for 5 days. An MTS assay was performed at days 0, 1, 3, and 5, by using CellTiter 96 Aqueous one solution reagent. Absorbance of the samples of 492 nm was measured 1 h after supplementation of 10 μl of the reagent.
Isolation of RNA and Reverse Transcription-Polymerase Chain Reaction
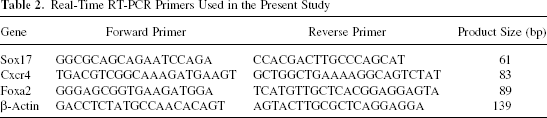
Reverse transcription-polymerase chain reaction (RT-PCR) was carried out at various points of the differentiation program to determine the degree to which ES cells and iPS cells differentiated toward DE. RNA was extracted using a TRIzol reagent (Invitrogen). Complementary DNA was prepared using a MuLV reverse transcriptase (Applied Biosystems, CA) and RNase inhibitor (Applied Biosystems) from 2 μg of total RNA. RT-PCR was performed with AmpliTaq gold DNA polymerase, GeneAmp PCR gold buffer, and MgCl2 solution (Applied Biosystems). Primers used for RT-PCR are listed in Table 1. PCR products were resolved on 2.5% agarose gels and visualized by ethidium bromide staining. A real-time PCR was performed on LightCycler 1.5 Instrument (Roche Applied Science, IN) with LightCycler FastStart DNA master SYBR green I (Roche Applied Science) as per the manufacturer's instructions. Primers are listed in Table 2.
RT-PCR Primers Used in the Present Study
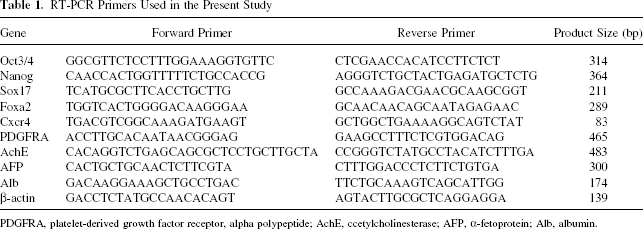
PDGFRA, platelet-derived growth factor receptor, alpha polypeptide; AchE, ccetylcholinesterase; AFP, α-fetoprotein; Alb, albumin.
Real-Time RT-PCR Primers Used in the Present Study
Immunostaining of Cultured Cells
Sox17 and Cxcr4 staining of the cells was carried out on slides. Cells were dispersed by trypsin-EDTA and single cells were attached to slides by centrifugation at 1000 rpm for 3 min. The cells were fixed in 4% paraformaldehyde solution for 10 min at 27°C. After fixation, the cells were washed twice with PBS containing 0.1% Triton X-100 (EMD Chemicals, NJ), and then blocked with blocking solution (PBS containing 0.02% rabbit serum and 0.1% Triton X-100) for 10 min at 27°C. Cells were then labeled with a goat Sox17 antibody (Santa Cruz Biotechnology, CA). After two washes with PBS, Cy3 conjugated rabbit anti-goat antibody (Abcam, MA) was used as the secondary antibody. Cells were then blocked with blocking solution (PBS containing 0.03% goat serum and 0.1% Triton X-100) for 15 min at 27°C. After two washes with PBS, cells were labeled with rat Cxcr4 antibody (BD, NJ). After two washes with PBS, cells were stained with Cy2 conjugated goat anti-rat antibody (Abcam). After three washes with PBS, cells were covered with a coverslip in the mounting solution (Vector Laboratory).
Statistical Analysis
Student's t-test was used to estimate the difference, and p < 0.05 was deemed statistically significant.
Results
Formation of EB
After starting the free-floating culture, cells began to aggregate and make clusters at day 1 (Fig. 1A–D). At day 2, most cells formed spherical clusters, so-called EB (Fig. 1E–H). Furthermore, EB united with each other and were arranged in a rouleau formation at day 5 (Fig. 1I–L). Morphological appearance was not different between ES cells and iPS cells during EB formation.

Morphological changes during EB formation in the two different media. Liquid suspension culture was used for the formation of EB. After starting the free-floating culture without leukemia inhibitory factor in the medium, cells began to aggregate and some clusters were seen at day 1 (A–D). At day 2, spherical cell aggregates with morula-like structures, so-called EB, were formed. The number of single cells was remarkably decreased (E–H). At day 5, larger cell aggregates appeared (I–L). Morphological appearance was not different between ES cells and iPS cells during EB formation.
RT-PCR analysis showed the similar gene expression profiles between ES cells and iPS cells in the course of the EB formation (Fig. 2A). Undifferentiated makers (Oct 3/4 and Nanog) were stably maintained up to day 2 of the culture and then decreased on day 5. In contrast, the expression of markers for panendoderm (Sox17 and Foxa2) and DE (Cxcr4) increased on day 5. The degree of differentiation toward DE on day 5 of the culture was relatively higher in iPS cells than ES cells, which was more obvious when DMEM/F12-based medium was used (Fig. 2B).

RT-PCR analysis in EB formation. (A) RNA samples from MEF, SNL, 2-day-old EB, and 5-day-old EB were analyzed by RT-PCR for RNA expression of undifferentiated cells (Oct 3/4 and Nanog), panendoderm (Sox17 and Foxa2), DE (Cxcr4), mesoderm (PDGRFA), neuroectoderm (AchE), early-committed hepatocytes (AFP), and matured hepatocytes (Alb). β-Actin was used as housekeeping gene. The result showed similar gene expression between ES cells and iPS cells in the course of the EB formation, except for AFP. Expression of markers for panendoderm (Sox17 and Foxa2) and DE (Cxcr4) increased on day 5. AFP was strongly expressed in SNL. AFP expression was also positive in iPS cells, but this positivity possibly resulted from a contamination of SNL, because iPS cells were maintained on SNL as a feeder layer and SNL was difficult to remove completely by treatment with trypsin-EDTA. MEF, mouse embryo fibroblasts; F12, DMEM/F12-based EB formation medium; KO, Knockout DMEM-based EB formation medium. (B) RNA samples from MEF, SNL, 2-day-old EB from ES cells or iPS cells, and 5-day-old EB from ES cells or iPS cells were analyzed by quantitative RT-PCR for relative RNA expression of Sox17, Cxcr4, and Foxa2. mRNA expression levels were normalized relative to β-actin and the sample of DE induced from 2-day-old EB of iPS cells with activin A and basic FGF. MEF, mouse embryo fibroblasts; F12, DMEM/F12-based EB formation medium; KO, Knockout DMEM-based EB formation medium.
As shown in Figure 3, an MTS assay demonstrated superiority of cell proliferation in Knockout DMEM-based EB formation medium over DMEM/F12-based medium. The difference was statistically significant at day 1 for both ES cells and iPS cells, and such advantage of Knockout DMEM continued up to day 5 of the culture.

Cell proliferation assay in EB formation. Results were expressed as means plus SD for Knockout DMEM-based EB formation medium (n = 5) and means minus SD for DMEM/F12-based medium (n = 5). The ratio of cell number of each sample to that of day 0 was presented by measuring an absorbance of 492 nm. Superiority of Knockout DMEM-based EB formation medium over DMEM/F12-based medium was demonstrated. F12, DMEM/F12-based EB formation medium; KO, Knockout DMEM-based EB formation medium.
Induction of Definitive Endoderm
EB were attached to a plate soon after being transferred to the gelatin-coated plate, and cells started to proliferate from the periphery of the cellular clusters. Morphological appearance was not different between ES cells and iPS cells during DE induction (Fig. 4). At the end of the DE induction program, polygonal cells with round nuclei were observed (Fig. 5), which was one of the features of hepatocytes in in vitro culture. In this DE induction protocol, the appearance of Sox17- and Cxcr4-positive cells was confirmed by an immunofluorescent study (Fig. 5B, C).

Morphological changes during DE induction. Cells started to proliferate from the edges of the cellular clusters. Morphological appearance was similar between ES cells and iPS cells.

RT-PCR analysis and immunostaining of induced DE. (A) At the end of the DE induction program, polygonal cells with round nuclei were observed in iPS cell-derived DE. (B) iPS cell-derived DE was immunostained by Sox17 and Cxcr4. Nuclei were stained with DAPI. Sox17-positive cells are indicated by red color of Cy 3 and Cxcr4-positive cells are indicated by green color of Cy 2. Induced DE with activin A and basic FGF was positive for Sox17 and Cxcr4. (C) DE induced without any factors was used as negative control for immunostaining. (D) mRNA expression levels were normalized relative to beta-actin and the sample of DE induced from 2-day-old EB of iPS cells with activin A and bFGF. Panendoderm-specific gene (Sox17 and Foxa2) expression and DE-specific gene (Cxcr4) expression progressively increased over the course of the DE induction program. The levels of Sox17 and Foxa2 expression of DE induced from ES cells were relatively higher than that of iPS cells, whereas Cxcr4 expression of DE induced by ES cells was lower than that of iPS cells. (E) DEs were induced in the presence or absence of activin A and bFGF. RNA samples were analyzed by RT-PCR for RNA expression. Expression of Alb, a marker for mature hepatocytes, was detected in DE induced from 5-day EB. Nevertheless, markers for mesoderm (PDGFRA) and for neuroectoderm (AchE) were also more increased in DE induced from 5-day-old EB than that from 2-day-old EB.
Both RT-PCR and a real-time PCR assays demonstrated that the expression of panendoderm-specific markers Sox17 and Foxa2 and a DE-specific marker Cxcr4 progressively increased over the course of DE induction (Fig. 5D, E). Treatment with 100 ng/ml activin A and 100 ng/ml bFGF accelerated the differentiation toward DE for ES cells and iPS cells. At the end of the DE induction program, the expression levels of Sox17 and Foxa2 in DE induced by ES cells were relatively higher than that of iPS cells, whereas Cxcr4 expression in ES cell-induced DE was lower than that in iPS cell-induced DE. The period of EB formation also influenced the gene expression profiles of DE. The expression of Sox17, Foxa2, and Cxcr4 in DE induced by 5-day formation of EB was higher than that of DE formed by 2-day EB (Fig. 5D). Markers for mesoderm (PDGFRA) and for neuroectoderm (AchE) were also increased in DE induced from 5-day EB (Fig. 5E). Albumin expression was higher in DE induced from 5-day EB.
During DE induction, an MTS assay demonstrated that the use of Knockout DMEM medium to proliferate cells was significantly better than that of RPMI-based medium (Fig. 6). The difference in cell proliferation was statistically significant at days 1, 3, and 5 for ES cells and at days 1 and 5 for iPS cells.

Cell proliferation assay in DE induction. Results were expressed as means plus SD for Knockout DMEM-based DE induction medium (n = 5) and means minus SD for RPMI-1640-based medium (n = 5). The ratio of cell number of each sample to that of day 0 was presented by measuring an absorbance of 492 nm. Superiority of Knockout DMEM-based EB formation medium over DMEM/F12-based medium was demonstrated. RPMI, RPMI-1640-based EB formation medium; KO, Knockout DMEM-based EB formation medium.
Discussion
During the development of vertebrates, formation of endoderm, mesoderm, and ectoderm is one of the first key events in determining cell fates. Among the three germ layers, DE forms the lining of the alimentary tract and gives rise to liver, pancreas, intestine, and lung. Therefore, inducing DE is the first critical step to generate hepatocytes from ES cells and iPS cells. But a complication to assess the expression of genes related to DE is that mammals possess visceral endoderm, which shares the expression of many genes with DE (14). Visceral endoderm is directly derived from the inner cell mass and is a chief metabolic component of the visceral yolk sac. Visceral endoderm cells also express Sox17 (8) and Foxa2 (2, 13) as well as DE. Thus, in this study, in order to distinguish DE from visceral endoderm and further to estimate the degree of differentiation toward DE phenotype, Cxcr4 was employed in addition to well-characterized panendodermal genes Sox17 and Foxa2. Cxcr4, which is not expressed in visceral endoderm and undifferentiated ES cells, can be used as a marker to exclude contamination of visceral endoderm and undifferentiated ES cells during differentiation program (22).
As shown in the results of gene expression analysis (Figs. 2 and 5), iPS cells showed the paralleled expression of undifferentiated, mesodermal, and ectodermal markers to ES cells except α-fetoprotein (AFP), during the formation of EB and induction of DE. The detection of AFP expression in iPS cells was a contamination of SNL, which was used as a feeder layer for iPS cell culture. Complete removal of SNL was not feasible with the treatment of trypsin-EDTA in the present study.
Activin A, a family member of transforming growth factor-β (TGF-β), is one of the most notable factors inducing endoderm and mesoderm (6, 16). Activin A binds to the cell surface receptor and induces the expression of many genes those are important for early endoderm development (15). High concentrations of activin A has been shown to support endoderm and some mesoderm differentiation, whereas low concentrations induce a development of mesoderm (10). It has also been suggested that FGF is able to induce endoderm development collaboratively with activin A (4, 5). Additionally, in the development of embryo, FGF signaling is necessary to induce a hepatic fate and suppress the pancreatic fate within the ventral endoderm (7, 19, 24, 25). Adjustment of an adequate dose of activin A and bFGF for DE induction in iPS cells is important as a key step of hepatic differentiation.
Consequently, we found that the supplementation of 100 ng/ml activin A and 100 ng/ml of bFGF was appropriate to induce DE from iPS cells. As shown in Figure 5B, at the end of the DE induction program, the expression levels of endodermal markers were increased in DE. The results strongly indicated that differentiation of iPS cells toward DE was accelerated by activin A and bFGF. DE induced from 5-day formation of EB exhibited the higher gene expression of Sox17, Foxa2, Cxcr4, and albumin. This result suggests that EB formation for 5 days is suitable for DE induction and possibly for subsequent hepatic induction in iPS cells. However, both mesodermal and ectodermal markers were also expressed higher in DE induced from 5-day EB than that of 2-day EB. The result indicates that DE induced from 5-day EB differentiated toward three germ layers, not only toward the endoderm. Therefore, we will have to make a strategy to purify the hepatic differentiated population in the final stage.
Another objective of this work was to establish an adequate recipe of medium for iPS cell differentiation protocol. According to the previous reports (3, 18), serum-containing medium such as DMEM/F12-based medium and RPMI-1640-based medium were initially employed for EB formation and DE induction, respectively. But as shown in the MTS assay, the serum-free medium was superior to the serum-containing medium in terms of cell proliferation throughout the differentiation program. Serum-free media holds another advantage to avoid contamination of the serum of other animals. Consequently, Knockout DMEM with KSR and supplementation was a suitable combination for the differentiation protocol for both ES and iPS cells.
In conclusion, the present study revealed that iPS cells showed the almost similar gene expression profile to ES cells in each step of differentiation into DE. The utilization of serum-free medium showed favorable cellular proliferation during EB formation and subsequent DE induction. Forming EB for 5 days and subsequently inducing DE with activin A and bFGF with serum-free medium was an appropriate protocol for iPS cells. This work represents the important step to facilitate the establishment of the protocol to generate patient specific iPS cell-derived hepatocytes that will enable cell transplantation for a wide spectrum of liver diseases without immunosuppression in the future.