
Abstract
Our previous study indicated that electroacupuncture (EA) could increase neurotrophin-3 (NT-3) levels in the injured spinal cord, stimulate the differentiation of transplanted bone marrow mesenchymal stem cells (MSCs), and improve functional recovery in the injured spinal cord of rats. However, the number of neuron-like cells derived from the MSCs is limited. It is known that NT-3 promotes the survival and differentiation of neurons by preferentially binding to its receptor TrkC. In this study, we attempted to transplant TrkC gene-modified MSCs (TrkC-MSCs) into the spinal cord with transection to investigate whether EA treatment could promote NT-3 secretion in the injured spinal cord and to determine whether increased NT-3 could further enhance transplanted MSCs overexpressing TrkC to differentiate into neuron-like cells, resulting in increased axonal regeneration and functional improvement in the injured spinal cord. Our results showed that EA increased NT-3 levels; furthermore, it promoted neuron-phenotype differentiation, synaptogenesis, and myelin formation of transplanted TrkC-MSCs. In addition, TrkC-MSC transplantation combined with EA (the TrkC-MSCs + EA group) treatment promoted the growth of the descending BDA-labeled corticospinal tracts (CSTs) and 5-HT-positive axonal regeneration across the lesion site into the caudal cord. In addition, the conduction of cortical motor-evoked potentials (MEPs) and hindlimb locomotor function increased as compared to controls (treated with the LacZ-MSCs, TrkC-MSCs, and LacZ-MSCs + EA groups). In the TrkC-MSCs + EA group, the injured spinal cord also showed upregulated expression of the proneurogenic factors laminin and GAP-43 and downregulated GFAP and chondroitin sulfate proteoglycans (CSPGs), major inhibitors of axonal growth. Together, our data suggest that TrkC-MSC transplantation combined with EA treatment spinal cord injury not only increased MSC survival and differentiation into neuron-like cells but also promoted CST regeneration across injured sites to the caudal cord and functional improvement, perhaps due to increase of NT-3 levels, upregulation of laminin and GAP-43, and downregulation of GFAP and CSPG proteins.
Keywords
Introduction
The permanent dysfunctions in spinal cord injury (SCI) mainly result from widespread neuronal loss, acute axonal disruption, demyelination, and a hostile lesion milieu. Numerous efforts have been made to reestablish the neuronal networks and improve axonal regeneration across the lesion site. However, current treatments for SCI are of limited therapeutic efficacy in mammals, which may be due to poor axonal regeneration in the central nerve system (CNS). The failure of axonal regeneration following SCI has been attributed to a nonpermissive environment containing inflammatory mediators, lack of neurotrophic support, inhibitory molecules, and the formation of glia scarring (26). Stem cell transplantation is one potential therapeutic strategy for SCI. Bone marrow mesenchymal stem cells (MSCs) have been suggested as a promising candidate for the treatment of CNS injuries (19, 70) because of their comparative ease of isolation, expansion, and potential autologous application. MSCs display a number of potential mechanisms of therapeutic action including multidifferentiated capacity (9, 14, 21, 34, 37, 42, 103), trophic support (12, 74, 83, 101), and immunomodulatory properties (48, 59, 67, 68, 105). Studies have suggested that MSCs can promote axonal regeneration and functional recovery after SCI by secreting a variety of growth factors and providing a scaffold and directional guidance for the regenerating axons (15, 34). However, the limitations of MSCs include their poor survival and poor differentiation into neurons when transplanted into the injured spinal cord (45, 70).
Electroacupuncture (EA) is a therapeutic approach in which a needle inserted into an acupoint is attached to a trace pulse current with the purpose of producing synthetic electric and needling stimulation. The application of EA for the treatment of SCI has shown promising results in the alleviation of patients' suffering (94). The use of EA on the Governor Vessel has been shown to reduce secondary injury after a SCI in both patients and animal models (32, 96). Interestingly, our previous study found that utilizing EA on the Governor Vessel acupoints promote neurotrophin-3 (NT-3) secretion in the injured spinal cord and enhance the differentiation of grafted neural stem cells (NSCs) and MSCs into neuron-like cells at the injured site (13, 21). However, the ability of MSCs to differentiate into neurons, especially functional neurons, is very limited.
NT-3 stimulates the development, differentiation, and survival of CNS neurons (7). Our previous study has suggested that transplantation of MSCs undergoing combined treatment with NT-3 gene recombinant adenoviral vector (AdvNT-3) and retinoic acid (RA) improve the structural and functional recovery of SCI in rats. However, the combination of AdvNT-3 transfection and RA only has a mild effect in promoting the neuronal differentiation of MSCs in vivo (102). NT-3 mediates its action by preferentially binding to the tyrosine kinase receptor type 3 (receptor TrkC). Therefore, in the present study, we hypothesize that the interaction between NT-3 and its receptor TrkC could significantly promote the differentiation of MSCs into cells with neuronal phenotypes. To test this hypothesis, we attempted to transplant TrkC gene-modified MSCs (TrkC-MSCs) into the spinal cord with transection injury and then investigated whether EA treatment could promote endogenous NT-3 secretion in the injured spinal cord. The hope is that increased NT-3 through EA could further enhance differentiation of the transplanted TrkC-MSCs into phenotypically neuron-like cells with the potential of forming synapses as well as encourage axonal regeneration and functional improvement in the spinal cord.
Materials and Methods
Preparation of Bone Marrow Mesenchymal Stem Cells (MSCs)
The methods for the preparation of MSCs have been described in detail in our previous study (20, 21). Briefly, the tibias and femurs of the green fluorescent protein (GFP) transgenic Sprague–Dawley (SD) rats (2 weeks old) were dissected under anesthesia and aseptic conditions. After removing the end of the bone, a 22-gauge needle filled with low glucose Dulbecco's modified Eagle's medium (L-DMEM, Gibco/BRL, Carlsbad, CA) was injected into the central canal of the bone to extrude the bone marrow. The solution containing bone marrow was then centrifuged at 1,000 rpm for 5 min. The pellet was resuspended in L-DMEM and supplemented with 10% inactivated fetal bovine serum (FBS), penicillin (100 U/ml), and streptomycin (100 mg/ml). The cells were then cultured in a 75-ml cell flask, and after plating the cells for 48 h, the medium was replaced to remove nonadherent cells. When the adherent MSCs grew to near 70–80% confluency, they were serially passaged using 0.25% trypsin/0.02% EDTA. After being passaged three to five times, the MSCs were ready for use in transplantation.
Transduction of MSCs with the LacZ Reporter Gene and TrkC Gene
Recombinant adenoviral vectors of the β-galactosidase (LacZ) gene (Ad-LacZ) and HEK293 cells were provided by Dr. Wen-lin Huang (Cancer Research Center of Sun Yat-sen University, Guangzhou, China). Recombinant adenoviral vectors of human tyrosine kinase C (TrkC) gene (Ad-TrkC) were constructed as described in our previous study (91). The recombinant adenovirus was propagated in 293 cells and concentrated on cesium chloride gradients after standard procedures (according to the BD Adeno-XTM instruction manual). The titer of the concentrated Ad-TrkC stock, determined by direct plaque assay, was 2.5 × 10¹¹ plaque-forming units (pfu)/ml. The titer of Ad-LacZ was 2.95 × 10¹⁰ pfu/ml.
MSCs were infected with Ad-LacZ or Ad-TrkC at a multiplicity of infection (MOI) of 300 for 48 h as our previous study (102–104). After 48 h, the LacZ gene-modified MSCs (LacZ-MSCs) or TrkC gene-modified MSCs (TrkC-MSCs) were collected and were ready for use in transplantation. In addition, a small part of LacZ-MSCs and TrkC-MSCs were fixed in 2.5% paraformaldehyde for histochemical staining. LacZ-MSCs were incubated in X-gal staining solution [20 mM potassium ferricyanide, 20 mM potassium ferrocyanide, 2 mM MgCl2, and 1 mg/ml X-gal (Sangon), prepared with 0.01 M PBS (pH 7.4)] overnight at 37°C in darkness. The expression of TrkC was examined by immunofluorescent methods. The primary antibody was mouse anti-human TrkC (1:500, R&D), and the secondary antibody was cyanine 3 (Cy3)-conjugated goat anti-mouse IgG.
Animal Groups and Spinal Cord Surgery
A total of 80 adult female SD rats (230–250 g, Experimental Animal Center, Zhongshan School of Medicine of Sun Yat-sen University, China) were used for this study. Rats were housed in a temperature-controlled (24 ± 2°C) and light-controlled (12:12 light–dark cycle) room with free access to food and water. Prior to experimental manipulation, rats were allowed to acclimate to the housing facilities and were handled daily at least for 3 days. All experimental protocols and animal handling procedures were approved by the Animal Care and Use Committee of Sun Yat-sen University and were consistent with the National Institutes of Health Guide for the Care and Use of Laboratory Animals.
The rats underwent a complete transection of the spinal cord at the T10 spinal segment based on previous reports (31, 58) and were divided into four groups: The LacZ-MSC group received LacZ-MSC transplantation after spinal cord transection; the LacZ-MSCs + EA group received transplanted LacZ-MSCs with EA treatment after transection; the TrkC-MSC group received TrkC-MSC transplantation after spinal cord transection; the TrkC-MSCs + EA group received TrkC-MSC transplantation and EA treatment after spinal cord transection.
The animals (total of 80; n = 20 in each group) were anesthetized with 1% sodium pentobarbital (40 mg/kg, IP). A laminectomy was carried out at the T9–T10 level to expose the T10 spinal segment. The dura was cut, the T10 segment was transected completely with a scalpel, and no tissue was removed. The transection site was carefully examined via light microscopy to ensure complete transection of the spinal cord. A piece of gelfoam (2 × 2 × 2 mm3) preinjected with LacZ-MSCs or TrkC-MSCs (1 × 10⁵ cells/μl, 5 μl) was inserted into the transected site of the spinal cord. After surgery and gelfoam transplantation, and the muscle and skin were closed in layers. After surgery, all rats received an intramuscular injection of penicillin (160,000 U/ml/day) and were housed separately in individual cages with thick soft bedding. Manual emptying of the bladders was performed twice daily. Rehabilitation of rats was not performed except for EA treatment after the surgery and transplantation of MSCs.
Electroacupuncture (EA) Treatment
Based on our previous work, two pairs of Governor Vessel acupoints were selected during EA treatment. One pair of acupoints are Changqiang (GV1) and Yaoshu (GV2); another pair of acupoints are Jizhong (GV6) and Zhiyang (GV9) (21). Rats were loosely immobilized in a specially made restrainer that exposed their dorsal spine, hind legs, and tails. Two pairs of stainless silver needles of 0.3 mm in diameter were inserted into the GV1 and GV2, and GV6 and GV9, to a depth of 5 mm. The two pairs of needles were connected to the output terminals of an EA apparatus (Model G 6805-2, Shanghai Medical Electronic Apparatus Company, China). Alternating strings of dense-sparse frequencies (60 Hz for 1.05 s and 2 Hz for 2.85 s) were used. The intensity was adjusted to induce a slight twitch of the hindlimb (≤1 mA) and lasted for 20 min. EA was administered once every other day for 7 weeks, starting from the seventh day postsurgery.
Behavioral Analysis
The hindlimb locomotor behavior of rats was evaluated by the open field locomotion test of Basso, Beattie, Bresnahan (BBB) (5). Each session lasted 4 min. The open field locomotor activity score was determined by observation and scoring of behaviors involving the trunk, tail, and hindlimbs. Scores from both examiners were averaged for each rat. Scores ranged from 0 to 21 (0, no movement; 21, normal movement) (5). All animals received behavioral testing every 2 weeks postsurgery for 8 weeks. All behavioral tests were videotaped, and both examiners were blind to each group when they participated in behavioral evaluation.
NT-3 Assay
Based on our previous study (21), 4 weeks after transection of the spinal cord, 20 rats (n = 5 for each group) were anesthetized with 1% sodium pentobarbital (40 mg/kg) and transcardially perfused with 200 ml of ice-cold 0.1 M PBS. Three spinal cord segments, the lesion site and the areas 1 cm rostral and 1 cm caudal to the lesion site, were excised while on dry ice. The segments were weighed and then mechanically homogenized in ice-cold 0.1 M PBS. Homogenates were centrifuged for 10 min at 14,000 rpm at 4°C and used for NT-3 ELISA according to the instructions of the manufacturer (NT-3 Emax ImmunoAssay System, Boster).
Effect of NT-3 on Differentiation of TrkC Gene Modified MSCs In Vitro
In order to examine the effect of NT-3 on the differentiation rate of neuron-like cells from TrkC-MSCs, gene-modified cells were prepared first as described above. MSCs were transfected with Ad-TrkC (MOI = 300), and then both MSCs and TrkC-MSCs were adjusted to 2 × 10⁴/ml and cultured in a 24-well plastic plate in L-DMEM containing 5% FBS. Five experimental groups were included for each phenotypic verification: the MSCs, NT-3 + MSCs, TrkC-MSCs, NT-3 + TrkC-MSCs, and NT-3 + TrkC-MSCs + K252a groups (6 wells/group, including 1 negative control well). In the NT-3 + MSCs, NT-3 + TrkC-MSCs, and NT-3 + TrkC-MSCs + K252a groups, the culture medium contained 10 ng/ml NT-3. In addition, 100 nm K252a (Calbiochem, Darmstadt, Germany), an inhibitor of neurotrophin-related tyrosine kinase, was added into the culture medium in the NT-3 + TrkC-MSCs + K252a group. The culture medium was replaced every 2 days. After 7 days of culture, the cells were fixed and then immunostained with mouse anti-neurofilament 150 (NF-150; 1:400, Chemicon) and mouse anti-myelin/oligodendrocyte specific protein (MOSP; 1:1,000, Chemicon) overnight at 4°C, followed by incubation with the corresponding Cy3-conjugated secondary antibodies (1:800, Jackson Immunoresearch Labs, Inc.) for 1 h before being rinsed three times with 0.01 M PBS (pH 7.4). GFP cells (green), Cy3 immunofluorochemically labeled cells (red, for either NF-150 or MOSP), and double-labeled cells (yellow) were evaluated via fluorescence microscopy (Leica DMIRB). For each culture well, three random microscopic visual fields at 200x magnification were observed. A total of 15 visual fields were evaluated in each experimental group (5 wells/group), and all GFP cells were counted. Differentiated neuron-like cells (NF-150-positive) and oligodendrocyte-like cells (MOSP-positive) were counted separately and expressed as the percentage of total GFP cells. Every independent group was repeated for a total of three times.
Anterograde Tracing
Anterograde tracer biotinylated dextran amine (BDA) was used to assess the regeneration of corticospinal tracts (CSTs) (20). Eight weeks after the spinal cord surgery, 20 rats (n = 5 from each group) were anesthetized using ketamine (40 mg/kg) and 1% sodium pentobarbital (30 mg/kg). A burr hole was drilled through the cranium to expose the sensorimotor cortex (1–3 mm posterior to bregma and 1–3 mm lateral to bregma). A 10% solution of BDA (10,000 mw; Molecular Probes) was injected into eight sites at each sensorimotor cortex (0.5 μl/site) to cover the hindlimb region.
Two weeks after BDA injection, animals were deeply anesthetized with an overdose of 1% sodium pentobarbital perfused through the heart with 200 ml of 0.01 M PBS, pH 7.4, followed by 500 ml of an ice-cold, freshly prepared solution of 4% formaldehyde without (for immunofluorescent histochemistry) or with 0.1% glutaraldehyde (for immunoelectron microscopy) in 0.1 M PB (pH 7.4). The T8–T12 segments of spinal cord were dissected out and immersed in the 4% formaldehyde fixative at 4°C overnight followed by cytoprotection in PB containing 30% sucrose for 1–2 days at 4°C. The spinal cord segments were embedded in an OCT compound and were cut serially in the horizontal plane at 25 μm by a cryostat and mounted on gelatin-coated slides. The selected sections were incubated with Cy3-conjugated streptavidin to visualize BDA-containing corticospinal axons via fluorescence microscopy.
For immunoelectron microscopic processing, the BDA tracing spinal cord was cut in the horizontal plane with a vibratome (Leica, Germany) into sections with a thickness of 100 μm and collected in 0.1 M PB (pH 7.4). The selected sections of transection spinal cord were stained with an ABC elite kit and visualized with diaminobenzidine. Briefly, free floating sections were rinsed three times, 10 min each, in TBST (50 mM Tris-buffered saline, pH 7.4), then incubated overnight with an avidin–peroxidase complex at 4°C. On the second day, after three 10-min rinses in TBST, the sections were visualized with 0.025% diaminobenzidine (Sigma, St. Louis, MO, USA) containing 0.003% H2O2 for 15–30 min. Following buffer washes, sections were prepared for electron microscopy as described below. Selected sections were postfixed for 15 min in 2% glutaraldehyde in PBS, washed by sodium cacodylate buffer overnight, then fixed in 2% osmium tetroxide solution for 1 h, dehydrated in an ascending alcohol series, and embedded in Epon 812. Selected areas of the transection site were dissected out, and ultrathin sections (70 nm thick) were cut and collected on formvar-coated nickel slot grids and stained with uranyl acetate for 30 min. The sections were examined using a CM12 Philips electron microscope.
Electrophysiology
Ten weeks after the spinal cord surgery, 24 rats (n = 6 in each group) were deeply anesthetized with ketamine (40 mg/kg) and 1% sodium pentobarbital (30 mg/kg) and stereotaxically fixed to undergo electrophysiological testing. Motor-evoked potentials (MEPs) were elicited by electrical stimulation of the sensorimotor cortex, located 2 mm lateral to midline and 2 mm caudal to bregma. Single pulse stimulation 50 ms in duration at a frequency of 5.1 Hz and with a voltage density of 0.01 V was employed. MEPs were recorded simultaneously from the T12 and L1 levels of the spinal cord using bipolar electrodes (active silver midline epidural electrodes; reference needle electrodes inserted into the paraspinal muscles). At least 2 MEP averages of 50 responses were obtained and stored (BL-410E Data Acquisition Analysis System for Life Science, Taimeng, China) for each animal with stimulation of the right and left sensorimotor cortex (gain parameter 2,000, time constant 0.01 s, filtering 300 Hz). The presence or absence of MEPs at each level was confirmed, and the amplitude and latency of recorded averages were analyzed.
To ensure that the MEPs were related to regenerating descending nerve fibers, one rat from each group was used to perform spinal cord retransection to evaluate the degree of regenerating descending nerve fibers control of hind limb locomotor function after recording MEPs of all groups. The animal was incised to expose the original transection site (T10). The whole graft tissue was removed using microscissors. The rats survived for 2 weeks, and then MEPs tests were performed.
Immunohistochemical Staining
Following the behavioral testing and evoked potentials recording, four groups of 10 rats each were perfused by 4% paraformaldehyde in 0.1 M PB (pH 7.4). Spinal cords were removed, postfixed overnight in the paraformaldehyde, and cryoprotected in 0.1 M PB containing 30% sucrose at 4°C. Longitudinal cryosections (25 μm thickness) of spinal cord were cut and mounted on gelatin-coated slides for immunostaining. Primary antibodies used are as follows: mouse anti-human TrkC (a mouse monoclonal IgG, 1:500, R&D Systems, Minneapolis, MN), mouse anti-GFP (1:400, Chemicon), mouse anti-growth associated protein 43KD (GAP-43), mouse anti-oligodendrocyte special protein (clone CE-1, alternate name: MOSP, 1:1,000, Chemicon), mouse anti-postsynaptic density (PSD95, 1:500; BD), mouse anti-chondroitin sulfate proteoglycans clone CS-56 (CSPG; 1:400, Sigma), mouse anti-microtubule-associated protein-2 (MAP-2) antibody (1:500; Sigma), mouse anti-glial fibrillary acidic protein (GFAP) antibody (1:200, Chemicon), mouse anti-adenomatous polyposis coli (APC) antibody (1:1,000, Calbiochem), and mouse anti-integrin αM [CD11b] (OX42) antibody (1:100; Chemicon); rabbit polyclonal anti-laminin (1:300, Boster, China), rabbit anti-synapsin (1:500; Sigma), rabbit anti-choline acetyl transferase (ChAT, 1:500; Chemicon), rabbit polyclonal anti-GFAP (1:80, Sigma), rabbit polyclonal anti-serotonin (5-HT, 1:200, Sigma), rabbit polyclonal anti-calcitonin gene-related peptide (CGRP, 1:8,000, Chemicon), and rabbit polyclonal anti-neurofilament 150KD (NF-150, 1:400, Chemicon). Cy3-conjugated goat anti-mouse IgG and Cy3-conjugated rabbit anti-goat IgG (1:800, Jackson Immunoresearch Labs, Inc.), Fluorescein isothiocyanate (FITC)-conjugated goat anti-mouse IgG and FITC-conjugated goat anti-rabbit IgG (1:200, Jackson Immunoresearch Labs, Inc.) were used as secondary antibodies. Sections were washed three times with PBS and incubated with 10% normal goat serum with 0.3% Triton X-100 in PBS for 30 min at room temperature. Incubations with appropriate primary antibodies were performed overnight at 4°C. After repeated washing with PBS, sections were incubated with their respective secondary antibodies for 1 h at 37°C, washed with PBS, coverslipped, and examined under the fluorescence microscope.
Immunofluorescent double-labeling was performed to assess the survival and differentiation of transplanted MSCs. The transplanted MSCs from GFP transgenic rats were identified by a mouse anti-GFP antibody and visualized with FITC-conjugated goat secondary antibodies. Rabbit polyclonal anti-NF150 (for neurons) was used to identify the surviving MSCs that had differentiated into neurons. MOSP antibody was used to identify the surviving GFP-MSCs that had differentiated into oligodendrocytes.
Cell count of surviving cells was conducted in 10 longitudinal spinal cord sections from the injury site described in a previous study (21). The surviving GFP-positive MSCs were counted in three randomly selected unit areas (0.09 mm2), delineated by a calibrated reticule eyepiece, covering the entire the lesion site of each section. The average number of GFP-positive cells from the unit areas was designated as the number of surviving cells and used for comparison. Differentiated neuron-like cells and oligodendrocyte-like cells were also counted in the unit areas and expressed as a percentage of total surviving engrafted cells for use in comparison analysis.
Quantitative analysis of 5-HT and BDA-positive nerve fibers was performed as reported in a previous study (20, 21). A calibrated reticle eyepiece was used to delineate regions at 300 μm rostral to the transection site, at the transection site, and at 300 μm caudal to the transection site [see reference (21)—Additional file 1: PDF1 for a sketch of the injured spinal cord used to clarify the location of quantification]. The nerve fiber profiles were quantified in all regions at 200x magnification. The spinal cords were cut in longitudinal sections, and every fifth section was mounted on a gelatin-coated slide. Ten sections per rat were analyzed, and the total number of labeled fibers in all regions of each experimental group was averaged. The 5-HT and BDA-positive fibers longer than 50 μm were counted as positive fibers.
Immunoelectron Microscopy
Ten weeks after transplantation, animals were perfused intracardially with 0.9% saline followed by 400 ml of fixative consisting of 4% paraformaldehyde + 15% saturated picric acid + 0.1% glutaraldehyde in 0.1 M phosphate buffer at pH 7.4. T8–T12 spinal cord segments were removed, postfixed overnight at 4°C in fresh fixative without glutaraldehyde and subsequently cut into 100-μm sagittal sections on a vibratome. To improve the penetration of antibodies, vibratome sections were transferred into cryprotectant solution containing 25% sucrose and 10% glycerol in 0.1 M PBS overnight at 4°C, followed by a quick freeze–thaw in liquid nitrogen for three times. After washing with PBS, the sections were treated for 1 h with 20% goat serum to block nonspecific binding of the antibody. The sections were immunostained with rabbit anti-GFP antibody (1:400, Molecular Probes) for 48 h at 4°C. Sections were then incubated with 1.4 nm immunogold-labeled goat anti-rabbit IgG antibody overnight at 4°C, and then postfixed with 2% glutaraldehyde in 0.1 M PBS for 20 min. These sections were washed, and then silver enhancement with HQ silver Kit (NP 2012) was added. The sections were then postfixed with 2% OsO4 in 0.1 M PBS, dehydrated in a graded series of ethanol concentrations, and flat-embedded in Epon 812. The tissue blocks were cut into ultrathin sections (70 nm thick) and collected on formvar-coated nickel slot grids and stained with uranyl acetate. The sections were examined using a CM12 Philips electron microscope.
Western Blot Analysis
After 8 weeks of surgery, 16 rats were sacrificed (4 rats/group). The spinal cord was immediately removed, and the spinal segments (0.5 cm) containing the lesion site were dissected and homogenized on ice in lysis buffer (7 M urea, 2 M thiourea, 4% CHAPS, 0.5% Biolytes pH 5–8, 0.5% Triton X-100, and 1% cocktail) using homogenizers. Homogenates were centrifuged at 12,000xg for 15 min at 4°C. The supernatant was collected and stored at −80°C for Western blot analysis. The protein concentration was assayed according to the Bradford method with bovine serum albumin (BSA) as the protein standard. Equal amounts of protein (50 μg) were then loaded on a 10% sodium dodecyl sulfate-polyacrylamide gel (SDS-PAG) and followed by electrophoresis for 1 h at 150 V. Proteins were transferred from the gel to a nitrocellulose membrane for 2 h at 250 mA. After blocking nonspecific binding sites with 5% nonfat milk in TBST (0.5% Tween 20 in TBS) for 1 h at room temperature, the membranes were incubated with rabbit anti-GFAP (1:1,500, Sigma), mouse anti-GAP-43 (1:1,000, Sigma), mouse anti-CSPGs (1:1,000, Sigma), rabbit anti-laminin (1:500, Boster), and rabbit anti-β-actin (1:1,000, Cell Signaling, USA) overnight at 4°C, respectively. After washing, the members were treated with a horseradish peroxidase (HRP)-conjugated secondary antibody (goat anti-rabbit or goat anti-mouse, 1:5,000, Jackson, USA) for 2 h at room temperature and then washed repeatedly. The protein bands were visualized by enhanced chemiluminescence (ECL) detection reagents (Applygen Technologies, Inc., Beijing, China) and exposed onto X-films for 1–5 min. The area and densities of the protein bands were quantified using Scion image software (version 4.0). The band density values for samples were expressed by the ratio of relative intensity to the level of β-actin.
Data Analysis
Data were given as the means ± standard deviation. They were analyzed using one-way ANOVA or repeated-measure ANOVA by statistical software SPSS12.0. The least significant difference (LSD) test was applied for post hoc test with one-way ANOVA. The significance level was set at p < 0.05.
Results
Analysis of Transgene Expression
MSC cultures were efficiently transduced with adenoviral vectors encoding LacZ or NT-3 receptor (TrkC) (m.o.i. 300) (Fig. 1A, B). High levels of transgene expression were seen in vitro; >80% of the cells were labeled 2 days after infection. Transduced cells displayed similar morphology to control MSC cultures, cytotoxicity appeared absent, and control cultures showed no expression of either LacZ or TrkC (not shown). Transgenic MSCs were analyzed for the presence of TrkC using Western blotting 2 days after adenoviral (Ad) vector transduction. Ad-TrkC-transduced MSCs expressed TrkC protein, but TrkC protein could not be detected in nontransduced and Ad-LacZ-transduced MSCs (Fig. 1C). In vivo analysis of transgene expression showed that X-gal staining exhibited β-galactosidase-positive cells in the lesion site and in the vicinity of the grafted area at 10 weeks postimplantation (Fig. 1D). A large number of TrkC-positive GFP-MSCs were detected within or nearby the transplantation region in the TrkC-MSCs + EA group (Fig. 1E). Thus, the results indicated that the expression of the exogenous gene persisted for at least 10 weeks in vivo.
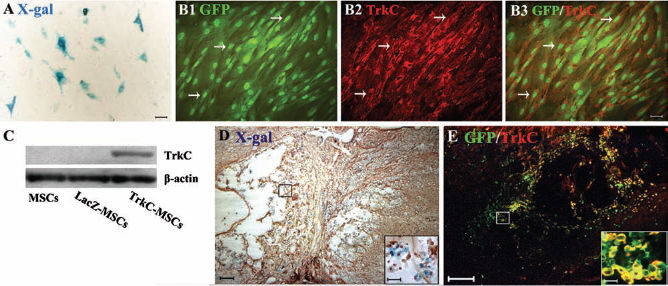
In vitro and in vivo analysis of adenoviral (Ad) vector-mediated transgene expression. (A) X-gal cytochemistry of mesenchymal stem cells (MSCs), 48 h after transduction with Ad-LacZ vector. Less than 80% cultured cells expressed the LacZ gene product. (B) Performing tyrosine kinase receptor type 3 (TrkC) immunofluorescence staining, 48 h after infection green fluorescent protein (GFP)-MSCs with Ad-TrkC. More than 80% cultured cells (green, B1) expressed the TrkC gene product (red, B2). B3 shows the merge of B1 and B2. Scale bars: 20 μm (A, B1–B3). (C) Transgenic MSCs were analyzed for the presence of TrkC using Western blot, 48 h after Ad vector transduction. Ad-TrkC transduced MSCs expressed TrkC protein, but TrkC protein could not be detected in nontransduced and Ad-LacZ-transduced MSCs. (D) In vivo analysis of transgene expression showed that X-gal staining exhibited β-galactosidase positive cells (blue) in the lesion site and the vicinity of the grafted area at 10 weeks postimplantation. Inset in (D) showing the β-galactosidase positive MSCs (blue) at a higher magnification. (E) In vivo confirmation of Ad vector-mediated TrkC expression in the GFP-MSCs (yellow) at 10 weeks after transplantation of TrkC-MSCs. Inset in (E) showing GFP and TrkC double-labeled MSCs (yellow) at a higher magnification. Scale bars: 80 μm (D, E) and 10 μm (insets).
NT-3 Level in Transected Spinal Cord
Four weeks following the spinal cord surgery, the NT-3 concentration in the rostral and caudal segments to the lesion site and the lesion site was measured by ELISA. The mean levels of the NT-3 content in the three segments of injured spinal cord were considered in four groups and presented in Table 1. In all three segments, the NT-3 concentration was significantly increased in the TrkC-MSCs + EA group as compared to the LacZ-MSC group. In the TrkC-MSCs + EA and LacZ-MSCs + EA groups, NT-3 concentrations in the rostral and caudal segments were significantly increased compared to the LacZ-MSC or TrkC-MSC groups. However, NT-3 concentration in the TrkC-MSCs + EA group was not significantly different from that of the LacZ-MSCs + EA group. The results indicate that transplanted TrkC-MSCs combined with EA therapy increased NT-3 level in spinal cord tissue.
Comparisons of NT-3 Content (μg/g) in the Rostral Segment, Lesion Site, and Caudal Segment to the Lesion Site of Spinal Cord Among Four Groups

One-way ANOVA: LacZ-MSCs + EA or TrkC-MSCs + EA groups versus LacZ-MSCs group,
p < 0.05; TrkC-MSCs + EA or LacZ-MSCs + EA groups versus TrkC-MSCs group,
p < 0.05.
In addition, to determine the chief cellular source of NT-3, we performed double-labeling immunofluorescence for NT-3/MAP2 (marks neurons), NT-3/APC (marks oligodendrocytes), NT-3/GFAP (marks astrocytes), and NT-3/OX42 (marks microglia/macrophages). The result showed that some MAP2-positive neurons, APC-positive oligodendrocytes, GFAP-positive astrocytes, and OX42-positive microglia/macrophages were colocalized with NT-3 staining (Supplementary Fig. 1, http://wenku.baidu.com/view/277165c08bd63186bcebbcbc.html?st=1) in the injured spinal cord. The data suggest that NT-3 can be produced by neurons, astrocytes, oligodendrocytes, and microglia/macrophages in the injured spinal cord.
Exogenous NT-3 Promotes Differentiation of TrkC-MSCs In Vitro
In order to determine the effect of NT-3 on differentiation of TrkC-MSCs, we added exogenous NT-3 into the cultured MSCs or TrkC-MSCs to ascertain whether NT-3 could promote the differentiation of TrkC-MSCs into neural cells in vitro. The cells were stained with different cell type markers (NF-150 for neurons and MOSP for oligodendrocytes). The results demonstrated that MSCs differentiated into neural cell types: NF-150-positive neuron-like cells (yellow, Fig. 2A–E) and MOSP-positive oligodendrocyte-like cells (yellow, Fig. 2F–J). The number of NF-150-positive cells in the NT-3 + TrkC-MSC group (Fig. 2D) was the highest among all groups (Fig. 2K). The percentage of MOSP-positive cells was also the highest in the NT-3 + TrkC-MSC group (Fig. 2L). The differention rate of MSCs was the lowest in the MSC group. Statistical analysis showed that NF-150 or MOSP-positive cells in the NT-3 + TrkC-MSC group were significantly higher than that in the MSC, TrkC-MSC, or NT-3 + MSC groups (p < 0.01) (Fig. 2K, L). Moreover, the effect of NT-3 promoting the differentiation of TrkC-MSCs was prevented by application of K252a (a specific inhibitor of neurotrophin-related tyrosine kinase) in the NT-3 + TrkC-MSCs + K252a group. The percentage of NF-150 or MOSP-positive cells in the NT-3 + TrkC-MSCs + K252a group was significantly lower than in the NT-3 + TrkC-MSC group (p < 0.01) (Fig. 2K, L). These results support the notion that NT-3 can promote the differentiation of TrkC-MSCs into neuron-like cells by binding to its receptor TrkC.

Neurotrophin-3 (NT-3) promoting the differentiation of TrkC-MSCs into neuron-like and oligodendrocyte-like cells. (A–E) Neurofilament-150 (NF-150) immunostaining showed that some green MSCs differentiated into NF-150-positive neuron-like cells (yellow, arrows) in the MSCs (A), NT-3 + MSCs (B), TrkC-MSCs (C), NT-3 + TrkC-MSCs (D), and NT-3 + TrkC-MSCs + K252a (K252a, inhibitor of neurotrophin-related tyrosine kinase; i.e., TrkC) (E) groups. (F–I) Myelin/oligodendrocyte-specific protein (MOSP) immunostaining showed that some green MSCs differentiated into NF-150-positive neuron-like cells (yellow, arrows) in the MSCs (F), NT-3 + MSCs (G), TrkC-MSCs (H), NT-3 + TrkC-MSCs (I), and NT-3 + TrkC-MSCs + K252a (J) groups. (K) Cell number counting indicated the percentage of NF-150-positive cells was significantly increased in the NT-3 + MSCs, TrkC-MSCs, NT-3 + TrkC-MSCs, or NT-3 + TrkC-MSCs + K252a groups as compared to the MSC group (*p < 0.01). As compared to the TrkC-MSC group, the percentage of NF-150-positive cells was significantly increased in the NT-3 + MSCs, NT-3 + TrkC-MSCs, or NT-3 + TrkC-MSCs + K252a groups (Δ p < 0.01). In addition, the increase of neural differentiation of MSCs in the NT-3 + TrkC-MSC group was prevented by application of K252a (NT-3 + TrkC-MSC group vs. NT-3 + TrkC-MSCs + K252a group, #p < 0.01). (L) Statistical analyses showed that the percentage of MOSP-positive cells was significantly increased in the NT-3 + MSCs, TrkC-MSCs, NT-3 + TrkC-MSCs, or NT-3 + TrkC-MSCs + K252a groups as compared to the MSC group (*p < 0.01). As compared to TrkC-MSC group, the percentage of MOSP-positive cells was significantly increased in the NT-3 + MSCs, NT-3 + TrkC-MSCs, or NT-3 + TrkC-MSCs + K252a groups (D p < 0.01). In addition, the increase of MOSP-positive cells in the NT-3 + TrkC-MSC group was prevented by application of K252a (NT-3 + TrkC-MSC group vs. NT-3 + TrkC-MSCs + K252a group, #p < 0.01).
Behavioral Assessment
After a complete transection of the spinal cord, the hindlimbs of all rats were paralyzed, and this was accompanied by urinary and fecal incontinence and hematuresis. The hematuresis disappeared 3–7 days later after injection of penicillin. The majority of the animals survived following injury with a few animals succumbing to hindlimb ulcer, self-mutilation, or considerable weight loss 1 month after surgery. In general, there was an obvious loss of body weight postoperation, but the body weight returned to the normal range 4 weeks postoperation. There was no evidence of gross or histological tumors at the site of graft 8 weeks after MSC transplantation.
Hindlimb locomotor activity improved gradually in the four groups throughout the entire follow-up survival period. BBB scores gradually increased over time in each group. BBB scores were significantly higher in the TrkC-MSCs + EA (Supplemental Video 1, http://v.youku.com/v_show/id_XMzM4MDM0NjU2.html) and LacZ-MSCs + EA (Supplemental Video 2, http://v.youku.com/v_show/id_XMzM2NzI0NDU2.html) groups compared to the LacZ-MSCs (Supplemental Video 3, http://v.youku.com/v_show/id_XMzM2NzIyMjky.html) and TrkC-MSCs (Supplemental Video 4, http://v.youku.com/v_show/id_XMzM2NzI1NjE2.html) groups in the period from 4 to 8 weeks postlesion (p < 0.05) (Fig. 3).
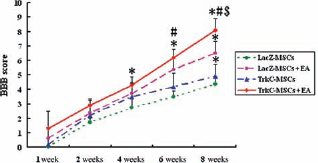
Hindlimb locomotor activity improved gradually in four groups throughout the entire follow-up survival period. Basso, Beattie, and Bresnahan (BBB) scores gradually increased over time in each group. BBB scores were significantly higher in the TrkC-MSCs + EA (EA, electroacupuncture) and LacZ-MSCs + EA groups compared to the LacZ-MSC and TrkC-MSC groups in the period from 4 to 8 weeks postlesion (LacZ-MSCs + EA or TrkC-MSCs + EA groups vs. LacZ-MSC group, *p < 0.05; TrkC-MSCs + EA or LacZ-MSCs + EA groups vs. TrkC-MSC group, #p < 0.05; TrkC-MSCs + EA group vs. LacZ-MSCs + EA group, §p < 0.05).
Motor-Evoked Potentials (MEPs)
At the end of the eighth week following SCI, the MEPs in the LacZ-MSC group were weak, the latencies were prolonged, and the amplitudes were significantly decreased as compared with the other three groups (Fig. 4A). As compared to the LacZ-MSC group, the latencies of MEPs were significantly shorter and the amplitudes were higher in the TrkC-MSCs + EA and LacZ-MSCs + EA groups (Fig. 4A). The restored MEPs in the four groups were abolished by retransection (Fig. 4B), indicating descending axonal regeneration prior to retransection. Statistical analysis indicated that the MEPs in the TrkC-MSCs + EA group displayed shorter latency and higher amplitudes than those in the LacZ-MSC or TrkC-MSC groups (p < 0.05) (Fig. 4C, D). However, there was no significant difference between the TrkC-MSCs + EA and LacZ-MSCs + EA groups (Fig. 4C, D).

Motor-evoked potentials (MEPs) recovery after transgenic MSC transplantation and EA treatment at the end of 8 weeks after transection of spinal cord. (A) In the TrkC-MSCs + EA group, the latencies of MEPs were significantly shorter and the amplitudes were higher than those in the LacZ-MSCs and TrkC-MSC groups. (B) The restored MEPs were abolished by retransection. (C) The latency of MEP at the end of 8 weeks after MSC transplantation and EA treatment. The latency of MEP in the TrkC-MSCs + EA and LacZ-MSCs + EA groups was significantly shortened as compared to the LacZ-MSC group (*p < 0.05). (D) The amplitude of MEP was significantly increased in the TrkC-MSCs + EA and LacZ-MSCs + EA groups as compared to the LacZ-MSC group (*p < 0.05). Although the amplitude of MEP in the TrkC-MSCs + EA group was the highest, there was no significant difference compared to the LacZ-MSCs + EA group (p > 0.05).
Survival and Differentiation of MSCs in Transected Spinal Cord
During the 10 weeks after transplantation, the grafted GFP-MSCs transduced with Ad vectors encoding LacZ or TrkC could easily be identified with fluorescence microscopy. Labeled MSCs were mainly found in the lesion site and were well integrated with the host tissue (Fig. 1D, E). These cells migrated rostrally and caudally into host tissue over the host/lesion interface in the spinal cord. In a longitudinal section of the spinal cord processed for immunfluorescence labeling, the results showed that transplanted GFP-MSCs differentiated into either neuronor oligodendrocyte-like cells. The majority of differentiated neural cells with modified gene were localized in the host/lesion interfaces and the lesion site. The transplanted gene-modified GFP-MSCs partially expressed the neuronal marker (NF-150) (Fig. 5A–D); some of the neuron-like cells in the TrkC-MSCs + EA group emitted a few processes (Fig. 5D, inset). The grafted cells partially expressed the oligodendrocyte marker, MOSP, which generally labels oligodendrocytes and the central nerve myelin but not the peripheral nerve myelin (Fig. 5E–H). Importantly, statistical analysis indicated that the percentage of NF-150/GFP and MOSP/GFP double-positive cells was highest in the TrkC-MSCs + EA group and lowest in the LacZ-MSC group (Fig. 5I) (p < 0.05). Moreover, the percentage of NF-150/GFP and MOSP/GFP double-positive cells in the TrkC-MSCs + EA group was higher than that in the LacZ-MSCs + EA group (Fig. 5I) (p < 0.05). The percentage of NF-150/GFP and MOSP/GFP double-positive cells in the TrkC-MSC group was higher than that in the LacZ-MSC group. The results suggested that TrkC overexpression was beneficial to the neural differentiation of MSCs. Furthermore, cell count showed that the number of GFP-MSCs per unit area in the TrkC-MSCs + EA group was significantly higher than that in other groups (Fig. 5J) (p < 0.05). Additional immunostaining with neuronal markers showed that implanted GFP-MSCs differentiated into more mature neuron-like cells expressing either synapsin, PSD95, and/or ChAT (Fig. 5K–M).
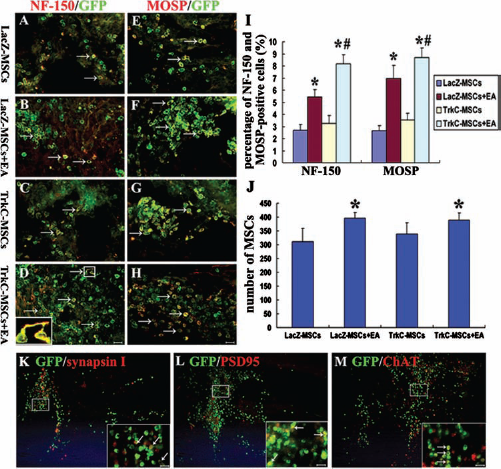
Differentiation of MSCs into neuron-like and oligodendrocyte-like cells at 10 weeks following transplantation. (A–D) NF-150 (red) and GFP (green) double-labeling show the NF-150-positive neuron-like cells (yellow, arrows) in the LacZ-MSCs (A), LacZ-MSCs + EA (B), TrkC-MSCs (C), and TrkC-MSCs + EA (D) groups. Inset in (D) showing some neuron-like cells have a few processes in the TrkC-MSCs + EA group at a higher magnification. (E–H) MOSP (red) and GFP (green) double-labeling show the MOSP-positive oligodendrocyte-like cells (yellow, arrows) in the LacZ-MSCs (E), LacZ-MSCs + EA (F), TrkC-MSCs (G), and TrkC-MSCs + EA (H) groups. (I) Cell number counting indicates the percentage of MOSP-positive or NF-150-positive cells in the TrkC-MSCs + EA group was higher than that in the other three groups (TrkC-MSCs + EA group or LacZ-MSCs + EA group vs. LacZ-MSC group or TrkC-MSC group, *p < 0.05; TrkC-MSCs + EA group vs. LacZ-MSCs + EA group, #p < 0.05). (J) Statistical analyses showed that the number of GFP-MSCs in the TrkC-MSCs + EA group was significantly higher than that in the other groups (LacZ-MSCs + EA or TrkC-MSCs + EA groups vs. LacZ-MSC group or TrkC-MSC group, *p < 0.05). Additional neuronal marker immunostaining showed that implanted GFP-MSCs (green) differentiated into more mature neuron-like cells (yellow) expressing either synapsin (K, red), postsynaptic density (PSD95) (L, red), and choline acetyltransfearse (ChAT) (M, red). Insets in (K–M) show higher magnification images of the rectangle boxes in (K–M). Scale bars: 20 μm (A–H), 80 μm (K–M), and 20 μm (insets in K–M).
To further investigate whether the grafted cells could establish structural and functional connection among themselves or with host cells in the TrkC-MSCs + EA group, we performed immunoelectron microscopy using a GFP antibody. GFP-positive grafted cells were visible within the lesion site and the grafted cells exhibited long extending processes (Fig. 6A). GFP reaction products were localized in the cell nucleus and cytoplasm (Fig. 6A1, B1). Electron-dense junctions were often identified between these cells in the lesion site. GFP-positive transplant-derived cells projected a long neurite and making synapse-like junctions with other cells (Fig. 6A, B). Intercellular synapse-like junctions were identified by focal electron-dense cell membranes, likely representing presynaptic and postsynaptic structures with an intervening space (Fig. 6A2, B2, B3). Remarkably, an aggregation of flattened vesicles was seen in the cytoplasm of the GFP-positive cell on one side of the junction (i.e., presynaptic terminal) adjacent to the synaptic cleft. Moreover, a thin zone of postsynaptic densities, a characteristic feature of symmetric synapse (Type II synapses) and considered to be inhibitory, was observed (Fig. 6A2, B2, B3). In addition, some cells that appeared to give rise to myelin profiles seemingly encircling the axons within the lesion site were GFP-immunopositive in their cytoplasm and cell nucleus (Fig. 6C). Taken together, the morphological evidence suggests that transplanted GFP-positive cells at the lesion site could not only differentiate into neurons forming synapse-like junctions between the transplant-derived neurons and host neural cells but could also differentiate into myelinating cells.
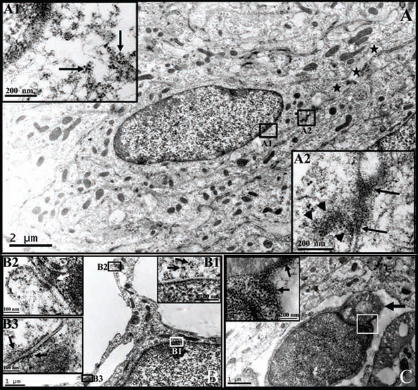
Immunoelectron microscopy images show the differentiation of GFP-positive transplant-derived cells into neuron-like cells and oligodendrocytes within the lesion site in the TrkC-MSCs + EA group. (A–B) GFP-positive grafted cells were visible within the lesion site and the grafted cells extended long processes (A, black stars). GFP reaction products (gold particles and silver enhanced, black arrows) were found in the nuclei and cytoplasm of cells (insets A1 and B1 show higher magnification images of the rectangle boxes in A and B). The electron-dense junctions were often found between these cells in the lesion site. The GFP-positive cell made synapse-like junctions with other cells (insets A2, B2, and B3 show higher magnification images of the rectangle boxes in A and B). Intercellular synapse-like junctions commonly were judged by focal electron-dense cell membranes, likely representing presynaptic and postsynaptic structures, plus a space between them (A2, B2, B3). (A2) Many flattened vesicles (black arrowheads) were seen in the cytoplasm of GFP-positive cell on one side (presynaptic terminal) of the synapse-like structure (black arrows). (B2) A neurite terminal of GFP-positive neuron-like cell made a synapse-like injunction with a terminal of another process from other cell. A cluster of small flattened vesicles (white arrow) existed in the neurite terminal of GFP-positive neuron-like cell. (B3) Another synapse structure is the axon-axon synapse. A few small vesicles (black arrows) were seen in the terminal on both side of synapse. (C) Shows a GFP-positive cell body giving rise to the myelin profiles encircling an axon within the lesion site. Some GFP reaction products (gold particles and silver enhanced, black arrows) exist in the cytoplasm and nucleus of the transplanted cell (inset in C).
Axonal Regeneration
Axonal regeneration was assessed by immunohistochemistry and anterograde labeling. Immunostaining labeled 5-HT fibers originate in brain stem nuclei, especially in the raphe nuclei, and project throughout the longitudinal extent of the spinal cord. A few 5-HT-positive fibers in the LacZ-MSC group crossed the rostral host/lesion interface into the lesion site (Fig. 7A, a). 5-HT-positive fibers were present in the rostral host tissue near cysts in the vicinity of the central lesion site, and a few 5-HT-positive fibers passed along the margins of the cysts. In the LacZ-MSCs + EA group, there were more 5-HT-positive fibers in the rostral spinal cord crossing the rostral host/lesion interface into the lesion site, and two of the six animals had visible 5-HT-positive fibers in the host tissue caudal to the lesion site (Fig. 7B, b). In the TrkC-MSC group, some 5-HT-positive fibers extended into the lesion site, and one of the six animals had 5-HT-positive fibers crossing the host/lesion interface into the host caudal cord (Fig. 7C, c). Unexpectedly, four of the six TrkC-MSCs + EA animals had visible 5-HT-positive fibers in the host tissue caudal to the lesion site (Fig. 7D, d), and the number of fibers in the rostral spinal cord crossing the rostral host/lesion interface into the lesion site was dramatically increased in the TrkC-MSCs + EA group (Fig. 7E).

Serotonin (5-HT)-positive nerve fibers in the injured spinal cord at 10 weeks following surgery. (A–D) A longitudinal section of the spinal cord shows 5-HT positive fibers in the LacZ-MSCs (A), LacZ-MSCs + EA (B), TrkC-MSCs (C), and TrkC-MSCs + EA (D) groups. (a–d) Higher magnification images of the rectangle boxes in (A–D). Scale bars: 320 μm (A–D) and 40 μm (a–d). (E) Comparison of the number of 5-HT-positive fibers in the lesion site and the region immediately rostral to the lesion site among the four groups (TrkC-MSCs + EA or LacZ-MSCs + EA group vs. LacZ-MSC group, *p < 0.01; TrkC-MSCs + EA or LacZ-MSCs + EA group vs. TrkC-MSC group: #p < 0.05).
Axonal regeneration in the cortical spinal tract (CST) was assessed by injecting BDA into the sensorimotor cortex. Although BDA-positive axons were found in the proximally rostral stump of the spinal cord and reached the rostral host/lesion interface (Fig. 8A–D), no BDA-positive axons crossed the rostral host/lesion interface into the lesion site in the LacZ-MSC group (Fig. 8A, a) and TrkC-MSC group (Fig. 8C, c). However, in the LacZ-MSCs + EA group, the BDA-positive axons were found to regenerate through the rostral host/lesion interface and extended into the grafts site but did not pass through the caudal lesion/host interface (Fig. 8B, b). In the TrkC-MSCs + EA group, more BDA-positive axons were shown crossing the rostral host/lesion interface and extending into the grafts site (Fig. 8D, d1). Unexpectedly, one of the five TrkC-MSCs + EA animals had visible BDA-positive fibers in the host tissue caudal to the lesion site (Fig. 8D, d2). Ultrastructural analysis further revealed BDA-labeled terminals were frequently found in the lesion site in the TrkC-MSCs + EA group (Fig. 8E, F). Quantification of the BDA-positive axons in the region rostral to the lesion site indicates that the number of the BDA-positive axons was markedly increased in the TrkC-MSCs + EA group (8.50 ± 2.01) and LacZ-MSCs + EA group (6.25 ± 1.85) as compared to the LacZ-MSC group (2.00 ± 1.41) or TrkC-MSC group (2.25 ± 1.72) (p < 0.01) (Fig. 8G); However, there was no significant difference between the TrkC-MSCs + EA group and LacZ-MSCs + EA group. In the lesion site, BDA-positive fibers were detected only in the TrkC-MSCs + EA group (1.75 ± 2.06) and LacZ-MSCs + EA group (1.05 ± 1.46).

The regeneration of biotinylated dextran amine (BDA) anterogradely labeled corticospinal tract (CST). (A–D) A horizontal section of spinal cord shows BDA-labeled CST in the LacZ-MSCs (A), LacZ-MSCs + EA (B), TrkC-MSCs (C), and TrkC-MSCs + EA (D) groups. *Transection site in (A–D). (a–d) Higher magnification images of the rectangle boxes in (A–D). Scale bars: 320 μm (A–D) and 40 μm (a–c, d1, d2). Ultrastructural analysis further revealed BDA-labeled terminals (red arrows) were frequently found in the lesion site in the TrkC-MSCs + EA group (E, F). Scale bars: 0.5 μm. The inset in the lower right corner of (E) shows the higher magnification of the rectangle boxes in (E). (G) Comparison of the number of BDA-labeled CST in the lesion site and the region immediately rostral to the lesion site among the four groups (TrkC-MSCs + EA or LacZ-MSCs + EA groups vs. LacZ-MSCs or TrkC-MSC groups, *p < 0.01).
GFAP Expression
GFAP immunohistochemistry showed that GFAP-positive cells were distributed mainly in the host tissue surrounding the injury and cystic cavities; few GFAP-positive cells were identified in the central lesion site in all groups. To examine the interaction of axon regeneration and glial scarring, immunofluorescence double-labeling for NF-150/GFAP (Fig. 9A1–B3) and GAP-43/GFAP (Fig. 9C1–D3) was performed on the TrkC-MSCs + EA group. NF-150-positive and GAP-43-positive axons extended at a variable distance across the GFAP-rich host/lesion interface and in some instances penetrated the lesion site (Fig. 9A3–D3).

Neurofilament /glial fibrillary acidic protein (NF/GFAP) and growth-associated protein 43 KDa (GAP-43)/GFAP immunofluorescence double-labeling revealed the interaction of axonal regrowth and glial scar in the TrkC-MSCs + EA group (B1–B3 are higher magnification images of the rectangle boxes in A1–A3; D1–D3 are higher magnification images of the rectangle boxes in C1–C3). NF-positive or GAP-43-positive nerve fibers (arrows) partially extended across the GFAP (green)-rich host/lesion interface and penetrated cell grafts (A3–D3). Scale bars: 20 μm. (E) The levels of GFAP and GAP-43 protein expression in the injured spinal cord by Western blot. (F) The levels of GFAP and GAP-43 protein was quantified by chemiluminescence and normalized by the loading control (β-actin). The levels of GFAP protein in the TrkC-MSCs + EA and LacZ-MSCs + EA groups were significantly downregulated. The levels of GAP-43 protein was only higher in the TrkC-MSCs + EA group (TrkC-MSCs + EA or LacZ-MSCs + EA groups vs. LacZ-MSCs or TrkC-MSC groups, *p < 0.05; TrkC-MSCs + EA group vs. LacZ-MSCs + EA group, #p < 0.05).
Western blot analysis showed that the levels GFAP protein was higher in the LacZ-MSC group compared to the other groups. The level of GFAP protein was significantly lower in the TrkC-MSCs + EA and LacZ-MSCs + EA groups (p < 0.05) (Fig. 9E, F), suggesting that EA combining with genetically modified MSCs treatment decreased astrocyte proliferation after injury. The expression of GAP-43 protein in the TrkC-MSCs + EA group was significantly higher than that in the LacZ-MSC and TrkC-MSC groups (p < 0.05) but was not different in comparison with the LacZ-MSCs + EA group (Fig. 9E, F).
CSPGs and Laminin
Immunofluorescence double-labeling was performed to assess CSPGs and laminin expression. A notable feature was that CSPGs were mainly expressed in both the lesion site and the surrounding host tissue (Fig. 10A1–D1). Notably, CSPG expression was decreased in the LacZ-MSCs + EA group (Fig. 10B1) and TrkC-MSCs + EA group (Fig. 10D1). However, laminin expression (Fig. 10A2–D2) differed from that of CSPG expression. Laminin expression was increased in both of the TrkC-MSCs + EA (Fig. 10D2) and LacZ-MSCs + EA groups (Fig. 10B2); in some areas within the grafts, it was colocalized with CSPGs (Fig. 10A3–D3).
Western blot analysis showed that the levels of CSPG protein in the TrkC-MSCs + EA and LacZ-MSCs + EA groups were significantly lower than that of the LacZ-MSC group or TrkC-MSC group (p < 0.05) (Fig. 10E, F). Conversely, the expression levels of laminin protein were higher in the TrkC-MSCs + EA group (p < 0.05) (Fig. 10E F).

Immunofluorescence double-labeling was performed to assess the expression of laminin (green) and chondroitin sulfate proteoglycans (CSPGs) (red) in the horizontal section of spinal cord, the LacZ-MSCs (A1–A3), LacZ-MSCs + EA (B1–B3), TrkC-MSCs (C1–C3) and TrkC-MSCs + EA (D1–D3) groups. Scale bar: 160 μm. (E, F) The levels of CSPGs and laminin protein expression in the injured spinal cord by Western blots. (G) The levels of CSPGs and laminin protein were quantified by chemiluminescence and normalized by the loading control (β-actin). Compared with the LacZ-MSCs or TrkC-MSC group, the levels of CSPG protein in the LacZ-MSCs + EA and TrkC-MSCs + EA groups were significantly downregulated (TrkC-MSCs + EA or LacZ-MSCs + EA groups vs. LacZ-MSCs or TrkC-MSC groups, *p < 0.05). The levels of laminin protein in the TrkC-MSCs + EA group were higher than those in other groups (TrkC-MSCs + EA vs. LacZ-MSCs or TrkC-MSCs or LacZ-MSCs + EA groups, *p < 0.05).
Discussion
Our previous study found that electroacupuncture (EA) treatment could increase the NT-3 level of the injured spinal cord (21). In this study, we extended our previous work and further investigated the effect of EA on the survival and differentiation of NT-3 receptor (TrkC) gene-modified MSC (TrkC-MSC) transplantation, axonal regeneration, and functional recovery in rats with transected spinal cords. We found that BBB scales and motor-evoked potentials were significantly improved and that the NT-3 level, the number of vital and differentiated MSCs, and the number of 5-HT-positive and BDA-labeled CST axons in and near the lesion site of the injured spinal cord were significantly increased in the TrkC-MSCs + EA group as compared to other groups that underwent TrkC-MSC or LacZ-MSC transplantation. Furthermore, CSPG and GFAP protein expression was decreased, and laminin and GAP-43 protein expression was increased, correlating with the neuroregeneration and functional recovery in the TrkC-MSCs + EA group.
Our earlier work showed that EA could increase NT-3 levels and stimulate the differentiation of the transplanted MSCs in the injured spinal cord of rats (21). However, the number of neuron-like cells derived from the MSCs is limited. In the present study, we combined TrkC-MSC transplantation with EA treatment to additionally enhance the efficacy of neuronal differentiation. Consequently, we found that the survival and differentiation of TrkC-MSCs into neuron-like and oligodendrocyte-like cells were significantly increased in the TrkC-MSCs + EA group, corresponding to a similar elevation of NT-3 levels. Our data suggest that EA could promote the survival and differentiation of grafted TrkC-MSCs by elevating NT-3 levels in injured spinal cord tissue. NT-3 is a significant member of the neurotrophic factors family and plays an important role during nervous system development, neuronal survival and differentiation, and neuronal repair via a signal transduction pathway (99). In addition, NT-3 may play an important role in regulating the quantity of oligodendrocytes and myelin regeneration following CNS injury and demyelination (40, 63, 77). The tropomyosin-related kinase C (TrkC) is the high-affinity receptor of NT-3. In vivo studies utilizing NT-3 and TrkC knockout mice have provided valuable information with respect to the importance of both ligand and receptor during development of the PNS and CNS (25, 41, 95). Our previous study found that NT-3 gene-modified Schwann cells promote TrkC gene-modified MSCs to differentiate into neuron-phenotype cells in vitro (104). Moreover, NT-3 and its receptor TrkC genetically modified neural stem cells were seeded into poly (lactic acid-co-glycolic acid) (PLGA) polymers to generate an artificial neural network in vitro (98). Furthermore, NT-3 exposure increased the survival and neuronal differentiation of TrkC overexpression neural stem cells transplanted into the rat spinal cord (11). In the present study, in order to examine the effect of NT-3 on the differentiation of TrkC-MSCs, we added the exogenous NT-3 into the cultured MSCs or TrkC-MSCs to observe whether NT-3 could promote the differentiation of TrkC-MSCs into neural cells in vitro. Our results suggested that NT-3 could promote differentiation of TrkC-MSCs into neuron-like and oligodendrocyte-like cells by binding its receptor TrkC. Moreover, the effect of NT-3 promoting the differentiation of TrkC-MSCs was prevented by application of K252a (a specific inhibitor of neurotrophin-related tyrosine kinase). The aforementioned studies have demonstrated that NT-3 binding to its high-affinity receptor TrkC promotes the survival and differentiation of stem cells into neurons and myelinating cells in vitro and in vivo.
In addition, the result of immunohistochemistry and immunoelectron microscopy further demonstrated that the TrkC-MSC-derived neurons could form synapses in the lesion site and express characteristic markers of presynaptic compartments (i.e., synapsin) and postsynaptic compartments (i.e., postsynaptic density protein, PSD95). Immunoelectron microscopic analysis not only confirms the presence of synapses but also uncovers that they are mostly symmetric (type II; inhibitory) synapses formed by TrkC-MSC-derived neurons. In the lesion site, the TrkC-MSC-derived neuron-like cells extended long processes and formed synapse-like structures with other cells (Fig. 6). It is well known that loss of inhibitory neurotransmission is an important mechanism that triggers dysfunction in locomotion pattern generation circuits (11). Bonnor et al. demonstrated very recently that synapses formed between neurons differentiated from transplanted neural progenitor cells and host dorsal column nuclei neurons could relay electrophysiological activity (8). Therefore, therapeutic strategies that promote the formation of synapses in the lesion site of the spinal cord are of great significance to the reconstruction of a segmental neural pathway and the restoration of synaptic connectivity and improved function. We believe that the current study provides data that suggest that EA is advantageous in differentiation of TrkC gene-modified MSCs into neurons, and these donor-derived neurons may play critical roles as interneurons to relay segmental or even some descending neural signals to mediate functional recovery, as evidenced by the hindlimb movement and MEPs data.
Our results also showed significant improvement of BBB scales and MEPs accompanied with the significantly increasing number of 5-HT positive and BDA-labeled CST axons in and near the lesion site of the injured spinal cord in the TrkC-MSCs + EA group. The CST is one of the most important brain tracts that controls motor function. Several studies have reported that the regeneration of lesioned CST axons can be promoted by the application of stem cells (85) and neurotrophic growth factors, such as brain-derived neurotrophic factor (BDNF) (90) and NT-3 (30) in different acute SCI models. Moreover, our previous studies have shown that combining MSCs and EA treatment increased the NT-3 level of the injured spinal cord and promoted the 5-HT positive axonal regeneration (21). Our data showed a positive correlation between the number of BDA-labeled CST and BBB scores (20). Our studies along with others have demonstrated that EA treatment can increase the tissue cAMP level and the expression of neurotrophic factors, such as NT-3, BDNF, nerve growth factor (NGF), and glial-derived growth factor (GDNF) (21, 22, 92). Similarly, several studies (14, 44) have demonstrated that MSCs also secrete a variety of growth factors and cytokines, which can promote axonal growth in vivo (56, 88). Receptors for BDNF and NT-3, tyrosine kinase receptor B and C (TrkB and TrkC), respectively, are present on these axons, and administration of BDNF and NT-3 promotes axonal regenerating and/or sprouting and survival of axotomized neurons at the lesion site or at supraspinal nuclei (30, 33, 39, 56). In addition, we previously observed that the combination of EA and transplanted NSCs may promote the survival of denervated motoneurons in the anterior horn of spinal cord at lumbar segments (L1 and L3) after complete rat spinal cord transection (49). So the results suggested that EA combined with stem cell transplantation could rescue some of the denervated motoneurons after SCI. All in all, our results suggest that descending axons (CST and 5-HT) regenerating across the lesion site into the caudal cord may make new functional contacts with the efferent motoneurons. Furthermore, neurons differentiated from TrkC-MSCs may make synaptic contacts with host neurons to relay the information between the upper and lower segments of the lesion site in the TrkC-MSCs + EA group, and this may provide a structural basis for reestablishment of physiological signal transduction across the lesion site to the caudal cord.
On the other hand, the potential roles of local stem cells should be considered during the recovery of injury. We reported previously that EA could promote proliferation and differentiation of endogenous oligodendrocyte precursor cells (OPCs) and remyelination in the demyelinated site as well as the functional improvement of the demyelinated spinal cord induced by ethidium bromide (35). Thus, it is suggested that EA could mobilize endogenous stem cells or progenitor cells to repair the damaged nervous system to a certain extent. Moreover, MSCs could also activate endogenous neural stem or progenitor cells and facilitate endogenous CNS repair (4, 43). Therefore, in our study, we postulate that TrkC-MSCs combined with EA treatment could also activate endogenous neurogenesis to repair injured spinal cord.
The downregulation of GFAP and CSPG expression and the upregulation of GAP-43 and laminin expression in the TrkC-MSCs + EA group as demonstrated in this study are possible mechanisms or markers for axonal regeneration. It is known that the failure of axonal regeneration after SCI has been attributed in part to the nonpermissive environment of the glial scar (26). The glial scar is predominately formed by reactive astrocytes (26). Although the extracellular matrix (ECM) molecules produced by astrocytes have been shown to inhibit axonal regeneration (3, 61, 62), astrocytes also have been shown to secrete permissive ECM molecules (such as laminin) that promote axonal regrowth as well (62). Thus astrocytes may promote or inhibit regeneration after SCI depending on the balance of growth-inhibiting and growth-promoting ECM molecules that they produce. CSPGs are probably the most important of the inhibitory molecules produced by reactive astrocytes (24, 26, 80). The studies in vivo and in vitro have shown that neurons cease to extend their axons into areas rich in CSPGs (17, 18, 62, 106). Intrathecal administration of Chondroitinase ABC (ChABC, degrades CSPG glycosaminoglycan) following spinal cord injury promoted the regeneration of various axon tracts as well as some recovery of function (10, 66). Mutant mice that are deficient in both GFAP and vimentin (important cytoskeletal proteins that are induced in reactive astrocytes) showed reduced astroglial reactivity, increased supraspinal sprouting, and improved functional recovery after spinal cord hemisection (64, 76). These studies indicate that downregulating GFAP and CSPG expression can promote axonal regeneration after SCI. In addition, GAP-43 is a neurotrophin-dependent membrane bound phosphoprotein found in the axons and growth cones of neurons (47, 73). It is highly expressed in several plastic regions of the nervous system during development (38), following acute peripheral nerve and CNS injuries such as brain and spinal cord trauma (6, 36, 86, 87). GAP-43 contributes to axon sprouting and regeneration in the peripheral nervous system and CNS (1, 2, 28). Astrocytes can also produce growth-promoting molecules including laminin (52), N-cadherin (89), neural cell adhesion molecule (NCAM) (69), and fibronectin (60). Laminin have been shown to be good substrates for axonal regeneration (16, 93). Therefore, in the present study, the TrkC-MSCs + EA combination treatment could promote descending axonal regeneration across injured site to caudal cord due to the increase of NT-3 levels, upregulation of laminin and GAP-43, and the downregulation of GFAP and CSPG proteins.
The underlying mechanism of TrkC-MSCs + EA treatment reducing GFAP and CSPGs proteins expression is still not clear. MSCs may secrete the certain nutrition factors that can inhibit GFAP and promote axonal sprouting (27, 50, 79, 97). In addition, MSCs produce membrane type I matrix metalloproteinase (MT-1 MMP) and matrix metalloproteinase 2 (MMP2) (82). Both enzymes can degrade CSPGs (such as aggrecan and versican) (23, 71). A recent study has reported that MSC transplantation can increase the activity of tissue plasminogen activator (tPA) and decrease the expression of the tPA inhibitor plasminogen activator inhibitor (PAI-1) in astroglia of the peri-infarct area of ischemic brain and further enhance axonal growth (97). The tPA degrades the extracellular matrix (ECM) directly by removing glycoproteins from the ECM (46). Thus, MSC transplantation reduces the glial scar and the expression of inhibitory glycoproteins (CSPGs) by directly expressing matrix metalloproteinases to degrade inhibitory molecules or by increasing tPA in reactive astroglia. In another aspect, studies have reported that EA can reduce the formation of glial scar and the expression of epidermal growth factor receptor (EGFR) and GFAP in the injured spinal cord and promote axonal regeneration (72, 100). In the adult CNS, the EGFR pathway is absent from astroglia (29) but is highly upregulated and activated by proinflammatory cytokine following injury (53, 55, 75). In response to activation of the EGFR pathway, astroglia increase synthesis of GFAP (54) and CSPGs (81). In addition, accumulative evidences demonstrate that EA significantly inhibits inflammation and hyperalgesia in a rat model. The analgesic effect of EA on inflammatory pain in rats may involve an upregulation of endogenous NT-3 and activation of p38 mitogen-activated protein kinase (MAPK) and mediate through the inhibition of spinal glial (astroglia and microglia) activity as well as proinflammatory cytokine production (51, 65, 78, 84). Thus, we speculate that EA could reduce the formation of glial scar by upregulation of NT-3 inhibiting spinal glial activity and proinflammatory cytokine production. The decrease of proinflammatory cytokine production further reduces the EGFR expression and activation of reactive astroglia cells to secrete CSPGs. Thus, TrkC-MSCs + EA treatment with combined capabilities may synergistically downregulate expression of inhibitory molecules such as GFAP and CSPGs, thus modifying the hostile environment in the lesion site that would facilitate axonal regeneration.
In summary, the present results have shown that TrkC-MSC transplantation combined with EA treatment not only increased MSCs survival and differentiation into neurons and myelinating cells that appear to help restore regional connectivity and segmental function through synaptogenesis and remyelination, but also promoted CST and 5-HT axonal regeneration into the lesion site, underlying an increase in motor functional improvement. Our results indicate TrkC-MSC transplantation combined with EA treatment may be a new strategy to treat spinal cord injury patients (57).
Footnotes
Acknowledgments
This research work was supported by research grants from the Chinese National Natural Science Foundation (Nos. 30472132, 30973721), National 863 project (No. 2011 AA020112), and the Emphasis Grant of Social Developmental Field of Guangdong Province (No. 2011A030300004) to Y. S. Zeng, and the Chinese National Natural Science Foundation (No. 81102646), the Natural Science Foundation of Guangdong Province (No. S2011040004895), the Social Developmental Foundation of Guangdong Province (2010B030700008), the Science Foundation of Guangzhou (No. 2012A52061516), the Science and Technology Plan Project Application Foundation of Guangzhou City (No. 2012J4300062), and the Sun Yat-sen University Foundation supported by “the Fundamental Research Funds for the Central Universities” (No. 3161003) to Y. Ding. The authors declare no conflicts of interest.