
Abstract
New treatment paradigms that slow or reverse progression of chronic kidney disease (CKD) are needed to relieve significant patient and healthcare burdens. We have shown that a population of selected renal cells (SRCs) stabilized disease progression in a mass reduction model of CKD. Here, we further define the cellular composition of SRCs and apply this novel therapeutic approach to the ZSF1 rat, a model of severe progressive nephropathy secondary to diabetes, obesity, dyslipidemia, and hypertension. Injection of syngeneic SRCs into the ZSF1 renal cortex elicited a regenerative response that significantly improved survival and stabilized disease progression to renal structure and function beyond 1 year posttreatment. Functional improvements included normalization of multiple nephron structures and functions including glomerular filtration, tubular protein handling, electrolyte balance, and the ability to concentrate urine. Improvements to blood pressure, including reduced levels of circulating renin, were also observed. These functional improvements following SRC treatment were accompanied by significant reductions in glomerular sclerosis, tubular degeneration, and interstitial inflammation and fibrosis. Collectively, these data support the utility of a novel renal cell-based approach for slowing renal disease progression associated with diabetic nephropathy in the setting of metabolic syndrome, one of the most common causes of end-stage renal disease.
Introduction
The incidence and prevalence of chronic kidney disease (CKD) is rising worldwide and especially in the United States (US). There are approximately 85,000 patients (www.unos.org) awaiting kidney transplant in the US; nearly the same number of patients die each year as they undergo end-stage renal disease (ESRD) treatment (dialysis and kidney transplantation). New treatment approaches are required to improve quality of life among CKD and ESRD populations who currently have very limited healthcare options. Evaluation of a recently identified and novel renal cell-based therapy (15) in clinically relevant animal models that simulate human obesity and diabetes may predict the potential impact of these therapies in CKD patients suffering from metabolic syndromes. Such a novel clinical strategy could substantially reduce the fraction of diabetic patients progressing to ESRD.
Understanding the cellular and tissue repair mechanisms of the nephron following chronic insults found in diabetes provides insights into the potential design of novel molecular and cell-based therapeutic approaches to treating disease (3). Recent reports using fate mapping strategies identified the resident renal tubular epithelia, not a specialized progenitor cell (10), as the primary cell source responsible for repairing the kidney (12). Genetic tracing definitively showed that the injured kidney tubular epithelia reenter the cell cycle after injury in order to replace denuded epithelia by self-duplication (12). Taking advantage of these fundamental learnings of kidney repair and regeneration, we recently reported a novel cell-based treatment approach demonstrating the reproducible isolation and expansion ex vivo of a selected population of renal cells enriched for tubular epithelia; their syngeneic implantation directly into the remnant kidney of terminally progressive 5/6 nephrectomized rats stabilized renal function and significantly improved survival (15). These experimental data demonstrate mechanisms of repair in CKD; however, the utility of cell-based therapies in clinically relevant models of CKD have yet to be established.
The recently established ZSF1 rat strain [from a cross of female zucker diabetic fatty (ZDF) and male spontaneously hypertensive heart failure (SHHF) rats] provides an experimental model for translating the potential utility of cell-based therapies for preventing or delaying renal disease progression secondary to type 2 diabetes (4). The metabolic syndrome and the progressive diabetic nephropathy (DN) in the ZSF1 culminate from morbid obesity, severe hyperglycemia, hyperinsulemia and hyperlipidemia, hypertension, and cardiovascular complications that also increase the risk of congestive heart failure (4, 7, 9, 24, 31–34). Herein we evaluated a population of selected renal cells (SRCs), established to have reparative and regeneration ability in various experimental models of renal injury (2, 15, 18), to augment renal tissue function in ZSF1 rats with established CKD. We describe the beneficial effects of syngeneic SRCs on survival and renal structure and function in the context of a clinically relevant disease condition.
Materials and Methods
Study Design and In-Life Analysis
All procedures involving animals were conducted in accordance with National Institutes of Health guidelines and were approved by the Institutional Animal Care and Use Committee of the CRL subsidiary, Piedmont Research Center (Research Triangle Park, NC, USA). The ZSF1 rat strain was obtained from Charles River Laboratories (CRL, Kingston, PA, USA). Six- to 10-week-old obese (Ob) ZSF1 rats were used as syngenic donors. Rats were anesthetized using a standard mixture of isoflurane (Vedco, Inc., St. Joseph, MD, USA; 1.5%) and oxygen (4%), and the kidneys were exposed via an incision to the retroperitoneum. At 18 weeks of age, 2.5 × 10⁶ SRCs in 100 μl of PBS was delivered directly into the parenchyma (depth of 3–5 mm) of each of the anterior and posterior poles of both kidneys via injection through a 23-gauge needle (Becton Dickinson, Franklin Lakes, NJ, USA). SRC-treated obese rats (obese treated, Ob Tx) and age-matched obese untreated controls (obese, Ob) were evaluated through the end of study by serum chemistry and urinalysis. Serum renin was analyzed by ELISA (Cedarlane Laboratories, Burlington, NC, USA) at a 1:10 dilution. Serum adrenocorticotrophic hormone (ACTH) was analyzed by Rules Based Medicine (RBM, Austin, TX, USA) via proprietary bead-based immunodetection.
Urinary protein was evaluated along with in-life serum chemistry and urinalysis using the commercial vendor Antech Diagnostics, Inc. (chosen by Piedmont Research Center, Morrisville, NC, USA). The serum creatinine, blood urea nitrogen (BUN), cholesterol, serum protein, and urine creatinine were used to calculate a filtration composite, while serum calcium, urine phosphate, urine sodium, and urine calcium were pooled to generate the tubule composite, and urine specific gravity and osmolality were combined to give the urine concentrating ability composite. Each data point is centered and scaled by adding or subtracting the mean (depending on the treatment effect relative to control) and then dividing by the standard deviation. The average composite for each renal compartment was plotted against the number of days to death for the five animals that expired during the study period. Male OB-ZSF1 recipient rats were fed a diabetogenic (Purina 5008; Land O' Lakes, Inc., Saint Paul, MN, USA) diet from birth until 31 weeks of age. At 31 weeks of age, all study animals were changed from the diabetogenic diet to a maintenance diet (Teklad 2014, Harlan Laboratories, Indianapolis, IN, USA) and administered subcutaneous insulin strips (pellet eluting 2–4 U of insulin/24 h; Linplant, LinShin; Ontario, Canada) reimplanted every 30–40 days for the remainder of the study. Reintervention with SRCs (obese retreated, Ob ReTx) at 34 weeks of age was tested in five of the seven obese ZSF1 rats that were treated originally at 18 weeks of age. The same surgical procedure used for the initial intervention was used for reintervention with SRCs. Systolic and diastolic blood pressure (BP) were measured and mean arterial BP (MABP) was calculated using a CODA noninvasive tail-cuff BP monitor (Kent Scientific, Torrington, CT, USA).
Selected Renal Cell Culture
Complete methodologies for isolation, characterization, and expansion of SRCs have been previously described (15). Briefly, SRCs were derived from whole kidneys from 6–10-week-old female ZSF-1 obese rats (Charles Rivers Laboratories), 6-week-old female Bio-genic Tomato red fluorophore reporter mice [three different types: sex-determining region Y box 2-Cre recombinase Sox2-Cre), Sine oculis homeobox 2 (Six2)-Cre, and homeobox B7 (HoxB7)-Cre from Benjamin Humphreys Lab, Boston, MA, USA] and 5-week-old female Lewis rats (Hilltop Lab Animals, Scottdale, PA, USA). SRCs isolated from kidneys were enzymatically digested and selected under culture conditions previously described (15). Unfractionated cells were harvested and separated on an iodixanol (Optiprep™ Sigma Aldrich, St. Louis, MO) discontinuous density gradient to generate SRCs, a heterogenous population of primary renal cells enriched for tubular epithelial cells.
Immuno-Based Assays
FACS
Cells were phenotypically characterized by fluorescence-activated cell sorting (FACS) using a FACS Aria (Becton Dickinson) and data analyzed with FlowJo (Tree Star, Ashland, OR, USA) software. Paraformaldehyde-fixed cells were stained for surface expression markers with anti-Aquaporin-1 (AQP1) (ab9566, Abcam, Cambridge, MA, USA), anti-Tamm-Horsfall glycoprotein (THP) (BT590, Biomedical Technologies, Stoughton, MA, USA), anti-Dolichos biflorus agglutinin (DBA) (B-1035, Vector Labs, Burlingame, CA, USA), and anti-platelet endothelial cell adhesion molecule (PECAM/CD31; 555025 BD Pharmingen, San Diego, CA) overnight at 4°C with 1 μg/ml primary antibody/million cells using surface staining buffer 0.2% (v/v) bovine serum albumin (BSA), 0.05% (w/v) sodium azide in phosphate-buffered saline (PBS) (BD Pharmingen). Cells that were stained with anti-cytokeratin 8/18/19 (ab41825, Abcam) were permeabilized and blocked with 10% (v/v) goat serum, 0.2% (v/v) Triton X-100, and 0.05% (w/v) sodium azide in PBS (all from Sigma-Aldrich) for 30 min at room temperature (RT). After cell permeabilization, primary antibody was added at a concentration of 1 μg/ml primary antibody/million cells in staining buffer containing 2% (v/v) goat serum, 0.2% (v/v) Triton X-100 in PBS, and incubated overnight at 4°C. Secondary antibody (Invitrogen, Carlsbad, CA, USA; 1 μg/ml) was added for 30 min and washed prior to FACS analysis.
Immunohistocytochemistry (IHC)
The biogenic mice cells (e.g., Six2-Tomato) were isolated using previously described methods for unfractionated cells (15) and seeded onto eight-well chamber Millicell EZ slides (Millipore, Billerica, MA, USA) at a concentration of 50,000 cells/cm2 in 0.5 ml of kidney growth medium, 50:50 Dulbecco's modified Eagle's medium (DMEM), supplemented keratinocyte serum-free medium (KSFM) including 5% FBS and insulin, transferrin, and selenium (ITS), and Anti-Anti (antibiotic-antimycotic) (Gibco, Grand Island, Ny, USA).
Cultures were fixed with 2% paraformaldehyde (Electron Microscopy Services, Hatfield, PA, USA) in PBS and washed gently. Cells used for surface antigen targeting (AQP1, THP, DBA, and PECAM) were blocked with 0.5 ml/well with 3% BSA in PBS for 30 min. Cells targeted for intracellular staining (pan cytokeratin) were blocked with 5% BSA/0.1% Triton X-100 in PBS. Primary antibodies concentrations are as follows: anti-1:1,000 AQP1 (ab9566, Abcam), 1:500 THP (BT590, Biomedical Technologies), 1:100 DBA (B-1035, Vector Labs), 1:100 CD31 (14-0311, ebiosciences), 1:100 pan cytokeratin (C2562, Sigma Aldrich). Isotype-matched secondary antibodies conjugated to Alexa647 or cyanine 5 (Cy5) (Invitrogen; 1:500) were incubated for 1 h at room temperature. DAPI nuclear stain (D9542, Sigma Aldrich) was added for 10 min at a concentration of 0.5 μg/ml, and the cells were gently washed and the slides were mounted with cover slips. The chamber slides were then analyzed, and multicolored images were captured using a Nikon D-Eclipse C1Si confocal microscope (Melville, NY, USA) and excitation wavelengths of 404, 561, and 638.8 nm. Images were pseudocolored blue for nuclear, red for Six2+, green for Alexa 647/Cy5-positive cells. Quantitative image analysis was performed using SimplePCI software (Hamamatsu, Sewickley, PA, USA). For tissue plasminogen activator inhibitor-1 (PAI-1) staining, rat kidneys were formalin fixed, processed for paraffin embedding, sectioned, and stained using similar standard IHC protocols (Premier Laboratory, Boulder, CO, USA). Quantitative densitometric image analysis was performed on anti-PAI-1 (ab28207, Abcam), stained sections from Obese-treated and nontreated ZSF1 rats following standard protocols (Premier Laboratory).
Western Blotting
Kidney tissues were snap-frozen in liquid nitrogen and homogenized using a mortar and pestle prior to lysis and probed according to previously published methods (15). The following antibody dilutions were used: 1:5,000 anti-βActin (A5441, Sigma-Aldrich), 1:250 anti-CD3 (ab5690, Abcam), 1:500 anti-CD68 (ab31630, Abcam), 1:500 anti-nuclear factor κ-light-chain-enhancer of activated B-cells (NF-κB) p65 (ab7970, Abcam), 1:200 anti-Lamin B1 (ab16048, Abcam). Following primary incubation, blots were probed for 2 h at room temperature with appropriate secondary antibody conjugated to horse radish peroxidase (Life Technologies). Blots were developed with ECL Advance Western Blot Detection Kit (GE Healthcare, Pittsburgh, PA, USA).
Enzyme-Linked Immunosorbent Assays
Urine samples were diluted 1:1.5 for chemokine (C-C motif) ligand 2 (CCL2; monocyte chemotactic protein-1; MCP) and CCL5 (regulated and normal T-cell expressed and secreted, RANTES). CCL2 and CCL5 concentrations were determined by ELISAs following the manufacturer's instructions (RayBiotech, Norcross, GA, USA). Absorbance at 450 nm was determined on the FLUOstar Omega microplate reader (BMG Labtech, Cary, NC, USA).
Cell Tracking
Magnetic Resonance Imaging (MRI) Study
SRCs were labeled with (25 μm/ml) Molday Ion Rhodamine-B Super Paramagnetic Iron Oxide (SPIO; Biopal, Inc., Worcester, MA, USA) in KSFM and then transferred to an overnight culture under physiologically relevant oxygen levels (2%) prior to harvest and implant.
Imaging Parameters
The UNC Chapel Hill Biomedical Research Informatics Core (BRIC) small animal imaging facility performed MRI and whole organ optical imaging for the SPIO labeling study. MRI experiments were conducted with Bruker-Biospin 9.4T MRI system (The Woodlands, TX, USA). Volume coil with 35-mm diameter was used to receive the radiofrequency signal. T1-weighted images were acquired with Rapid Acquisition with Relaxation Enhancement (RARE) sequence with echo time/repetition time (TE/TR) = 50/6,000 ms with spatial resolution of 0.156 × 0.156 mm in plane and 0.5 mm slice thickness. T2-weighted images were acquired using RARE sequence with TE/TR = 50/6,000 ms, in plane resolution of 0.156 × 0.156 mm, 0.5 mm slice thickness. T2 relaxation time on ion particle solution was also measured using multislice multiecho sequence. The IVIS-kinetic optical imaging system (Caliper Life Sciences, Hopkinton, MA, USA) was used for optical imaging. DsRed filters were chosen for imaging on rhodamine probes. Prussian blue staining for iron was also performed as per the manufacturer's instructions (Electron Microscopy Services). Images were acquired with 1-s exposure time and medium binning. Fluorescence images were overlaid on photo images.
Nuclear Magnetic Resonance (NMR) Study
SRCs were labeled with Celsense ATM DM-Red 19F (Celsense, Inc., Pittsburg, PA, USA) according to the manufacturer's instructions, transplanted into rat kidney and harvested at time t = 3 h, t = 24 h, and t = 7 days, and then formalin fixed and transferred into PBS. Cell Sense 19F labeled cells in tissue; bisected kidneys were placed into 10-mm NMR tubes with a trifluoroacetic acid (TFA) reference enclosed in a glass capillary tube. 19F NMR-based detection was conducted on a Bruker AVANCE spectrometer operating at 470.6 MHz equipped with a high-resolution 10-mm PABBO BB probe. Scan parameters were 512 averages, spectral range −60 to −100 ppm, and a recycle delay of 1.5 s. One-dimensional 19F spectra were obtained, where both the Cell Sense 19F MRI tracer and TFA appear as single narrow resonances, having a chemical shift difference of −15.58 ppm. The ratio of the integrated areas under these two peaks was used to calculate the total 19F content per kidney. In some instances, kidneys were divided among two tubes, and the 19F content represents the sum of both tubes. To determine the total number of cells retained in each of the kidneys, the labeling efficiency (LE) was measured, and cell number was calculated by dividing the total 19F by the LE (19F/cell).
Histomorphometry
Hematoxylin and eosin and Masson's trichrome staining was performed using the IHC World LLC NovaUltra special stain kit (Woodtsock, MD, USA). The incidence of glomerular sclerotic changes were scored on a 0–2 point scoring system (0, no changes; 1, focal/segmental changes; 2, widespread/global changes). Semiquantitative histomorphology was performed on the end-of-study ZSF1 renal tissue. Tubular and interstitial disease severity was scored on a 0–3 point scoring system (0, no disease; 1, mild; 2, advanced; 3, severe) for the sclerotic and degenerative glomerular (sclerosis), tubular (ectasia), and interstitial (inflammation) measurements. Total scores were normalized for days on study to account for age-related disease progression and adjusted by multiplying age-normalized values by 100. Both the left and right kidney were examined from five animals in each group (n = 10 kidneys).
Statistical Analysis
JMP version 7.0 software (SAS Institute, Cary, NC, USA) was used for all statistical computation. Please refer to the results and figure legends for the data analysis described in the tables and figures.
Results
ZSF1 Model and Study Design
The progressive deterioration of renal function in CKD patients is naturally coupled to the diminishing ability of an organ to repair or regenerate functional renal mass. In the present report, we describe the physiological, functional, and preliminary mechanistic outcomes of implanting a novel population of renal cells with established regenerative properties (15) directly into the renal parenchyma of obese ZSF1 rats with established CKD yet prior to irreversible renal impairment.
ZSF1 rats develop a similar disease progression as seen in humans with diabetes mellitus (DM). Within the first 8 weeks of life, the ZSF1 rats present with the hallmark indicators of metabolic syndrome which includes type 2 diabetes and the initial signs of renal functional impairment, and by 32 weeks of age, ZSF1 kidney structure and function have declined significantly and are consistent with DN (4). We designed a study with the aim of intervening with SRCs at 18 weeks of age, after the onset of significant disease and prior to fulminate DN. By 18 weeks of age, ZSF1 renal function is significantly impaired under the study conditions described herein (Table 1 and Fig. 1). The 1-year life span of the ZSF1 permitted disease classification based on their remaining renal function via estimated glomerular filtration rate or eGFR (Fig. 1A). Using eGFR staging criteria, the ZSF1 rats possessed approximately 65% remaining eGFR function at the time of SRC implant. The loss of renal function in the 18-week-old obese ZSF1 was accompanied by activation of proinflammatory pathways: heightened NF-κB activity, and an increase presence of macrophages and T-cells in the peritubular and periglomerular spaces (arrows) was observed in obese ZSF1 kidney tissue compared to lean control tissues (Fig. 1B, C). At 31 weeks of age a normal diet and insulin were administered in both the treated and untreated study groups for the remainder of the study to help manage the renal protein load and hyperglycemia.
ZSF1 disease progression based on estimated glomerular filtration rate (eGFR). The study timeline for intervention and scheduled necropsy are shown above and correlate to the eGFR timeline: untreated obese ZSF1 (Ob); treated obese ZSF1 [selected renal cell transplant (SRC) (Ob Tx)], retreated obese ZSF1 (Ob ReTx). (A) Using creatinine clearance normalized for body weight as an estimation of GFR, Obese ZSF1 eGFR was plotted over time as a percentage of age-matched Lean ZSF1 controls. (B) Histological analysis: trichrome (scale bar: 200 μm) of NF-kB p65, CD68, and CD3 (scale bar: 100 μm) (arrows, positivity; G, glomeruli) in kidney tissues from lean (Ln) 18-week old ZSF-1 rats were compared to obese (Ob) ZSF-1 rats at 18 and 35 weeks of age; G, glomerulus. (C) Western blot analysis for nuclear p65, Lamin B1, CD3, and CD68 in whole tissue lysates confirms heightened inflammation with ZSF1 age and obesity. Baseline Parameters in 18-Week-Old Lean and Obese ZSF1 Rats Two-tailed t test; p < 0.05.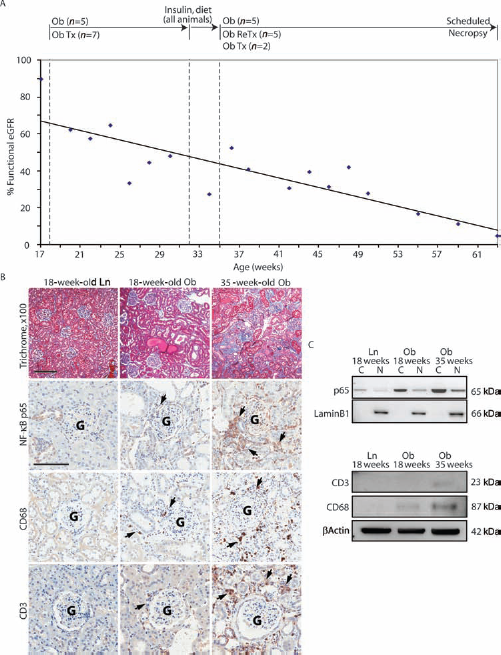

SRC Cellular Composition
We recently reported on the composition of SRCs, a population of selected primary renal cells enriched for tubular epithelia, that are capable of delaying the 1027 progression of kidney disease in a renal mass reduction model of CKD (15). Here, we evaluate lineage tracing within the SRC population using an ex vivo analysis of these cells isolated from mouse strains (12). The biogenic cross between Sox2-Cre (pluripotent stem cell), Six2-Cre (renal epithelia), or HoxB7-Cre (renal collecting duct) with the R26tdTomato reporter permitted tracing of compartment-specific cells labeled with the Tomato red fluorophore under the same cell process conditions described previously (15) and for the ZSF1 cell implantation studies described herein. As expected, the non-labeled cells isolated from control rats (Fig. 2A) were 97.7% negative for the red fluorescent channel (A594), and conversely SRCs isolated from the Sox2-Tomato mice (Fig. 2B) were 96.7% positive for Tomato red in the gate shown. SRCs isolated from Six2- and HoxB7-Tomato crossed strains were reciprocal for the fraction of cells marked positive for their respective cell compartments; Six2-derived cells (Fig. 2C) excluded collecting duct cells (75.6% positive and 21.2% negative for epithelial cells), and HoxB7-derived cells (Fig. 2D) excluded tubular epithelia (82.1 % negative and 14.6% positive for collecting duct cells). The approximate labeling percentage in the epithelial compartments of the mice strains were consistent with the percentages detected in the rat cell populations of the Lewis rat kidneys evaluated in the 5/6 nephrectomy model (15) and the ZSF1 cells presently described for in vivo delivery (Fig. 2E). Fluorescence activated cell sorting (FACS) analysis permitted antibody-based characterization immediately following harvest and gradient selection of the biogenic mouse, Lewis and ZSF1 rat SRCs (Fig. 2E). Traditional antibody-based immunofluorescence (IF) measures for labeling epithelial cell subdivisions of the nephron were applied to the genetic mouse populations that permitted lineage tracing in culture prior to harvest and gradient selection for SRCs (Fig. 2F-K), as rodent cells do not passage in culture very well (unlike human cells). These data show that SRCs are enriched with aquaporin-1-positive (AQP1+) proximal tubular cells (from ~ 30% to 70%) following their gradient selection. The percentage of distal tubular and collecting duct cells remained approximately the same before and after gradient selection of SRCs (~50% and 25% respectively). That the total epithelial population exceeds 100% positivity in the rodent cell populations reflects the promiscuity of antibody-based detection methods and their application across multiple strains and species. Nevertheless, FACS analyses of genetically labeled fluorescent cells preclude antibody pitfalls and definitively show the SRC epithelial composition prior to implantation.
SRC epithelial composition. Percentage positivity of reporter gene (Tomato Red) using fluorescence-activated cell sorting (FACS) analysis of SRCs from three biogenic reporter mouse strains: (A) negative control, (B) total cell positive control (Sox2-Tomato+), (C) tubular epithelial cells (Six2-Tomato+), (D) collecting duct epithelial cells (HoxB7-Tomato+). Upper gates reflect percentage of Tomato+ cells. (E) Graphical representation of epithelial compartment-specific markers using FACS from the Six2 reporter mouse, ZSF1 rat, and lewis rat SRCs. (F–K) Representative confocal merged images showing percentage of positive of compartmental specific markers (green), nuclei (blue), and Tomato+ (red) on preselected cells from Six2-Tomato+ reporter mice in culture (scale bar: 25 μm). (F) Isotype control with Six2-Tomato+ (red), (G) Aquaporin-1 (proximal tubule), (H) Tamm-Horsfall glycoprotein (THP) (distal tubule), (I) Dolichos biflorus agglutinin (DBA) (collecting duct), (J) pan cytokeratin (Pan CK) (epithelial), (K) platelet endothelial cell adhesion molecule (PECAM) (endothelial).
Cell Tracing
An in vivo study was performed to trace ZSF1 renal cells labeled with SPIO (25 μg Fe/ml) for whole organ detection by MRI and fluorescence microscopy (Fig. 3A–D) following their intrarenal transplantation (2.5 × 10⁶ cells resuspended in 100 μl) into the anterior pole of the left kidney in obese diabetic ZSF1 recipient rats. Twenty-four hour urine was collected from the SRCtransplanted rats that were placed directly into a metabolic cage following the implantation procedure to detect SRC loss in the urine. The urine was collected in phosphate-buffered saline (1:1 ratio of PBS/urine) to neutralize the acidity and preserve any live cells that may have been excreted. The urine was absent of iron- and rhodamine-labeled cells. MRI T1- and T2-weighted images (Fig. 3B, C) reveal a region of negative contrast at the anterior pole of the kidney where the cells were injected (white arrow), indicating the reduced T2 relaxation time observed from the ion particle. These data are consistent with whole organ fluorescent imaging (Fig. 3D) highlighting the injection site (arrow) and iron-conjugated rhodamine (yellow, circled) located at the upper cortex of the anterior pole. Sectioning of the whole kidney shown in Figure 3D indicated a bolus of iron-rhodamine-labeled cells (arrows) by fluorescent detection (Fig. 3E) and by Prussian blue for iron (Fig. 3F) migrating and distributing from the cortical injection site, confirming their presence in tubular and peritubular spaces of the cortex and medulla.
Cell tracer detection by MRI and NMR of the left ZSF1 kidney following SRC delivery. (A) Confocal image of ZSF1 SRCs labeled with super paramagnetic iron oxide particles (SPIOs) (red), nuclei (blue) prior to implant showed a high labeling efficiency (~95%) of SPIOs compared to unlabeled controls (boxed inset) (scale bar: 50 μm). (B, C) Whole kidney imaging by high-resolution (100 mm) T1-wtd MRI and T2-wtd MRI following delivery post 24 h of ZSF1 SRCs labeled with the SPIOs (arrow, injection site). Inset: Top control, MRI SPIO-labeled cells in suspension (gray); bottom control, water (white). (D) Whole kidney IVIS-kinetic fluorescent optical image of implanted SRCs (yellow) using DsRed filters for rhodamine (arrow, injection site). (E) Rhodamine-labeled cells (arrows) and (F) iron-labeled cells detected by Prussian Blue (arrows) were captured in the representative images (scale bar: 100 μm) of sectioned tissue using the whole kidney from (B) to (D). (G) Confocal image of ZSF1 SRCs labeled with Celsense (19F) CS-DM-Red (red), nuclei (blue) prior to implant showed a high labeling efficiency (~95%) of CD-DM-Red (19F) compared to unlabeled controls (boxed inset) (scale bar: 50 μm). (H) NMR spectroscopy (500 MHz 10 mm probes) of the left ZSF1 kidney harvested from ZSF1 rats at 0 h, 3 h, 24 h, and 7 days (n = 1) following implantation of SRCs labeled with Cell Sense (19F) CS-DM-Red.
In parallel to the qualitative MRI-based cell detection study, an in vivo study was performed to trace ZSF1 renal cells labeled quantitatively with 2 mg/ml of the perfluorocarbon tracer Cell Sense DM-Red 19F by NMR (Fig. 3G, H). To control for cell detection, we injected a freshly harvested kidney (t = 0 h) with 2.5 × 10⁶ cells resuspended in 100 μl to represent the maximum baseline detection of the 19F label by NMR spectroscopy. The robust detection of 19F-labeled cells at 3 and 24 h following implantation confirms their early retention in the kidney and the diminished yet significant detection of 19F 7 days following the transplantation procedure. SRC retention was consistent with the detection of these cells previously reported in the 5/6 nephrectomy mass reduction model using both sex-determining region y (SRy) gene detection and fluorescence in situ hybridization (FISH) for y chromosome (male donor cell detection in female recipients) and cell membrane PKH-26 dye-labeled studies (15).
Survival
A previous report described the ZSF1 survival to be approximately 48 weeks of age (31). We measured survival of the ZSF1 rats under the conditions described herein up to 63 weeks of age (45 weeks on study). Only one of five untreated ZSF1 rats survived the study (80% mortality) compared to six of seven surviving animals in the treated group (1/7, <15% mortality). The Kaplan–Meier survival plot compares treated obese (Ob Tx) ZSF1 to obese (Ob) (Fig. 4A); all of the lean animals were alive at the end of study. The open retroperitoneal transplantation procedure for the intraparenchymal delivery of 2.5 million cells suspended in 100 μl of PBS (using a 23.5-gauge needle and syringe) to both the anterior and posterior poles of both kidneys was well tolerated by the diseased rats. Compared to the Ob control group, treatment with SRCs significantly extended survival (p = 0.0036 using a log rank test of days on study) compared to the untreated controls.
SRCs significantly affected multiple measurements of renal function representing the major kidney compartments (glomerular, tubular, collecting duct) at multiple time points (discussed below) (Figs. 4B, 5, 6). Composite representation of these compartmental effects provides a more complete view of the impact of SRCs to the nephron (Fig. 4B). The filtration composite combined the analysis of blood urea nitrogen (BUN), serum and urine creatinine, and serum cholesterol; the tubular composite combined measures of serum and urine calcium and phosphate; urine concentrating ability combined urine-specific gravity and urine osmolality measurements (see Materials and Methods for composite calculation). The composite analysis demonstrates that renal function significantly predict days to death in the ZSF1 under these study conditions (Fig. 4B) and suggest that declining filtration and urine concentrating ability were critically responsible for mortality in this model.
Survival advantage of male obese ZSF1 rats treated with SRCs. (A) Kaplan–Meier plot of obese SRC-treated (Obese Tx) and obese untreated (Obese) survival. Ob-Tx animals lived to an average age of 318 days (80% survival) compared to an average of 278 days for the Ob control group (20% survival). All lean (Ln) control littermates survived to the scheduled end of study, 315– 319 days (100% survival). Days on study (bar graph) compared untreated (Ob), treated (Ob Tx) and lean control (Ln) animal groups. (B) Composite measurements were calculated using the following measurements: Filtration composite combined serum creatinine, blood urea nitrogen (BUN), cholesterol, serum protein, and urine creatinine; the tubule composite combined serum calcium, urine phosphate, urine sodium, and urine calcium; the urine concentrating ability composite combined urine specific gravity and osmolality. Each data point is centered and scaled by adding or subtracting the mean (depending on the treatment effect relative to control) and then dividing by the standard deviation. The average composite for each renal compartment were plotted versus the number of days to death for the five animals that expired during the study period. The p values for each composite represents the significance of an F test comparing error associated with the linear fit versus an average of all the data (p < 0.0001, filtration and urine concentrating composites; p = 0.7846, tubule composite). Improvements to renal filtration and urine concentrating functions were assessed serologically and through urinalysis. (A) The filtration measurements, BUN (mg/dl; top) and serum creatinine (sCr) (mg/dl; bottom) were significantly improved at multiple time points (inset ANOVA at 34 weeks of age: BUN, p = 0.009; sCr, p = 0.004). (B) Measurements of urine concentrating ability, urine osmolality (uOsmol) and specific gravity (uSpGr) were significantly lower at multiple time points (inset ANOVA at 34 weeks of age: uOsmol, p = 0.009; uSpGr, p = 0.005). Values of p are the result of two-tailed t tests. Improvements to tubular function were assessed serologically and through urinalysis. (A) SRC treatment lowered levels of serum calcium (sCa) (mmol/L; top) and phosphate (sPhos) (mmol/L; bottom) were significantly lower at multiple time points (inset ANOVA at 42 weeks of age: sCa, p = 0.020; sPhos, p = 0.030). (B) Urinary total protein (uTP) significantly improved following reintervention with SRCs (inset ANOVA at 63 weeks: uTP, p = 0.024). Time series data were fitted for each group with a second order polynomial. Values of p are the result of two-tailed t tests.


Renal Function Improvements by SRCs
Midpoint Functional Assessment

34 weeks of age or 16 weeks posttreatment;
42 weeks of age or 24 weeks posttreatment.
SRC Effects on Kidney Tissue Architecture
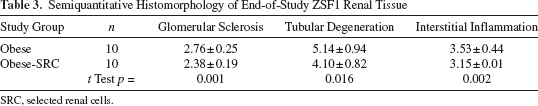
Renal pathology was evaluated following the terminal sacrifice at 63 weeks of age, representing 45 weeks post-SRC implantation (Table 3 and Fig. 7A–F). Glomerular and tubulointerstitial degenerative changes observed in the untreated ZSF-1 controls were significantly attenuated by SRC treatment (Table 3). The glomerular disease, as measured by the incidence of glomerular sclerotic changes, in the obese rats was significantly (p = 0.0032) greater than rats treated with SRCs (2.76 ± 0.25, obese; 2.38 ± 0.19, obese Tx) and was characterized by global and diffuse glomerular sclerosis, severe mesangial proliferation and tuft adhesions, and severe glomerular atrophy. These morphological findings explain the elevated levels of serum creatinine and BUN (Fig. 5A) observed throughout the study and the significantly lower eGFR (ANOVA p = 0.0475) at the end of study in the untreated obese rats. Tubular injury was also significantly increased (p = 0.0259) (Table 3) in the untreated ZSF1 rats compared to SRC-treated rats (5.14 ± 0.94, obese; 4.10 ± 0.82, obese Tx). Tubular degeneration observed in the untreated obese ZSF1 rats was characterized by significantly greater tubular ectasia with severe protein casts and global tubular epithelial cell hypertrophy and hyperplasia of both proximal and distal tubules. The structural changes observed in the tubular segments of the nephron were consistent with electrolyte and mineral imbalances throughout the study and higher levels of urinary protein measured at the end-of-life in the untreated control rats (Fig. 6B). Significantly greater interstitial inflammation and fibrosis (p = 0.039) was also observed in the obese ZSF1 rats (3.53 ± 0.44) compared to the obese SRC-treated rats (3.15 ± 0.01).
End of study comparative renal histopathology. Kidney samples were collected at 63 weeks of age, 45 weeks after the initial SRC intervention. Microscopic representation of renal parenchyma of untreated obese ZSF-1 controls (Obese) (top, A–C) and treated obese ZSF-1 rats (Obese-Tx) (bottom, D–F). (A, D) Low-magnification (10 ×; scale bar: 2 mm) H&E transverse sections of the cortico-medullary parenchyma. (B, E) H&E (100 ×; scale bar: 200 μm) transverse sections of the cortex. (C, F) Masson's trichrome (200 ×; scale bar: 200 μm) transverse sections of the cortex. Analysis of variance (ANOVA) with statistical significances were determined by an unpaired, two-tailed Student's t test. Anti-inflammatory properties of SRCs. (G) Urine from obese-treated and obese untreated ZSF1 study rats was assayed for the nuclear factor κ-light-chain-enhancer of activated B-cells (NF-κB) cytokine, chemokine (C-C motif) ligand 5 (CCL5) (regulated and normal T-cell expressed and secreted, RANTES) by ELISA at regular intervals over the course of the study. Linear regression analysis showed lower CCL5 levels in the obese-treated animals. (H) Tissue protein expression levels of plasminogen activator inhibitor-1 (PAI-1) at the end of study were significantly reduced in the kidneys of obese-treated animals (quantitated by IHC) compared to untreated controls (p value is the result of a two-tailed t test). Semiquantitative Histomorphology of End-of-Study ZSF1 Renal Tissue SRC, selected renal cells.
Anti-inflammatory Properties of SRCs
As an indicator of renal-specific and NF-κB-mediated inflammatory status, urine CCL2 (MCP-1) and CCL5 (RANTES) protein levels were measured by ELISA (17). Consistent with observations in the 5/6 nephrectomy studies, CCL2 expression was unaltered as a result of SRC injection; however, CCL5 moderately increased over time in the untreated controls as disease progressed, and this rate of progression trended lower in the SRC-treated animals (Fig. 7G). CCL5 attenuation following SRC treatment is consistent with the blunted inflammatory response measured histologically (Table 3 and Fig. 7D–F). That proinflammatory markers were attenuated at the end stage of disease prompted us to measure the levels of tissue PAI-1, a central and convergent regulator of fibrosis. PAI-1 levels in the kidney measured by IHC in the end-of-life controls were significantly higher than PAI-1 levels in the end-of-study SRC-treated animals (Fig. 7H). The ability of SRCs to modulate fibrotic and degenerative pathways in the DN kidney is consistent with previous animal data (15).
Miscellaneous Effects of SRCs
Hypertension reflects disease progression in the ZSF-1 model (4, 7, 26, 34, 36). In the current ZSF1 study, we observed a meaningful trend (p = 0.07) in the reduction of mean arteriole blood pressure (MABP) at 50 weeks of age. This partial modulation of blood pressure in the treated Obese ZSF1 rats prompted us to investigate whether these reductions were transmitted to both CNS and renal mechanisms for regulating blood pressure. We measured the blood levels of circulating ACTH, a central and trophic hormone of the hypothalamic–pituitary– adrenal axis central to the regulation of sympathetic activity, and renin, a hormone produced by renal granular cells of the juxtaglomerular apparatus that is a principal component of the renin–angiotensin system involved in autoregulating arterial blood pressure (Fig. 8). Significant reductions in both renin (Fig. 8A) and ACTH (Fig. 8B) support the treatment effects observed on blood pressure. Importantly, these data suggest that the effect of SRC treatment are transmitted physiologically throughout the whole organism to attenuate heightened sympathetic activity associated with ESRD and that targeted delivery of SRCs to the kidney significantly and positively affected the renin–angiotensin–aldosterone system that starts with renin production from the vascular pole of the renal corpuscle.
Impact of SRC treatment on blood pressure regulation. Immunodetection improvements to serum (A) Renin (pg/ml) and (B) adrenocorticotrophic hormone (ACTH) (pg/ml) at multiple sampling ages of the obese-treated, obese untreated, and lean control rats. Lean measurements (green) are presented linearly as the average of all lean time points; obese and obese Tx measurements are bivariate fits using second-order polynomial equations. An analysis of variance (ANOVA) with statistical significances were determined by an unpaired, two-tailed Student's t test by comparing obese untreated animals to the obese treated animals (the lean control group was not included in the ANOVA).
Reintervention
We also tested the feasibility of reintervention, 4 months following the first cell implantation procedure at 35 weeks of age. As shown in Figure 1B, C, more advanced renal sclerosis and leukocytic infiltration are evident in the 35-week-old obese ZSF1 compared to 18-week-old obese and lean ZSF1 rats. With the aim of conditioning the animal prior to reintervention, measures to improve blood glucose levels were introduced at 31 weeks of age; the animals were switched to a nondia-betogenic diet and administered insulin to help control the hyperglycemia. There were no physical or serological adverse effects to the organism following SRC reintervention during this progressive disease state. The filtration, tubular, and collecting duct functional measurements discussed heretofore appeared to be unaffected by SRCs following reintervention at 35 weeks of age. ZSF1 rats that were not retreated (n = 2) appeared to follow similar temporal progression of CKD as the retreated animals (n = 5), suggesting that the effects of early intervention predominate over any effects from reintervention. Interestingly, at the urinary protein was significantly higher (1837 ± 66 g/dl, obese; 1582 ± 84 g/dl obese Tx) in the untreated animals at 55 weeks versus 17 week baseline for intervention p = 0.011; 55 weeks versus 34 week baseline for reintervention, p = 0.025. The significantly improved urinary protein measure in the SRC-treated rats is also shown at the end of study (Fig. 6B, inset). Since urinary protein, a measurement that reflects both the glomeruli and the proximal tubules, reversed course shortly after retreatment, and following a diet change that included less caloric protein quantities indicated that these functional compartments responded to SRC augmentation even under conditions of advanced diabetic nephropathy.
Discussion
Diabetes is the most important risk factor for CKD and ESRD, and because metabolic syndrome contributes to diabetic complications including nephropathy, we studied SRCs in the ZSF1 hybrid rat as the best and most clinically relevant model of renal disease pathogenesis secondary to metabolic syndrome (4). Previously published data and the data here provide evidence that this renal cell-based treatment approach induces reproducible effects on survival across multiple models of CKD as a result of improved renal structure and function (15). The survival data herein are the first to evaluate function, structure, and the lifespan of the ZSF1 rat and under the evaluation of a putative renal-based therapy. The significant extension in survival following ZSF1 SRC treatment was accompanied by significant improvements to renal structure and function at multiple levels of the renal tissue compartments. These results in the ZSF1 model of progressive nephropathy provide a rationale for investigating the affects of this cell-based strategy in patients prior to overt and irreversible CKD.
The natural ability of the kidney to respond to the renal structural and functional impairment during the early phases of metabolic syndrome (27) provides a window for harnessing renal compensatory and repair mechanisms. A recent study using the ZDF model of type 2 DM (a parent strain to the ZSF1 rat) showed that current standards of care with pharmacological intervention using an insulin sensitizer from 6 weeks of age ameliorated diabetes in this model. The authors demonstrate that this early preventative treatment strategy controlled blood glucose prior to the glomerular changes associated with hyperglycemia and proteinuria that led to diabetic nephropathy in both untreated animals and those administered the same insulin sensitizer from 21 weeks of age, after the onset of hyperglycemia and proteinuria (29). This report demonstrates that the timing of CKD therapy is critical for clinical benefit. Similarly, a more recent report showed that intervention at 8 weeks of age with an angiotensin-converting enzyme inhibitor (ACEi) reduced diabetic renal injury in the ZSF1 rat. At 8 weeks of age, the rats already showed signs of renal disease, including protienuria, glomerular extracellular matrix (ECM) deposition and tubulointerstitial inflammation (4). In the current study, we treat obese ZSF1 rats at 18 weeks of age, a period from 8 weeks of life that reflected a worsened state of disease characterized by further impaired renal function and the appearance of focal lesions indicative of progressive DN. At the baseline, these ZSF1 rats presented with severe obesity (body weight ~ 577 g), impaired renal function (uTP ~ 5,929 g/L), severe dyslipidemia (sTrig ~ 5,282 mg/dl or 59.69 mmol/L), hyperglycemia (sGlu ~ 483 mg/dl or 26.81 mmol/L), and significantly impaired ability to concentrate urine (uOsmol ~ 1,150 mosm/kg) at 17 weeks of age. Therefore, the current SRC-based intervention strategy was comparable to treating a patient with progressive CKD secondary to DN. The significant improvements to survival and kidney structure and function reflect widespread affects of SRC treatment on the nephron in established CKD and may present a clinical advantage over the palliative pharmacological treatments that often require multiple, costly, and long-term administration protocols.
Although renal function in ZSF1 rats continued to decline as a result of progressive insult from the background metabolic syndrome, there was a significant improvement in the SRC-treated animals at 30 weeks of age, approximately 12 weeks following implantation (Figs. 5, 6). This onset of the SRC effect is similar to our previously published findings in the 5/6 nephrectomy model and consistent with the early cellular and stromal events that culminated in tissue repair and regeneration following a cell-based tissue engineering approach to augment urinary tract tissue of the impaired bladder (1, 14, 15). The regenerative properties that have been defined by the previously published reports and the current work collectively suggest that these treatment strategies in the urinary track elicit early healing processes ~3 months after intervention, followed by the repair and regeneration of structural components that augment organ function. That kidney function was augmented following SRC transplantation suggests (1) the organ has not lost the ability to compensate for loss of function during a chronic disease state and (2) the functional reserve of the kidney is adaptable to a renal cell-based therapy prior to fulminate and irreversible disease status.
Although the intervention strategy using SRC significantly delayed the progression to ESRD, the limited treatment effects observed with a follow-on dose of SRCs suggests that CKD advanced beyond the fulcrum point that might separate the kidney's intrinsic ability to repair and stabilize the nephron from a period of irreversible disease progression. SRC reintervention, at or near ESRD, did not appear to impact the filtration, tubular, and collecting duct functions, yet urinary protein was significantly affected following the second SRC implantation suggesting initial events of regeneration had been initiated. The limited response of the nephron in ESRD demonstrates that the full regenerative capacity of SRCs was compromised by the background disease state and animal longevity. Nonetheless, SRC treatment during a clinically relevant treatment period impacted multiple kidney functions that delayed ESRD and extended life span compared to untreated controls. The model in Figure 9 supports improved organ function following SRC treatment during a reparative phase prior to irreversible and rapid disease progression.
The impact of SRCs on multiple renal compartments is demonstrated by the broad impact on both structure and function. Relying on any one measurement of renal function, such as eGFR, or any one time period, such as CKD 4/5, underestimates the impact of SRC treatment on the entire organ. When a composite evaluation of the whole organ is used, many functional parameters were shown to be significantly affected by SRCs. The window of regeneration depicted in the current study reflects the early window of opportunity to augment renal function followed by rapid disease progression and overt structural damage in the kidney using potential cell-based therapies.
Although engraftment of SRCs has been demonstrated in 6 months postimplantation (15), this is not likely the only therapeutic mechanism at play for preserving nephron function and delaying overt tissue inflammation and fibrosis. The ability to augment renal function with SRCs might reflect a combination of the ability of the engrafted cell to salvage cellular compartments and the autocrine, paracrine, and perhaps endocrine factors that are transiently and/or constitutively transferred to a recipient diseased cell from the donor cell population. We showed in vivo that SRCs can reduce the heightened inflammatory response modulated through the NF-κB chemokine, CCL5 (RANTES). The inflammatory perturbations that remained unresolved in the absence of SRC treatment prolonged the presence of interstitial inflammatory cells that lead to the sclerotic lesions resulting from among other factors, myo-fibroblast activation (11), and the deposition of excess extracellular matrix (22, 30). These data were accompanied by reduced level of tissue PAI-1 in conjunction with significant histological improvements to renal inflammation, sclerosis, and fibrosis. Collectively, these data suggest that SRCs slows the progression of disease through both direct (engraftment) and possibly through indirect (paracrine) mechanisms that attenuate the fulminate inflammatory processes that lead to organ scarring. Studies aimed at identifying secreted biological mediators that may have anti-inflammatory properties are underway.
Composite measurements as a function of the major renal compartments and whole organ function. Each of the serum and urine renal function measurements used to calculate the compartmental composites from Figure 4B were combined together to form the whole organ composite; each measurement was calculated uniformly on the same 100% scale as % of baseline (each measurement was weighted equally) and composite scores were fitted to bivariate curves using a second order polynomial. The whole organ composite collectively measured BUN, serum creatinine, serum cholesterol, serum protein, serum calcium, urinary sodium, urinary calcium, urinary phosphorous, urinary creatinine, urinary osmolality, and specific gravity. Tx, treatment; ReTx, retreatment; Fmax, maximum function. Green line, Ob Tx; black line, Ob.
The tubular epithelial cell-enriched composition of SRCs defined herein fully supports the hypothesis that tubular epithelium have a central role in renal regeneration. Whole organ imaging showed significant retention of labeled SRCs 24 h following intraparenchmal implantation. The presence of bioactive renal epithelial cells composing most of the delivered SRCs would have a profound impact on multiple renal functions that delay the onset of an inflammatory responses that contribute to chronic fibrosis. Current data also support activation of endogenous repair mechanisms. Although stem cells may participate in the endogenous repair of the chronically injured kidney (23), recent evidence indicates that the acutely injured kidney epithelium is repaired by non-lethally injured tubular epithelial cells and not by a putative resident and/or infiltrating specialized progenitor cell population (10, 12). Mechanisms intrinsic to the kidney that support local and efficient detection and repair following injury do not exclude a therapeutic role for an exogenously administered progenitor cell, including the bone marrow-derived mesenchymal stem cell (MSC) population that, when delivered parenterally or via sub-capsular injection, were shown to augment renal function, more apparently through paracrine-mediated factors that positively influence tissue inflammation, cell proliferation, and/or apoptosis (5, 8, 13, 16, 20, 21, 28, 35). Although more mechanistic studies are required to evaluate SRC action in the setting of chronic kidney disease injury, exogenous administration of the native SRC population appears to take advantage of their intrinsic ability to augment the central function of the tubular epithelium.
The observed improvement of survival in ZSF1 rats with CKD was the direct result of improved kidney structure and function. The basis for these effects may be linked to SRC engraftment, cytokine release, and activation of endogenous renal repair mechanisms that are still active in the chronically diseased kidney that has not yet reached ESRD. These data and previously published data demonstrating the isolation and expansion of SRCs obtained from a clinical percutaneous-guided biopsy of a human CKD biopsy tissue (25) collectively support the isolation and evaluation of this novel renal cell-based approach during an early to moderate chronic kidney disease secondary to diabetes and metabolic syndrome.
Footnotes
Acknowledgments
We appreciate the assistance of John Ludlow, Joydeep Basu, and Mark Stejbach for their assistance with editing the manuscript and Ben Watts and Brian Cox for their assistance with cell and tissue processing. We would like to acknowledge the Piedmont Research Center in RTP, NC for their management of the ZSF1 study. We also thank the following people for their technical assistance: Amy Wesa (Celsense, Inc.), Elizabeth A. Chlipala (Premier Labs, LLC), Hong Yuan (UNC Chapel Hill BRIC Small Animal Imaging Facility), and James R. L. Stanley (CBSET). All authors were employees of Tengion, Inc., except for Fengfeng Xu, Anjali N. Rao, and Benjamin Humphreys (Brigham and Women's Hospital). Tengion employees have direct ownership of shares in Tengion. Benjamin Humphreys serves on the Tengion Scientific Advisory Board and receives grant support from Tengion. Sharon Presnell, Roger Ilagan, Eric Werdin, Sumana Choudhury, Manuel Jayo, and Shay Wallace left the company before the study ended.