
Abstract
Chronic kidney disease (CKD) is a major health care problem. New interventions to slow or prevent disease progression are urgently needed. We studied functional and structural effects of infusion of healthy and CKD bone marrow cells (BMCs) in a rat model of established CKD. CKD was induced by 5/6 nephrectomy (SNX) in Lewis rats, and disease progression was accelerated with l-NNA and 6% NaCl diet. Six weeks after SNX, CKD rats received healthy eGFP+ BMCs, CKD eGFP+ BMCs, or vehicle by single renal artery injection. Healthy BMCs were functionally effective 6 weeks after administration: glomerular filtration rate (GFR; inulin clearance) (0.48 ± 0.16 vs. 0.26 ± 0.14 ml/min/100 g) and effective renal plasma flow (RPF; PAH clearance) (1.6 ± 0.40 vs. 1.0 ± 0.62 ml/min/100 g) were higher in healthy BMC-versus vehicle-treated rats (both p < 0.05). Systolic blood pressure (SBP) and proteinuria were lower 5 weeks after treatment with healthy BMCs versus vehicle (SBP, 151 ± 13 vs. 186 ± 25 mmHg; proteinuria, 33 ± 20 vs. 59 ± 39 mg/day, both p < 0.05). Glomerular capillary density was increased, and less sclerosis was detected after healthy BMCs (both p < 0.05). Tubulointerstitial inflammation was also decreased after healthy BMCs. eGFP+ cells were present in the glomeruli and peritubular capillaries of the remnant kidney in all BMC-treated rats. CKD BMCs also reduced SBP, proteinuria, glomerulosclerosis, and tubular atrophy versus vehicle in CKD rats. However, CKD BMC therapy was not functionally effective versus vehicle [GFR: 0.28 ± 0.09 vs. 0.26 ± 0.16 ml/min/100 g (NS), RPF: 1.15 ± 0.36 vs. 0.78 ± 0.44 ml/min/100 g (NS)], and failed to decrease tubulointerstitial inflammation and fibrosis. Single intrarenal injection of healthy BMCs in rats with established CKD slowed progression of the disease, associated with increased glomerular capillary density and less sclerosis, whereas injection of CKD BMCs was less effective.
Introduction
Chronic kidney disease (CKD), due to its progressive nature, ensuing end-stage kidney disease, and associated cardiovascular morbidity and mortality, is a growing public health problem worldwide (18). Slowing CKD progression is therefore a major health priority.
Injury to the glomerular and peritubular capillary endothelium, in combination with a defective capillary repair response, plays an important role in the pathogenesis and progression of CKD (25). Endothelial regeneration and repair not only relies on resident endothelial cells but also involves bone marrow (BM)-derived endothelial progenitor cells (EPCs) (23,24,44). We were the first to show that glomerular endothelial repair involves recruitment and homing of BM-derived cells (41). Furthermore, in a mouse model, engraftment of BMCs in peritubular capillary endothelium has been demonstrated (34). These data indicate that BM-derived progenitor cells may function as an “in-house” regenerating system of the renal microcirculation. Recent studies demonstrated beneficial effects of healthy BMC administration in acute renal injury models (33,46). Although few animal studies showed a positive effect of BMC treatment on the loss of renal function in the early stage of CKD (1,7–10,42,50), to our knowledge none have studied the effect of BMCs on progression of established CKD.
We previously showed that in CKD patients both number and function of EPCs are reduced (22). Whether such CKD progenitor cell dysfunction affects therapeutic efficacy of BMC administration in kidney disease has not yet been established.
We hypothesized that healthy BMCs support endothelial repair and hence renal function, thus reducing progression of established CKD, whereas CKD BMCs are less effective. Therefore, in the setting of established CKD induced by subtotal nephrectomy, we studied effects of intra-arterial delivery of healthy and CKD BMCs in the remnant kidney on renal hemodynamics and injury as well as renal incorporation of administered BMCs.
Materials and Methods
Animal Model
Male inbred Lewis rats (Charles River, Sulzfeld, Germany) and enhanced green fluorescent protein positive (eGFP+) Lewis males (47) were housed under standard conditions in a light-, temperature- and humidity-controlled environment. The protocol was approved by the Utrecht University Committee of Animal Experiments. CKD was induced in 8-week-old inbred male Lewis rats by two-stage subtotal nephrectomy (SNX) [uninephrectomy of left kidney (UNX) followed 7 days later by 2/3 removal of right kidney], accelerated with l-NG-nitroarginine (l-NNA), a nitric oxide (NO)-synthase inhibitor, and 6% NaCl diet (t = 0), as described (45).
BMCs were harvested from femur and tibia of eGFP+ age-matched Lewis males in Dulbecco's modified Eagle's medium (DMEM). The cell suspension was filtered (100-μm sieve), the total number of cells was counted (CellDyne 5000), and a suspension based on white blood cell count was prepared for injection (50 × 106 cells/0.5 ml DMEM). The eGFP+ signal of BM and blood cells obtained from donor rats was confirmed by flow cytometry (95% and 88% eGFP+, respectively).
Experimental Design
Effects of Administration of Healthy BMCs in CKD Rats
At week 5, CKD was confirmed (plasma urea > 9 mmol/L), and rats were stratified based on plasma urea and systolic blood pressure (SBP) (Table 1) as follows: CKD-healthy BMCs (n = 8), rats with CKD, intrarenal injection of 50 × 106 healthy BMCs in week 6; CKD-vehicle (n = 8), rats with CKD, intrarenal injection of 0.5 ml DMEM (vehicle) in week 6; 2-kidney (2K) controls (n = 8), animals that were not submitted to either SNX or treatment. Cells were injected directly into the remnant kidney via the renal artery to prevent sequestration of cells in the lungs, which is observed after intravenous injection (30). We used SBP to follow progression of renal failure and based on these data determined the moment of termination (when SBP > 170 mmHg). At week 12, terminal kidney function was measured under barbiturate anesthesia (see below). Directly thereafter, rats were sacrificed and tissues were collected and either frozen or fixed in 4% paraformaldehyde (PFA) for embedding in paraffin. For detailed time line, see Figure 1.
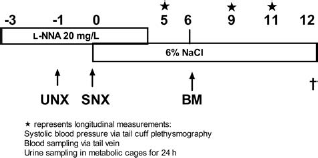
Representation of experimental setup. UNX, uninephrectomy; SNX, subtotal nephrectomy; BM, bone marrow administration; l-NNA, l-NG-nitroarginine. Stars indicate longitudinal measurements.
Systolic Blood Pressure, Plasma Urea, and Plasma Creatinine

Week 5 represents 1 week before bone marrow cell (BMC) injection. Mean ± SD.
p < 0.05, compared to 2-kidney (2K) controls;
p < 0.05, compared to chronic kidney disease (CKD) vehicle. BMCs were injected in week 6 after two-stage subtotal nephrectomy (SNX).
To evaluate healthy BMC effect and distribution over time, a separate time series experiment was performed. CKD was induced, and rats were treated as above. Rats were terminated at different time points as follows: D1 (n = 5), 1 day after injection; D7 (n = 5), 7 days after injection; and D21 (n = 5), 21 days after injection (Fig. 2). Terminal kidney function was measured, rats were sacrificed, and tissues were collected and frozen or fixed in 4% PFA for embedding in paraffin.

Representation of time experiments. UNX, uninephrectomy; SNX, subtotal nephrectomy; BM, bone marrow administration; l-NNA, l-NG-nitroarginine. D1–21 indicates time points of sacrifice.
Effects of Administration of CKD BMCs in CKD Rats
The experimental setup used for the healthy BMC experiment was also used to study the efficacy of CKD BMC infusion. To obtain CKD BMCs, CKD was induced in BMC donor rats as described above. Rats were sacrificed 6 weeks after induction of CKD, and BMCs were harvested. Recipient rats were stratified based on plasma urea and SBP (Table 2) in three groups: CKD-vehicle (n = 9), rats with CKD, intrarenal injection of 0.5 ml DMEM (vehicle) in week 6; CKD-healthy BMCs (n = 7), rats with CKD, intrarenal injection of 50 × 106 healthy BMCs in week 6; CKD-CKD BMCs (n = 7), rats with CKD, intrarenal injection of 50 × 106 CKD BMCs in week 6. In this group of rats, progression of CKD was slower compared to the previous experiment. We used SBP to follow progression of renal failure as in the previous experiment and determined the moment of termination based on SBP > 170. At week 20, terminal kidney function was measured under barbiturate anesthesia (see below).
Longitudinal Plasma Variables CKD BMC Experiment

BMCs were injected in week 6 after SNX. Week 5 represents 1 week before BMC injection. Mean ± SD.
Longitudinal Chronic Kidney Disease Evaluation
Rats were weighed weekly, and in weeks 5, 9, and 11, 24-h urine and blood samples were collected and SBP was measured by tail cuff sphygmomanometry. To collect 24-h urine, rats were placed in metabolism cages without food for 24 h, but with free access to water with 2% glucose. Urine was collected on antibiotic/antimycotic solution (Sigma, St. Louis, MO; A5955) and stored at –80°C. Blood samples were collected from the tail vein.
Urine protein was measured with Coomassie blue. Sodium and potassium were determined by flame photometry. Plasma urea and plasma and urinary creatinine were determined by DiaSys Urea CT FS (DiaSys Diagnostic Systems, Holzheim, Germany). Creatinine clearance was calculated by standard formula.
Terminal Kidney Function
Kidney function was assessed by inulin clearance to determine glomerular filtration rate (GFR) and para-aminohippuric acid (PAH) clearance to determine the effective renal plasma flow (ERPF) as described previously (29).
Renal Morphology
Glomerulosclerosis and tubulointerstitial damage were scored on periodic acid-Schiff (PAS)-stained paraffin-embedded slides (28). Monocytes/macrophages [ED-1 (CD68) stain] and proliferating cells (ki67-stain) were counted in glomeruli and tubulointerstitum (2). Apoptotic cells were counted as the extent of active caspase-3 staining (BD Pharmingen 559565) in the images of six randomly selected fields (200 x magnification) per section that were captured and digitized using a digital camera (49). The number of positively stained nuclei per field was then quantified using Image J Software (Rasband, W.S., ImageJ, U.S. National Institutes of Health, Bethesda, MD). Glomerular area and mean intensity of rat endothelial cell antigen (RECA)+ cells were also determined using ImageJ Software.
Detection and Characterization of eGFP+ Cells
Indirect immunofluorescence was performed on 5-μm snap-frozen sections, followed by fixation with 4% paraformaldehyde for 10 min, incubated for 30 min with 2% bovine serum albumin (BSA)/PBS, and incubated for 60 min at room temperature with the primary antibody (polyclonal RbæeGFP 1:200 in PBS/2%BSA; Abcam 6556). Each of these steps was followed by washing with PBS. Subsequently, slides were washed three times with PBS/T 0.05% and incubated for 30 min with the secondary antibody αRb-AlexaFluor488 1:200 in PBS/2%BSA, then incubated for 5 min with DAPI (1:750 in PBS), and finally washed twice with distilled water for 5 min due to the water solubility of eGFP and covered with mowiol and a cover slip. As antibody control, blank and isotype staining was used. For conventional immunofluorescence, we used a fluorescent microscope (TRR5500 Leica GmbH, Wetzlar, Germany), and for more detailed analysis, confocal microscopy was performed (LSM510 Leica). The eGFP+ signal of spleen- and BM-derived and blood cells was measured by flow cytometry.
To further characterize the eGFP+ cells, immunofluorescent double staining was performed on 5-μm snap-frozen sections. The following primary antibodies were used in combination with anti-GFP: rat endothelial cell antigen, a murine IgG1 mAb against a surface antigen presented on all rat endothelial cells (RECA) (Serotec Ltd., Oxford, UK, MCA970R); monocyte/macrophage marker ED-1, a murine IgG1 mAb to a cytoplasmic antigen present in monocytes and macrophages (mouse-α-ED-1, kindly provided by Ed Dub, Department of Cell Biology, Free University, Amsterdam, The Netherlands); α-smooth muscle actin (αSMA), a murine IgG2a mAb against N-terminal synthetic decapeptide of α-smooth muscle actin (Sigma C6198). Slices were defrosted and fixed with 65 ml MetOH + 100 μl H2O2 (-20°C), blocked for 30 min with 0.5 ml 1% Sap + 0.5 ml 20% normal goat serum (NGS) + 4 ml PBS, incubated for 60 min with RECA 1:100 in PBS/1% BSA/ED-1 1:100 in PBS or α-SMA-cyanine 3 (cy3) 1:500 in PBS/2% BSA, washed and incubated with GtαMo- Tetramethyl Rhodamine Isothiocyanate (TRITC) 1:100 in PBS/1% BSA for 30 min, washed and incubated with RbαGFP 1:250 in PBS/2% BSA at room temperature (RT) for 60 min, washed and incubated with αRb-AlexaFluor488 1:200 in PBS for 30 min, and finally washed twice with distilled water and covered with mowiol and a cover slip.
Echocardiography
Transthoracic echocardiography was performed with a digital ultrasound machine (Philips Sonos 5500, Eindhoven, The Netherlands) and a 15-MHz linear array transducer (Hewlett Packard Company, Palo Alto, CA), as described (5).
Gene Expression in Heart Tissue
To determine fluid overload in the heart, cDNA was isolated from frozen left ventricles and expression of atrial natriuretic peptide (ANP) and brain natriuretic peptide (BNP) was determined using quantitative realtime RT-PCR (ABi PRiSM 790Sequence Detection System, Applied Biosystems, Foster City, CA). The following TaqMan® Gene Expression Assays (Applied Biosystems) were used: (ANP: Rn00561661_m1), (BNP: Rn00580641_m1), (β-actin: Rn00667869_m1), and (calnexin: Rn00596877_m1). Reactions were carried out in duplicate. Cycle time (Ct) values for ANP were normalized for mean Ct values of calnexin and β-actin, which we previously determined to be the two most stable housekeeping genes across all groups using the geNorm program (http://medgen.ugent.be/~jvdesomp/genorm/), and expressed relative to a calibrator (the sample with the lowest expression: the 2K controls) using the ΔΔCt-method. Hence, steady state mRNA levels were expressed as n-fold difference relative to the calibrator.
Cytokine Array
A rat cytokine array (R&D Systems) was performed on bone marrow cell lysate according to manufacturer's instructions. Samples from four healthy and four CKD animals were analyzed separately, and equal amounts of protein were loaded on the blots. Each spot on the blot is represented in duplicate, and averages of these two pixel densities were used to calculate the average density with Image J software. Background staining and spot size were analyzed as recommended by the manufacturer. Briefly, pictures were converted to 8-bit inverted jpeg files and spots were circled. Per blot, equal spot sizes were analyzed.
Statistical Analyses
Data are presented as mean ± SD and analyzed by analysis of variance one-way ANOVA with a Dunnet posttest, two-way RM ANOVA with a Bonferroni posttest, and Student's t test or Mann–Whitney test with Graphpad (Prism Software, La Jolla, CA); p < 0.05 was considered significant. Animals that did not complete the experiment were excluded from analysis.
Results
Healthy BMC Treatment Reduces CKD Progression
At week 5, CKD was confirmed by increased systolic blood pressure, plasma urea, and plasma creatinine in both healthy and CKD BMC administration experiments (Tables 1 and 2). As compared with 2K control rats, vehicle-treated CKD rats showed a 69% reduction in GFR as determined by inulin clearance and a 62% reduction in ERPF as determined by PAH clearance at week 12 (Fig. 3A, B). All healthy BMC-treated CKD rats had significantly higher GFR and ERPF as well as calculated renal blood flow (RBF) compared to vehicle-treated CKD rats (43% vs. 69%, 38% vs. 62%, and 45% vs. 65% reduction of GFR, ERPF, and RBF, respectively). Terminal mean arterial pressure and renal vascular resistance, filtration fraction, and fractional excretions of sodium and potassium were not significantly different between healthy BMC-treated CKD rats versus vehicle-treated CKD rats (Table 3).

Healthy BMC administration improves terminal kidney function. (A) Glomerular filtration rate. (B) Effective renal plasma flow. Percentages are relative to healthy controls, 2-kidney (2K) control (n = 8), chronic kidney disease (CKD) vehicle (n = 8), CKD healthy bone marrow cell (BMC) transplant (n = 8). Mean ± SD. ∗p < 0.05, compared to 2K controls; †p < 0.05, compared to CKD vehicle.
Terminal Kidney Function Measurements
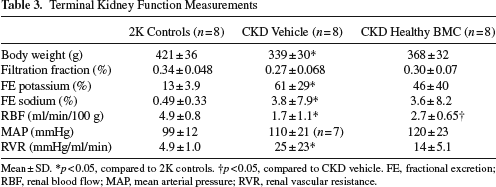
Mean ± SD.
FE, fractional excretion; RBF, renal blood flow; MAP, mean arterial pressure; RVR, renal vascular resistance.
p < 0.05, compared to 2K controls.
p < 0.05, compared to CKD vehicle.
As compared with 2K controls, CKD rats terminated at day 1 (D1) showed a 55% reduction in GFR and a 49% reduction in ERPF. At the end of the experiment, as compared to animals from group D1, vehicle-treated CKD rats showed a further reduction in GFR and ERPF, while in healthy BMC-treated CKD rats, this further reduction in GFR and ERPF was halted.
Healthy BMC Infusion Reduces the Increase of Systolic Blood Pressure, Plasma Urea, Creatinine, and Proteinuria and Reduces Development of Anemia
Systolic blood pressure showed a significant increase over time in vehicle-treated CKD rats; however, no significant increase was observed over time in healthy BMC-treated CKD rats (Fig. 4A). Systolic blood pressure was significantly lower in healthy BMC-treated CKD rats compared to vehicle-treated CKD rats by week 9 (137 ± 13 vs. 162 ± 34 mmHg; p < 0.05) and this difference persisted until week 11 (151 ± 13 vs. 186 ± 25 mmHg; p < 0.01). In vehicle-treated CKD rats, diuresis was significantly higher compared to 2K controls, whereas in healthy BMC-treated CKD rats, it was not different from 2K controls at week 11 (data not shown).

Healthy BMC administration reduces the increase in systolic blood pressure and proteinuria. (A) Systolic blood pressure. (B) Proteinuria. ●, 2K control (n = 8); ■, CKD vehicle (n = 8); ▲, CKD healthy BMC (n = 8). Mean ± SD. ∗p < 0.05, compared to 2K controls. †p < 0.05, compared to CKD vehicle.
Over time, an increase in proteinuria was observed in vehicle-treated CKD rats, but not in healthy BMC-treated CKD rats (Fig. 4B). Proteinuria was significantly lower by week 11 in healthy BMC-treated rats compared to vehicle-treated CKD rats (Fig. 4B). Sodium, potassium, and NO metabolite excretion were not significantly different between healthy BMC and vehicle treatment (data not shown). Plasma creatinine and urea were lower at week 11 in healthy BMC-treated CKD rats compared to vehicle-treated CKD rats (Table 1), but no significant differences in creatinine clearance were found between these groups.
CKD animals developed mild anemia; however, hematocrit was significantly higher in healthy BMC-treated CKD rats as compared to vehicle-treated CKD rats (44 ± 4% vs. 40 ± 3%). Hemoglobin levels were also significantly higher in healthy BMC-treated CKD rats versus vehicle-treated CKD rats (10.0 ± 0.5 vs. 8.7 ± 0.3 mmol/L, p < 0.05).
Healthy BMC Treatment Increases the Number of Glomerular Endothelial Cells and Reduces Glomerulosclerosis, Inflammation, and Apoptosis
Both vehicle- and healthy BMC-treated CKD rats show marked glomerulosclerosis as compared with 2K controls with only 10% and 14% normal, nonsclerotic glomeruli as compared to 73% normal glomeruli in 2K controls (Fig. 5A). Comparing the number of glomeruli with segmental and global sclerosis between CKD groups reveals a favorable shift with significantly more glomeruli with segmental sclerosis and less glomeruli with global sclerosis in healthy BMC-treated CKD rats compared to vehicle-treated CKD rats (Fig. 5A). Significantly, more global glomerulosclerosis was observed after vehicle treatment compared with rats terminated on day 1 (D1 rats) (60 ± 24% vs. 14 ± 14%), while there was no significant difference between healthy BMC treatment after 6 weeks versus D1 (35 ± 18%).
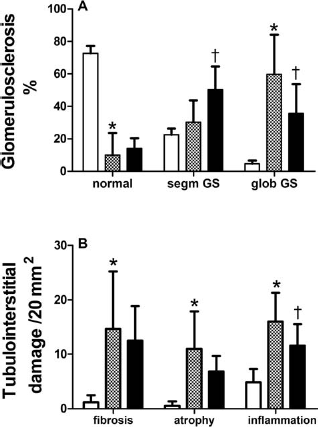
Renal damage is reduced after healthy BMC administration. (A) Segmental (segm) and global (glob) glomerulosclerosis (GS). (B) Tubulointerstitial damage. White bars, 2K control (n = 6); dotted bars, CKD vehicle (n = 8); black bars, CKD healthy BMC (n = 8). Mean ± SD. ∗p < 0.05, compared to 2K controls. †p < 0.05, compared to CKD vehicle.
Both vehicle-treated and healthy BMC-treated CKD groups had more tubulointerstitial damage than 2K controls (Fig. 5B). Tubulointerstitial inflammation was less abundant after healthy BMC treatment than in vehicle-treated CKD rats. Interstitial fibrosis and tubular atrophy were not different between CKD groups. Macrophage influx was lower in glomeruli of healthy BMC- versus vehicle-treated CKD rats (Table 4), but tubular macrophage influx was not different. The number of both glomerular and tubular apoptotic cells was higher in vehicle-treated CKD rats compared to 2K controls, and apoptosis tended to decrease after healthy BMC treatment in CKD rats (not significant) (Table 4). The number of glomerular proliferating cells was higher in vehicle-treated CKD rats compared to 2K controls, and this tended to be even higher after healthy BMC treatment, although this was not significant (Table 4). The glomerular size, assessed by measuring the circumference of the glomeruli, did not differ significantly between CKD groups (Fig. 6A). However, counts of RECA-positive pixels in glomeruli indicate higher numbers of endothelial cells in the glomeruli of healthy BMC-treated CKD rats versus vehicle treatment (Fig. 6B).
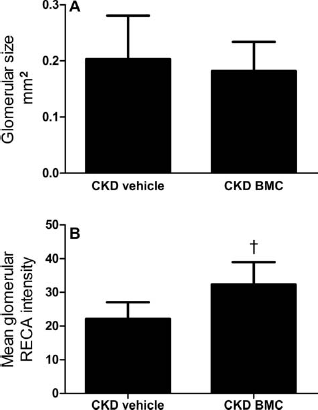
Healthy BMC therapy induces no differences in glomerular expansion, while rats endothelial cell antigen (RECA) intensity is increased. (A) Glomerular expansion. (B) Mean glomerular RECA intensity. Mean ± SD. †p < 0.05, compared to CKD vehicle.
Glomerular Morphology

Mean ± SD.
p < 0.05, compared to 2K controls.
p < 0.05, compared to CKD vehicle.
CKD BMC Treatment Is Less Effective in Reducing CKD Progression
As compared with vehicle-treated CKD rats, healthy BMC-treated rats still showed a higher GFR as determined by inulin clearance (0.26 ± 16 vs. 0.43 ± 0.09 ml/min/100 g) and higher ERPF as determined by PAH clearance (0.78 ± 0.44 vs. 1.31 ± 0.41 ml/min/100 g) 14 weeks after administration. CKD BMC-treated CKD rats did not show higher GFR (0.28 ± 0.09 ml/min/100 g) or ERPF (1.15 ± 0.36 ml/min/100 g) versus vehicle-treated CKD rats (Fig. 7A, B). As compared to vehicle-treated CKD rats, calculated renal blood flow was higher in healthy BMC-treated CKD rats (1.32 ± 0.65 vs. 2.26 ± 0.68, p < 0.05), while RBF after CKD BMC (1.93 ± 0.62) was not significantly different versus vehicle.

Healthy BMCs effectively increased terminal kidney function, while CKD BMCs did not. (A) Glomerular filtration rate. (B) Effective renal plasma flow. Vehicle (n = 9), healthy BMC (n = 7), CKD BMC (n = 7). Mean ± SD. ∗p < 0.05, compared to vehicle. †p < 0.05, compared to healthy BMC.
CKD BMC Infusion Reduces the Increase in Systolic Blood Pressure, Plasma Urea, Creatinine, and Proteinuria
Systolic blood pressure was lower in both healthy and CKD BMC recipients compared to vehicle-treated CKD rats by week 11 (134 ± 16 and 126 ± 23 vs. 140 ± 24 mmHg), and this difference persisted until week 19 (136 ± 19 and 140 ± 27 vs. 160 ± 31 mmHg) (Fig. 8A). Proteinuria was significantly lower by week 19 in both healthy and CKD BMC-treated CKD rats compared to vehicle-treated CKD rats (Fig. 8B). Plasma creatinine and urea were lower by week 19 in both healthy and CKD BMC-treated CKD rats compared to vehicle-treated CKD rats (Table 2).
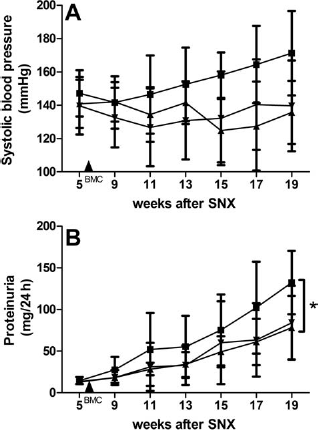
BMC treatment effectively decreased systolic blood pressure and proteinuria. (A) Systolic blood pressure (SBP). (B) Proteinuria. ▪, vehicle (n = 9); ▴, healthy BMC (n = 7); ▾, CKD BMC (n = 7). Mean ± SD. ∗p < 0.05, compared to vehicle.
BMC Treatment Reduces Renal Damage Independent of Kidney Function in the Cell Donor
Both CKD and healthy BMC-treated CKD rats show significantly more healthy glomeruli compared to vehicle-treated CKD rats (40 ± 11% vs. 21 ± 10%), indicating less glomerulosclerosis (Fig. 9A). Vehicle-treated CKD rats demonstrate enhanced tubulointerstitial damage compared to BMC treatment. Tubular interstitial inflammation was less after BMC versus vehicle treatment in CKD, particularly after healthy BMC treatment. Interstitial fibrosis was decreased after healthy BMC treatment; however, no effect of CKD BMC treatment was observed. Tubular atrophy was decreased after BMC treatment versus vehicle, independent of the disease status of the cell donor (Fig. 9B). The number of glomerular proliferating cells was increased after both healthy and CKD BMC treatment compared to vehicle treatment (9.5 ± 2.2 and 9.7 ± 3.3 vs. 7.5 ± 2.3/glomerulus).

Renal damage was reduced after BMC administration. (A) Segmental (segm) and global (glob) glomerulosclerosis (GS). (B) Tubulointerstitial damage. White bars, vehicle (n = 9); dotted bars, healthy BMC (n = 7); black bars, CKD BMC (n = 7). Mean ± SD. ∗p < 0.05, compared to vehicle.
Detection and Characterization of eGFP+ Cells
In frozen slices of the remnant kidney, we were able to visualize eGFP+ cells at 6 and 14 weeks after administration of healthy and CKD BMCs, respectively, both in glomeruli and interstitium, while tubular eGFP+ cells were rare (Fig. 10A). However, we did not observe incorporated eGFP+ glomerular or interstitial cells, rather cells seem to be attached to the luminal site of the endothelial lining as observed by confocal microscopy (Fig. 10B, C). No differences were found in the number of eGFP+ cells in remnant kidneys of healthy or CKD BMC recipients (1.53 ± 0.36/glomerulus vs. 1.44 ± 0.73/glomerulus). Double staining with eGFP and RECA showed no trans differentiation of BMCs towards endothelial cells, that is, no eGFP/RECA double-positive cells were observed. Double staining with eGFP and ED-1 showed no trans differentiation of BMCs towards monocytes/macrophages and eGFP/αSMA double-positive cells were also not observed. In the time series experiments, we observed increasing numbers of eGFP+ cells in the remnant glomeruli at D1 (0.06 ± 0.04), D7 (0.49 ± 0.85), D21 (3.81 ± 1.89), and D42 (4.56 ± 1.44; ANOVA, p = 0.0027). However, no eGFP/RECA1 double-positive cells were found. In bone marrow and spleen, a few (1–4%) eGFP+ cells were consistently detected by fluorescence-activated cell sorting (FACS) analyses.

Enhanced green fluorescent protein positive (eGFP+) cells are detected in the remnant kidney after eGFP+ BMC administration via the renal artery (A). Arrows indicate double-positive cells (DAPI and eGFP). eGFP+ cells are found in close proximity to the glomerular (B) and pericapillary (C) microvasculature. Arrows indicated eGFP+ cells in tubulointerstitial space (C) and glomerular space (B).
Heart Function
Echocardiography revealed no significant effect of intrarenal healthy BMC administration on ejection fraction compared to vehicle treatment (0.60 ± 0.13 vs. 0.66 ± 0.07) and other cardiac parameters (data not shown). No differences were found after healthy BMC treatment compared to vehicle on cardiac gene expression of ANP (5.13 ± 0.85 vs. 5.79 ± 0.73 ΔΔCt) and BNP (1.85 ± 0.78 vs. 2.09 ± 0.85 ΔΔCt).
Rat Cytokine Array
A rat cytokine array of BMC lysates only showed a significant reduction in vascular endothelial growth factor (VEGF) in CKD versus healthy BMCs (Table 5). Only data of detectable cytokines are shown.
Cytokine Production in Healthy (n = 4) and CKD (n = 4) Bone Marrow Cell Lysate

Equal amounts of protein were loaded in duplicate. Mean ± SD. CINC-1, cytokine-induced neutrophil chemoattractant-1; IL-1α, interleukin-1α; LIX, lipopolysaccharide-induced CXC chemokine; l-selectin, leucocyte cell adhesion molecule; MIP-1α, macrophage inflammatory protein-1α; sICAM, soluble intercellular adhesion molecule; VEGF, vascular endothelial growth factor.
Discussion
The main finding of our study is that administration of healthy BMCs into the renal artery of rats with established, progressive CKD markedly reduces the progression of kidney failure. At 6 weeks after single intra-arterial healthy BMC injection, we observed almost twofold better kidney function as determined by GFR and ERPF and significantly less glomerulosclerosis, tubulointerstitial inflammation, and apoptosis as compared to vehicle-treated CKD rats. Our observation that glomerular capillary density is increased in BMC-treated CKD rats suggests endothelial repair or regeneration. CKD BMC injection did not effectively increase GFR and ERPF but decreased glomerulosclerosis and tubular inflammation and atrophy. Both intrarenal healthy and CKD BMC administration attenuated the increase in systolic blood pressure and proteinuria over time. The relatively low number of eGFP+ BMCs in all recipients, and their close proximity to the microvasculature is consistent with paracrine mechanisms.
Our study is the first to demonstrate that healthy BMC administration as a “rescue intervention”—that is, 6 weeks after CKD induction—can markedly attenuate the reduction of both GFR and ERPF as assessed by classical “gold standard” inulin and PAH clearance methodology. Previous studies have demonstrated that BMC administration can accelerate recovery of experimental acute kidney failure (reviewed in (35)) and that synthetic stimulation can enhance the recovery induction ability of BMCs (31). Following a different paradigm, cell-based therapy of rat renal progenitor-like cell line derived from the S3 segment of renal proximal tubules increased renal function and decreased renal damage after acute renal failure (27). In CKD, the use of an enriched epithelial cell subpopulation of unfractioned cultures from all major compartments of the kidney, effectively decreased progression of renal failure (26). A few studies have reported that administration of BMCs or subpopulations of BMCs may attenuate development of CKD if administered when glomerulosclerosis is not yet manifest (1,7,10,33,42), thus indicating preventive effects in early stages of kidney injury rather than therapeutic “rescue” in established CKD. Only one study by Yuen et al. reported on BMC therapy at a later time point, that is, 4 weeks after SNX, although the severity of CKD at the time of injection is not known (50). They showed that administration of culture-modified cells, that is, BM cells that were cultured for 7–10 days on fibronectin-coated plates, resulted in ~28% lower plasma creatinine levels and less proteinuria as well as decreased sclerosis and fibrosis as compared to intravenous saline injection at 4 weeks after infusion.
The strength of our study is that we evaluated the functional effect of our therapy by using clearance studies. Our study showed a similar and relatively mild reduction of plasma creatinine (~32%) levels at 6 weeks after BMC administration as compared to vehicle, comparable to the data reported by Yuen et al. However, using inulin clearance, we show a striking, almost twofold higher GFR after 6 weeks in CKD rats treated with healthy BMCs as compared to vehicle-treated CKD rats, which was reproduced in the second experiment where we also investigated the role of CKD BMC administration. Indeed, in rodents with CKD, creatinine clearance tends to underestimate the degree of renal failure (12,32,37). The discrepancies between clinical markers of renal function and classic clearance technology underline the importance of bona fide measurements of renal function in models of CKD.
Our findings may have relevance for treatment of CKD in humans. We used the 5th/6th nephrectomy ablation model, a well-known experimental model of progressive renal disease, resembling human CKD (16,20). The severe reduction in renal mass causes progressive glomerular injury, loss of remnant nephrons, and development of systemic and glomerular hypertension. It has been associated with capillary loss (25) and is characterized by renal inflammation and gradual development of glomerulosclerosis (5). We injected BMCs via the renal artery at 6 weeks after induction of CKD, a time point at which we and others (5) have shown that kidney failure is established, accompanied by proteinuria and anemia. Besides an almost twofold higher GFR at 6 weeks after a single healthy BMC injection in our animals with established CKD, we also observed beneficial effects in our longitudinal CKD evaluation studies. We found that CKD rats with BMC treatment had significantly lower systolic blood pressure at 3 and 5 weeks after BMC injection compared to CKD-vehicle rats, with a difference of up to 35 mmHg between the groups, as well as less proteinuria. CKD BMC-treated rats also had higher terminal hematocrit than vehicle-treated CKD rats.
A limitation of our study is that we do not have data on GFR and ERPF at time point of BMC or vehicle injection, that is, 6 weeks after induction of CKD. However, if we compare GFR and ERPF at 6 weeks after BMC or vehicle injection with GFR and ERPF at 1 day after BMC injection—assuming that BMCs will not have a major effect on kidney function within a single day—our data show no further deterioration of GFR and ERPF in CKD rats after BMC therapy, while in CKD vehicle rats, both GFR and ERPF declined. This is consistent with halting of progression of kidney disease.
Our observation of similar increases in GFR and ERPF, and hence no change in filtration fraction, and our finding that there was no difference in glomerular area between BMC- or vehicle-treated groups indicate that compensatory hyperfiltration or hyperperfusion in the remnant kidney cannot explain the beneficial effect of BMC administration on kidney function (51). Rather, our data point at a beneficial effect of BMCs on glomerular structure. We found a favorable shift in glomerulosclerosis after BMC treatment. The beneficial effect of BMCs on glomerulosclerosis development may be explained by an effect on endothelial regeneration. Several studies have shown that impaired glomerular endothelial repair is associated with progressive glomerulosclerosis (38,43) and that enhancing glomerular endothelial repair may lead to regression of glomerulosclerosis (17). Indeed, we found a significantly higher glomerular capillary density in kidney sections of CKD-healthy BMC compared to CKD-vehicle rats. The lack of difference in filtration fraction between BMC- and vehicle-treated CKD rats also points at preglomerular and intraglomerular cells as primary targets of BMC administration. This is in line with a recent study in a porcine model of chronic renovascular disease (9) where BMC administration appeared to mainly enhance ramification of the preglomerular arteriolar tree.
A possible mechanism underlying the preservation or repair of glomerular microvasculature could be engraftment and integration of the injected BMCs into the glomerular endothelium. We have previously demonstrated in chimeric rats that endogenous BMCs may home to injured glomerular endothelium, differentiate into endothelial cells, and participate in regeneration of the glomerular microvasculature (41). We detected BMCs in glomeruli and at luminal endothelial sites of the remnant kidney; however, we observed no incorporation of cells in the glomeruli or glomerular microvasculature nor did we observe any transdifferentiation of BMCs towards endothelial cells. We performed a time series to study whether incorporation or transdifferentiation of BMCs might have occurred at earlier time points after BMC injection. These data show no higher presence of eGFP+ cells in the remnant kidney directly after injection and also no incorporation or transdifferentiation.
Previous studies have questioned the role of incorporation of BM-derived EPC to adult neovascularization in several experimental models (39,53). Recent studies in renal disease models also document that the number of cells in the kidney after injection are low (1,50). The role of BMC incorporation into the endothelium seems dependent on the nature of the vascular injury. In addition, BMCs have been suggested to have a supporting function by the secretion of growth factors and cytokines (53). Grunewald et al. showed that BMCs can be recruited to sites of neovascularization and retained close to blood vessels where they act in a pracrine fashion to stimulate neovascularization (21). Consistently, in hind limb ischemia models, accumulations of eGFP+ cells were observed around growing vessels (14,53). This seems in agreement with our findings of eGFP+ BMCs in close proximity of the endothelium. However, our study does not allow conclusions on the exact paracrine mechanisms. Possible effects could be through protection against apoptosis or by enhancing proliferation. In acute renal failure, decreased apoptosis after BMC treatment has been documented (4,36). Indeed, in our CKD model, the number of apoptotic cells was lower after BMC as compared to vehicle administration. Furthermore, we found more proliferating cells after BMC treatment.
Interestingly, the number of eGFP+ cells in the remnant kidney showed an increase between 1 and 3 weeks after injection and did not decrease over the following weeks. This may be related to our finding that injected eGFP+ BMCs were present in both bone marrow and spleen of the recipients. BMCs can home and proliferate in the bone marrow, but also in the spleen, which can function as a stem cell niche (15). This BMC availability from other niches may in part explain the long-term effect of BMCs on kidney function. These observations suggest that other administration routes such as intravenous injections may also be effective. Indeed, Yuen et al. (50) compared IV injection versus intra-arterial injection of cultured modified cells (CMCs) in a rat model of 5/6 SNX and found that these administration routes were equally effective on functional parameters (urinary protein, plasma creatinine, and systolic blood pressure).
When considering clinical application, autologous BMC therapy has the major advantage of avoiding immunologic reactions. However, BMC availability and function are dependent on age and disease state (3). In our study, a potential disadvantage of autologous BMC therapy for CKD is that the presence of CKD has been shown to negatively influence BMC function, differentiation, and proliferation (13,19,22,48). In a rat CKD model, Drewa et al. showed that BM progenitors from CKD rats lacked in vitro proliferative capacity (13). A functional impairment of BMCs may limit the therapeutic potential of autologous BM cell therapy. Indeed, our data show that administration of CKD BMCs in a CKD recipient is less effective in restoring GFR and ERPF compared to healthy BMCs, although we did observe a beneficial effect on blood pressure and proteinuria. No differences were found in number of eGFP+ cells in the remnant kidney between CKD and healthy BMC recipients, suggesting that the attenuated functional effect of CKD BMCs may be due to impaired paracrine actions of these cells. Indeed, in CKD BMC lysate expression of VEGF was significantly decreased compared to healthy BMC lysate, indicating a shift to a low-angiogenic phenotype.
In certain circumstances, BMCs may give rise to myofibroblasts and contribute to kidney fibrosis (6). In diseased states, differentiation of BMCs may shift towards a more inflammatory phenotype (40). Furthermore, it has been reported that diseased BM progenitor cells can deliver a disease phenotype to a healthy kidney (11,52). At 6 weeks after healthy BMC treatment, we did not observe a difference between groups in interstitial fibrosis and even document a favorable shift towards less globally sclerotic glomeruli. In addition, tubulointerstitial inflammation and glomerular macrophage number were significantly lower in the BMC-treated group as compared to the vehicle-treated group. Treatment with CKD BMCs also did not induce formation of sclerosis, nor did we observe a significant increase in tubulointerstitial inflammation, fibrosis, or atrophy. We did not observe adverse effects related to the injection of 50 × 106 BMCs into the renal artery. In kidney sections obtained 1 and 7 days after BMC injection, we detected no morphological effects, no signs of embolism, and no differences in tubular necrosis as compared to time controls.
In conclusion, our study demonstrated a marked renoprotective effect of renal artery injection of healthy BMCs in a rat model with established CKD, as shown by a twofold higher GFR and considerably less glomerular damage after a single BMC injection. CKD BMC therapy was less effective, indicating the need for further research to restore this dysfunction. Neither healthy nor CKD BMC injection caused adverse effects. Our findings may provide a basis for further research towards potential clinical application of BMC-based therapies in human CKD.
Footnotes
Acknowledgments
We thank Krista den Ouden, Nel Willekes, Chantal Tilburgs, and Paula Martens for their expert technical assistance. This study was financially supported by the Dutch Kidney Foundation, grant C06.2174. M.C.V. is supported by The Netherlands Organisation for Scientific Research (NWO) Vidi-grant 016.096.359. The authors declare no conflicts of interest.