
Abstract
Pleomorphic adenoma gene-like 1 (PLAGL1) has been linked to transient neonatal diabetes mellitus. Here, we investigated the role of the related pleomorphic adenoma gene 1 (PLAG1) in glucose homeostasis. PLAG1 transgenic mice in which expression of the PLAG1 transgene can be targeted to different organs by Cre-mediated modulation were crossed with Pdx1-Cre or Ngn3-Cre mice, resulting in double transgenic P1-Pdx1Cre or P1-Ngn3Cre mice, respectively. P1-Pdx1Cre and P1-Ngn3Cre mice developed hyperplasia of pancreatic islets due to increased β- and δ- but not α-cell proliferation. In young P1-Pdx1Cre mice (less than 15 weeks) there was a balanced increase in the pancreatic content of insulin and somatostatin, which was associated with normoglycemia. In older P1-Pdx1Cre mice the pancreatic somatostatin content far exceeded that of insulin, leading to the progressive development of severe hypoglycemia beyond 30 weeks. In contrast, in older P1-Ngn3Cre mice the relative increase of the pancreatic insulin content exceeded that of somatostatin and these mice remained normoglycemic. In conclusion, forced expression of PLAG1 under the control of the Pdx1 or Ngn3 promoter in murine pancreas induces different degrees of endocrine hormone imbalances within the pancreas, which is associated with hypoglycemia in P1-Pdx1Cre mice but not P1-Ngn3Cre mice. These results suggest that once stem cell-derived islet transplantations become possible, the appropriate balance between different hormone-producing cells will need to be preserved to prevent deregulated glucose metabolism.
Introduction
Pleomorphic adenoma gene-like 1 (PLAGL1) is a member of the PLAG zinc finger gene family together with pleomorphic adenoma gene 1 (PLAG1) and pleomorphic adenoma gene-like 2 (PLAGL2). PLAGL1 is also known as lost-on-transformation 1 (LOT1) or zinc-finger protein which regulates apoptosis and cell-cycle arrest 1 (ZAC1). Members of the PLAG gene family play a role in tumorigenesis. Loss of Lot1 expression was found in several independently transformed rat ovarian surface epithelial cell lines, suggesting that Lot1 encodes a tumor suppressor (1). In contrast, increased expression of PLAG1 was found in pleomorphic adenomas of the salivary glands (22), suggesting that PLAG1 encodes a proto-oncogene. In later studies, increased expression of PLAG1 was also linked to the formation of hepatoblastomas (33), lipoblastomas (2,20), and acute myeloid leukemia (25). Additionally, in vitro studies in cell lines (18) as well as in vivo studies in mice (9–11,14,31,35) have demonstrated the oncogenic capacity of PLAG1.
PLAGL1/ZAC1 has been linked to transient neonatal diabetes mellitus (TNDM), a rare genetic disease wherein diabetes is seen in newborns and again during adult life (21). In this imprinted disorder, PLAGL1 is overexpressed from the paternal allele together with the hydatidiform mole associated and imprinted (HYMAI) gene at the TNDM locus. The latter of these encodes an untranslated mRNA. The causative role of one or both genes located at the TNDM locus was demonstrated in transgenic mice, which develop neonatal and adult-onset diabetes (26). Although the mechanism(s) whereby deregulated expression of PLAGL1 and/or HYMA1 cause the disease are not fully understood, aberrations in β-cell mass and insulin secretion in neonates and in adults have been identified.
Here we investigated whether PLAG1, like its family member PLAGL1, also plays a role in glucose homeostasis. Previous studies (8) have demonstrated that rat insulin II gene promoter (RIP)-Cre-mediated targeted expression of PLAG1 in the β-cells leads to islet hyperplasia associated with hyperinsulinemic normoglycemia due to hepatic insulin resistance. We hypothesized that expression of PLAG1 in different compartments of the pancreas may differentially affect the hormone balance and glucose homeostasis. Hence, it was essential to elucidate the consequence of PLAG1 expression driven by the genes involved in early pancreatic development. Therefore, the previously generated Cre-inducible PLAG1 transgenic mice (10) were crossed with pancreatic and duodenal homeobox 1 (Pdx1)- or neurogenin-3 (Ngn3)-Cre mice to target PLAG1 expression either to the whole pancreas or to the pancreatic endocrine cells, respectively.
Materials and Methods
Generation of Transgenic Mice
The mouse experiments were approved by the institutional review board of the KULeuven. The generation and genotyping of the PLAG1 transgenic mouse strains (PTMS) has been reported previously (10). In brief, between the pCAGGS promoter and the sequence encoding hemagglutinin (HA) tagged PLAG1, a loxP/PGK-neo/LoxP DNA fragment was inserted as a Cre-dependent removable stop cassette. This construct was used for the zygote injections to generate the PLAG1 transgenic mice. To target PLAG1 expression to the pancreas, PTMS mice were crossed with homozygous Pdx1-Cre transgenic mice (a kind gift from Pedro Herrera, Switzerland) and backcrossed for more than seven generations in a FVB background (19). The double transgenic PLAG1+/– Pdx1-Cre+/– offspring mice were designated P1-Pdx1Cre mice. The expression of PLAG1 was also targeted more specifically to the endocrine cells. Therefore, PTMS mice were crossed with heterozygous Ngn3-Cre mice (12) (a kind gift from Pedro Herrera, Switzerland), resulting in double transgenic PLAG1+/–Ngn3-Cre+/– offspring mice, designated as P1-Ngn3Cre mice. As Ngn3-Cre mice were still in a mixed background, only littermates were used for the experiments.
Detection of PLAG1 Expression by Immunofluorescence
After 15-min fixation of 5-μm cryostat sections in 4% formaldehyde, the sections were blocked in 0.4% fish skin gelatine in PBS for 30 min. Subsequently, the sections were incubated for 1 h at room temperature with a primary rat anti-HA antibody (DAKO, 1:100) followed by incubation at room temperature with a secondary Alexa Fluor® 546 goat anti-rat antibody (Invitrogen; 1:500) together with Hoechst 33258 (1:2000) for 30 min. After mounting with Prolong gold, the slides were analyzed with a Zeiss Axioimager.
Immunohistochemical Analysis of the Pancreases
Following overnight fixation in 4% formaldehyde, pancreases were embedded in paraffin according to standard procedures, after which tissue blocks were cut in their entirety in 5-μm sections. Hematoxylin and eosin (H&E) staining was performed using standard procedures. Immunohistochemical analysis was performed on paraffin sections blocked at room temperature with 0.4% fish skin gelatin for 30 min. The slides were incubated at room temperature for 1 h with either a guinea pig anti-insulin antibody diluted 1:2, a rabbit anti-glucagon antibody diluted 1:1500, or a rabbit anti-somatostatin antibody diluted 1:750. Subsequently, slides were incubated for 30 min with 1:200 diluted polyclonal rabbit anti-guinea pig IgG coupled to peroxidase; alternatively, the anti-rabbit Envision+ kit was used. DAB+ was used as substrate chromogen. Sections were counterstained with hematoxylin and mounted. All antibodies and chromogens were obtained from DAKO.
Electron Microscopy
Electron microscopy was performed on freshly isolated islets from 30-week-old P1-Pdx1Cre and Pdx1-Cre mice, as described previously (27).
Determination of Total Pancreatic Insulin, Glucagon, and Somatostatin Content
Pancreases were removed from ad libitum fed P1-Pdx1Cre, Pdx1-Cre, P1-Ngn3Cre, and Ngn3-Cre mice of different ages and homogenized in 5 ml of acidic ethanol (75% ethanol, 0.12 M HCl), sonicated for 3 min, incubated overnight at −20°C, and centrifuged at 4000 rpm for 15 min. The insulin, glucagon, and somatostatin content of the supernatant fractions was analyzed with the Mercodia high range rat insulin ELISA kit, the Gentaur glucagon EIA kit, and the Phoenix Pharmaceuticals, Inc somatostatin kit, respectively.
Morphometric Analysis
The β-cell mass of four 37-week-old P1-Pdx1Cre and four littermate Pdx1-Cre mice was determined. Sections were sampled every 200 μm and stained for insulin overnight at 4°C with guinea pig anti-insulin antibody diluted 1:1000. The slides were subsequently incubated for 1 h at room temperature with the Alexa Fluor 647-conjugated antibody (Invitrogen, Paisley, UK; 1:500) and the nuclei stained with DAPI (Sigma-Aldrich, USA) in fluorescent mounting medium (Dako, Glostrup, Denmark). The insulin-stained sections (six sections per pancreas) were entirely photographed using Pathway 435 and analyzed in IPLab (Becton Dickinson, San Jose, CA, USA). The β-cell mass (mg/pancreas) was calculated by multiplying relative insulin-positive area, as determined in the sections, by the weight of the pancreas.
To determine the α- and δ-cell mass, double immunofluorescent staining for insulin together with glucagon or somatostatin was performed. The α-cell surface/β-cell surface ratio and δ-cell surface/β-cell surface ratio were calculated with axiovision software (Zeiss). This was subsequently used to determine the α-cell mass and δ-cell mass by multiplying the β-cell mass with the α-cell surface/β-cell surface ratio or δ-cell surface/β-cell surface ratio, respectively.
Quantification of β-, α-, and δ-Cell Proliferation
Three 5-μm paraffin sections separated by 200 μm of pancreases of four 37-week-old P1-Pdx1Cre and Pdx1-Cre mice were blocked in 0.4% fish skin gelatin in PBS for 30 min. The sections were then incubated at room temperature for 1 h with a mixture of a rat anti-Ki67 antibody (DAKO; 1:50) together with a monoclonal mouse anti-insulin antibody (Sigma; 1:1000) or a rabbit anti-somatostatin antibody (DAKO; 1:750) or rabbit anti-glucagon antibody (DAKO; 1:1000). The sections were then incubated at room temperature for 30 min with a mixture of Alexa Fluor® 488 goat anti-mouse (for insulin) or Alexa Fluor® 488 goat anti-rabbit (for somatostatin and glucagon) and Alexa Fluor® 546 goat anti-rat antibodies (Invitrogen), each of which were diluted 1:500 with Hoechst 33258 being diluted 1:2000. After mounting with Prolong gold, the slides were analyzed with a Zeiss Axioimager. β-Cell proliferation was quantified as (the number of insulin+/Ki67+ cells of the three different sections/total number of insulin+ cells per section) × 100. α-Cell and δ-cell proliferation was also calculated. At least 3,900 β-cells, 1,600 α-cells, and 1800 δ-cells were counted for each mouse.
Measurement of the Blood Glucose and Plasma Insulin and Glucagon Levels
Blood glucose levels were measured at different ages with a Contour glucometer (Bayer). Blood samples were collected in heparin-coated capillaries (Analis) and plasma prepared by centrifugation for 10 min at 1,000 × g. The plasma insulin and glucagon levels were determined in 30 and 100 μl of plasma with the Mercodia ultrasensitive mouse insulin ELISA kit and the Gentaur glucagon EIA kit, respectively, according to the instructions of the manufacturers.
Glucose Tolerance Tests and Measurement of the Plasma Insulin Levels
Twelve-week-old P1-Pdx1Cre and Pdx1-Cre mice were fasted for 16 h. Glucose tolerance tests were performed and 1 mg glucose/g body weight was administered via IP injection. Blood was drawn from the tail vein at 0, 30, 60, 90, 120, and 150 min after glucose injection and blood glucose levels were measured with a Contour glucometer.
Plasma insulin levels were measured before and 30 and 120 min after glucose injection in 30 μl of plasma with the Mercodia ultrasensitive mouse insulin ELISA kit.
Determination of Insulin Secretion From the Islets
Pancreatic islets were isolated by collagenase digestion and hand-picked by microscopy. Two small, two intermediate, and one large islet were selected per group, so that each group contained islets of similar size. Batches of freshly isolated islets were preincubated in HEPES balanced salt solution (HEBSS) containing 125 mM NaCl, 5.9 mM KCl, 1.28 mM CaCl2, 1.2 mM MgCl2, 25 mM HEPES (pH 7.4), 3.3 mM glucose, and 0.1% fatty acid-free bovine albumin (Boehringer Mannheim) for 60 min. Islets in groups of five were then incubated in 500 μl of HEBSS with various glucose and forskolin concentrations for 60 min at 37°C. After incubation the medium was collected and stored at −20°C until analysis of insulin with the Mercodia ultrasensitive mouse insulin ELISA kit. Total insulin content of the islets was determined with the mercodia high range rat insulin ELISA kit.
Islet Isolation and Transplantation
Islets of 3-week-old male P1-Pdx1Cre and Pdx1-Cre mice were isolated using previously published isolation procedures (15). Briefly, the pancreas was injected locally with collagenase NB8 (Serva) in Hank's balanced salt solution and digested through vigorous shaking. The islets were hand-picked using a stereomicroscope after separation by centrifugation on a dextran gradient.
Ten- to 12-week-old nonobese diabetic-severe combined immunodeficient (NOD-SCID) &gMcnull recipient mice were anesthetized by IP injection of a mixture of 100 μg ketamine and 10 μg xylazine/g body weight. One hundred and fifty fresh islets obtained from P1-Pdx1Cre or Pdx1-Cre control littermate mice were transplanted to recipient mice under the kidney capsule.
Follow-up of Transplanted Mice
Nonfasting blood glucose levels of the transplanted mice were measured weekly for 41 weeks using a Contour glucose meter (Bayer) with blood obtained from snipped tails. Body weights were also monitored. Forty-one weeks after transplantation the mice were nephrectomized and the glucose levels measured daily for 1 week. Immunohistochemistry for insulin and amylase was performed on the nephrectomized kidneys using standard procedures described before. For amylase staining rabbit anti-α-amylase antibody (Sigma; 1:1000) and rabbit envision (DAKO) were used.
Statistical Analysis
Results are expressed as means ± SEM. Statistical analysis was performed by unpaired Student's t-test. A value of p < 0.05 was considered significant.
Results
Forced Expression of PLAG1 in the Pancreas of PLAG1 Transgenic Mice
To investigate the impact of targeted PLAG1 expression in the pancreas, the PLAG1 transgenic mouse strain was intercrossed with homozygous Pdx1-Cre transgenic mice (19) to permanently excise the stop-cassette. Consequently, all cells that expressed the Cre-recombinase driven by the Pdx1 promotor will continue to express the PLAG1 transgene even when Pdx1 is no longer expressed [a schematic representation can be found in Fig. 2A of (8)]. Such crossings resulted in Pdx1-Cre+/–/PLAG1+/– and Pdx1-Cre+/–/PLAG1–/– offspring mice designated as P1-Pdx1Cre and Pdx1-Cre mice, respectively. Pancreases of P1-Pdx1Cre mice displayed a mosaic expression of the transgene in the nuclei of exocrine and endocrine cells, as demonstrated by immunohistochemical analysis using an antibody against the HA tag cloned downstream of the PLAG1 cDNA (Fig. 1A). Pdx1-mediated mosaic expression of the Cre-recombinase has also been shown by Heiser et al. in this strain of Pdx1-Cre mice (17). No expression of the transgene could be detected in pancreases of littermate Pdx1-Cre mice (Fig. 1B).
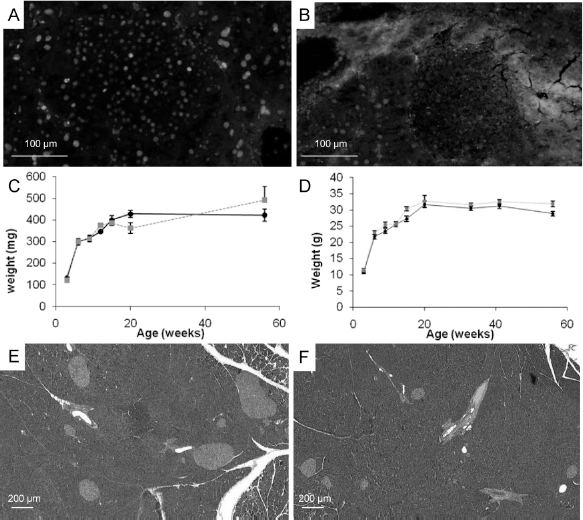
Pancreatic and duodenal homeobox-1 (Pdx1)-Cre-mediated targeted expression of pleomorphic asdenoma gene-like 1 (PLAG1) in pancreas leads to islet hyperplasia. (A) Immunofluorescent staining using an antibody against hemagglutinin (HA) shows a mosaic expression of the HA-tagged PLAG1 transgene in a pancreatic section of a 20-week-old P1-Pdx1Cre mouse. (B) Immunofluorescent staining using an antibody against HA to detect the expression of the HA-tagged PLAG1 transgene shows no staining in a pancreatic section of a 20-week-old Pdx1-Cre mouse. (C) The total pancreatic weight of P1-Pdx1Cre mice is similar to that of littermate Pdx1-Cre mice during 1 year. (D) The total body weight of P1-Pdx1Cre mice is similar to that of littermate Pdx1-Cre mice during 1 year. (E) Hematoxylin/eosin staining on a pancreatic section of a 20-week-old P1-Pdx1Cre mouse to illustrate the islet hyperplasia observed in those mice. (F) Hematoxylin/eosin staining on a pancreatic section of a 20-week-old Pdx1-Cre mouse shows a normal organ structure.

Islet cell distribution in P1-Pdx1Cre mice and electron microscopy on β-cells. Staining for insulin (A, D), glucagon (B, E), and somatostatin (C, F) on representative sections of the pancreas of a 2-month-old Pdx1-Cre (A–C) and P1-Pdx1Cre (D–F) mouse shows that the islet cell distribution in P1-Pdx1Cre mice is disturbed, with non-β-cells in the center of the islets. Electron microscopy did not reveal any differences between the β-cells of 30-week-old P1-Pdx1Cre (G) and Pdx1-Cre (H) mice at the ultrastructural level.
Forced Expression of PLAG1 in the Pancreas of Mice Leads to Islet Hyperplasia
The pancreatic weights (Fig. 1C) and the total body weights (Fig. 1D) of P1-Pdx1Cre mice were similar to those of Pdx1-Cre littermates over a period of 1 year. Islet hyperplasia was observed in pancreases of female and male P1-Pdx1Cre mice from 12 weeks onwards (Fig. 1E) compared to littermate Pdx1-Cre mice (Fig. 1F). There was a mild disturbance of islet cell distribution of P1-Pdx1Cre mice, as non-β-cells were randomly distributed through some islets of P1-Pdx1Cre but not of Pdx1-Cre mice (Fig. 2A–F). No ultrastructural differences were observed between β-cells from 30-week-old P1-Pdx1Cre mice (Fig. 2G) and littermate Pdx1-Cre mice (Fig. 2H). The β-cells showed a normal granulation, RER, mitochondria, golgi, and secretory granules.
One P1-Pdx1Cre mouse developed a malignant epithelial tumor in the pancreatic region with no endocrine characteristics (synaptophysin negative) at 1 year, while no tumors were observed in younger mice (data not shown). All the P1-Pdx1Cre mice died before the age of 75 weeks with severe hypoglycemia (<20 mg/dl). No obvious histological differences were observed in the exocrine pancreas and ducts of P1-Pdx1Cre mice at all time points investigated (data not shown).
Time Course for the Development of the Islet Hyperplasia
To further characterize the observed islet hyperplasia the total pancreatic insulin, somatostatin, and glucagon content were measured at different time points after birth. The pancreatic insulin content of P1-Pdx1Cre mice was not increased at 9 weeks but appeared elevated at all time points afterwards (Fig. 3A). A similar increase in total pancreatic somatostatin content (Fig. 3B) was seen in P1-Pdx1Cre mice compared to littermate Pdx1-Cre mice. By contrast, the total pancreatic glucagon content did not increase in P1-Pdx1Cre mice in comparison to littermate Pdx1-Cre mice (Fig. 3C). This was further confirmed by examining the α-, β-, and δ-cell mass of P1-Pdx1Cre mice at 37 weeks. The β- and δ-cell mass were increased 1.5- and 1.6-fold, respectively, whereas the α-cell mass in P1-Pdx1Cre mice was not increased in comparison to littermate Pdx1-Cre mice (Fig. 3D). Although the increase of the β-cell mass was not significant in P1-Pdx1Cre mice compared to Pdx1-Cre mice at 37 weeks (p = 0.13), the β-cell mass was significantly increased in 20-week-old P1-Pdx1Cre mice (from 3.0 ± 0.12 mg in Pdx1-Cre mice to 4.9 ± 0.67 mg in P1-Pdx1Cre mice; p = 0.03).

Quantification of the total pancreatic insulin, somatostatin, and glucagon content and of the β-, α-, and δ-cell mass of P1-Pdx1Cre mice. Total pancreatic insulin (A), somatostatin (B), and glucagon (C) contents of P1-Pdx1Cre mice (solid line) and littermate Pdx1-Cre mice (dashed line) were measured at different time points after birth. At least 10 mice were included for each group at each time point. (D) The β-cell mass and the δ-cell mass of 37-week-old P1-Pdx1Cre mice (black bar) are increased compared to those of littermate Pdx1-Cre mice (gray bar). The α-cell mass was not increased in 37-week-old P1-Pdx1Cre (black bar) and Pdx1-Cre (gray bar) littermate mice. Four mice were analyzed per group. Results are represented as mean+ SEM. *p ≤ 0.05; **p ≤ 0.005.
Increased Proliferation Is One of the Mechanisms That Contributes to the Islet Hyperplasia
The increase in β- and δ-cell mass but not α-cell mass in older P1-Pdx1Cre mice could be due to increased proliferation of PLAG1-overexpressing β- and δ-cells. To address this we performed double fluorescent staining for insulin, somatostatin, or glucagon, with Ki67 on pancreases of 37-week-old P1-Pdx1Cre and littermate Pdx1-Cre mice. The β-cell proliferation (=insulin+/Ki67+ cells) was 2.7 times (Fig. 4A) and the δ-cell proliferation 8.5 times (Fig. 4B) higher in 37-week-old P1-Pdx1Cre mice than in littermate Pdx1-Cre mice. This suggests that increased β-cell and δ-cell proliferation is at least one of the mechanisms that causes the islet hyperplasia. Other mechanisms such as changes in apoptosis rate may also contribute. In contrast, α-cell proliferation was not significantly increased in 37-week-old P1-Pdx1Cre mice relative to littermate Pdx1-Cre mice (Fig. 4C).

Quantification of β-, δ-, and α-cell proliferation of P1-Pdx1Cre mice. (A) β-Cell proliferation of 37-week-old P1-Pdx1Cre mice (black bar) was 2.7 times increased compared to littermate Pdx1-Cre mice (grey bar). (B) δ-Cell proliferation of 37-week-old P1-Pdx1Cre mice (black bar) was 8.5 times increased compared to littermate Pdx1-Cre mice (gray bar). (C) α-Cell proliferation of 37-week-old P1-Pdx1Cre mice (black bar) was not significantly increased compared to littermate Pdx1-Cre mice (gray bar). Four mice were analyzed for each group. The results are represented as mean ± SEM. *p ≤ 0.05.
Impact of the Islet Hyperplasia on the Glucose Homeostasis
To investigate the impact of an increase in β- and δ-cell mass on glucose homeostasis, blood glucose levels were measured at different time points after birth. The blood glucose levels were already slightly decreased at 9 weeks (Fig. 5A). Glucose tolerance tests (GTT) performed with 12-week-old P1-Pdx1Cre mice showed significantly lower blood glucose levels and significantly higher insulin levels at all time points compared to Pdx1-Cre littermates (Fig. 5B, C). From 25 weeks of age onwards P1-Pdx1Cre mice became progressively more hypoglycemic (Fig. 5A). Fasting plasma insulin levels of 37-week-old P1-Pdx1Cre mice were significantly increased (Fig. 5D). To determine if the hyperinsulinemia was due to increased insulin secretion per β-cell, five islets from 12-week-old P1-Pdx1Cre or Pdx1-Cre mice were stimulated with 5, 10, and 20 mM glucose or 10 mM glucose + 3 μM forskolin for 1 h at 37°C, and insulin secretion determined. Islets from both mouse strains secreted similar amounts of insulin after correction for the total islet insulin content (Fig. 5E), thus indicating that insulin secretion on a per cell basis was unchanged and that the hyperinsulinemia is caused by increased β-cell mass.

Glucose homeostasis and glucose tolerance test (GTT) in P1-Pdx1Cre mice. (A) Nonfasting blood glucose levels of P1-Pdx1Cre (solid line) and Pdx1-Cre mice (dashed line) are shown in function of time. (B, C) Intraperitoneal GTT on 12-week-old P1-Pdx1Cre (solid line) and on Pdx1-Cre mice (dashed line). The mice were starved for 16 h and injected with 1 mg/g glucose. Blood glucose (B) and plasma insulin (C) levels were measured at the indicated times. GTT was performed on at least 10 P1-Pdx1Cre and 10 Pdx1-Cre mice. (D) Fasting plasma insulin, glucagon, and somatostatin levels of 37-week-old P1-Pdx1Cre (black bars) and littermate Pdx1-Cre mice (gray bars). (E) Insulin secretion by freshly isolated islets stimulated for 60 min at 37°C with different concentrations of glucose or glucose and forskolin was measured. Results are represented as mean ± SEM. *p ≤ 0.05; **p ≤ 0.005.
In agreement with the pancreatic glucagon content and α-cell mass content, the basal plasma glucagon levels were similar in 37-week-old P1-Pdx1Cre mice and in littermate Pdx1-Cre mice (Fig. 5D). Even though there was an increased pancreatic somatostatin content, no differences could be observed in the total somatostatin levels in the plasma (Fig. 5D). This may be due to the majority of circulating somatostatin not being produced by pancreatic δ-cells but by other neuroendocrine cells in the gastrointestinal and central nervous system (16).
The Hypoglycemia Observed in P1-Pdx1Cre Mice Is Islet Cell Intrinsic
To prove that the hypoglycemia seen in P1-Pdx1Cre mice is caused by the forced expression of PLAG1 in the endocrine pancreas, we transplanted 150 islets from 3-week-old P1-Pdx1Cre or littermate Pdx1-Cre mice under the kidney capsule of NOD-SCID γcnull mice. Approximately 25 weeks after transplantation of P1-Pdx1 Cre islets, the glycemia levels of NOD-SCID γcnull mice were significantly decreased compared to those in mice transplanted with islets from Pdx1-Cre mice (Fig. 6A). The decrease in glucose levels observed following transplantation of P1-Pdx1Cre islets was reversed after nephrectomy, indicating that this decrease was caused by the graft (Fig. 6A). β-Cells could easily be detected in the grafts (Fig. 6B), while no amylase-positive exocrine cells were detected (Fig. 6C), demonstrating that the hypoglycemia in P1-Pdx1Cre mice was islet intrinsic.

Transplantation of 150 islets from P1-Pdx1Cre and Pdx1-Cre mice under the kidney capsule of nonobese diabetic severe combined immunodeficient (NOD-SCID) γcnull mice. (A) One hundred and fifty islets from P1-Pdx1Cre (solid line) and littermate Pdx1-Cre (dashed line) mice were transplanted under the kidney capsule of NOD-SCID γcnull mice. Blood glucose levels are given in function of time. Six mice were included in each group. Forty-one weeks after transplantation, the graft was removed by nephrectomy. Insulin (B) and amylase (C) staining was performed on the grafts transplanted with islets of P1-Pdx1Cre mice. (D) As a positive control, amylase staining was also performed on the pancreas of a wild-type mouse.
P1-Ngn3Cre Mice Develop Islet Hyperplasia and Remain Normoglycemic
To investigate the impact of targeted PLAG1 overexpression in endocrine cells only, PTMS mice were crossed with Ngn3-Cre mice. While no expression of the HA-tagged transgene was observed in Ngn3-Cre mice (Fig. 7A), most of the endocrine cells expressed the HA-tagged transgene in P1-Ngn3Cre mice, as shown by immunofluorescent staining (Fig. 7B). The total body weight (Fig. 7C) of P1-Ngn3Cre mice remained similar to that of littermate Ngn3-Cre mice over a period of 1 year. The pancreatic weight of P1-Ngn3Cre mice at 37 weeks was similar to that of littermates Ngn3-Cre mice (Fig. 7D). The total pancreatic content of insulin and somatostatin was already significantly increased at 15 weeks (Fig. 7E, F). The total pancreatic glucagon content in P1-Ngn3Cre mice was equal to that in littermate Ngn3-Cre mice, which is similar to P1-Pdx1Cre mice (Fig. 7G). However, the degree of increase in insulin and somatostatin content in pancreases of P1-Ngn3Cre mice differed from those in P1-Pdx1Cre mice. For instance, in 1-year-old P1-Ngn3Cre mice the fold increase of the pancreatic content for insulin, somatostatin, and glucagon was 3.6, 2.4, and 1.0, respectively, while the fold increase in 1-year-old P1-Pdx1Cre mice was 1.8, 3.8, and 1.1, respectively. This was associated with persistent normoglycemia in P1-Ngn3Cre mice (Fig. 7H), while P1-Pdx1Cre mice developed severe hypoglycemia from 25 weeks onwards (Fig. 5A).

Characterization of the P1-neurogenin-3 (P1-Ngn3)Cre mice. (A) Immunofluorescent staining using an antibody against HA to detect the expression of the HA-tagged PLAG1 transgene shows no staining in a pancreatic section of a 20-week-old Ngn3-Cre mouse. (B) Immunofluorescent staining using an antibody against HA shows a mosaic expression of the HA-tagged PLAG1 transgene in a pancreatic section of a 20-week-old P1-Ngn3Cre mouse. (C) The total body weight of P1-Ngn3Cre mice is similar to that of littermate Ngn3-Cre mice over a period of 1 year. (D) Total pancreatic weight of 37-week-old P1-Ngn3Cre mice is similar to that of littermate Ngn3-Cre mice. The total pancreatic insulin (E), somatostatin (F), and glucagon (G) content of P1-Ngn3Cre mice (solid line) and littermate Ngn3-Cre mice (dashed line) were measured at different time points after birth. At least five mice were included for each group at each time point. (H) Nonfasting blood glucose levels of P1-Ngn3Cre (solid line) and Ngn3-Cre mice (dashed line) are shown in function of time. Results are represented as mean ± SEM. *p ≤ 0.05; **p ≤ 0.005.
Discussion
Previous reports demonstrated that overexpression of the developmentally regulated PLAG1 gene occurs frequently in various human tumors (2,4,22,25,33). In mice the oncogenic property of PLAG1 has also been shown in vivo by tissue-specific expression, leading to salivary gland tumors (10,35), adenomyoepitheliomas of the mammary gland (9), and cavernous angiomatosis (31). Here, we demonstrate that in contrast to the salivary and mammary gland, forced expression of PLAG1 in the pancreas causes islet hyperplasia but rarely tumor formation. The difference in transformation capacity between the mammary or salivary gland and the pancreas could be due to the relative resistance of the pancreas to transformation. An additional explanation may be that a threshold expression of PLAG1 is required to confer tumorigenesis. A difference in transformation capacity in different organs has also been described for other transgenic mouse models. For instance, forced expression of cyclin D1 in murine mammary tissue or hepatocytes (7,32) results in tumor formation whereas forced expression in the pancreas only leads to benign islet hyperplasia (34). Likewise, forced expression of Igf2 in the mammary gland results in tumor formation (3,28) but in the pancreas it leads only to islet hyperplasia (13).
P1-Pdx1Cre and P1-Ngn3Cre mice developed hyperplasia of the islets of Langerhans but not of the exocrine pancreas. Within the endocrine pancreas hyperplasia of the β- and δ-cell population was seen but was absent with α-cells. It still remains unclear why forced expression of PLAG1 leads to increased β- and δ-cell proliferation while the α-cell proliferation remains unaltered. Perhaps different molecular mechanisms are regulating the proliferation in those different cell types.
Previously, we have shown that RIP-Cre-mediated targeted PLAG1 expression (P1-RIPCre mice) in β-cells only resulted in hyperplasia of the islets of Langerhans with hyperinsulinemia (8). In those mice, only the total pancreatic insulin content was significantly increased when compared to littermate RIP-Cre mice. Although P1-RIPCre mice also developed hyperinsulinemia combined with an increased ability of glucose clearing during GTT, they remained normoglycemic due to development of hepatic insulin resistance (8).
One striking difference between the three different PLAG1 transgenic mouse lines, which each express PLAG1 in a different compartment of the pancreas, is that P1-Pdx1Cre mice develop severe hypoglycemia while P1-RIPCre and P1-Ngn3Cre mice remain normoglycemic. Hypoglycemia in P1-Pdx1Cre mice cannot be explained by targeted expression of PLAG1 in the exocrine pancreas or to a leaky expression in other organs such as the brain (where Pdx1 is also expressed during development) (29). It is more likely to be caused by the endocrine pancreas, as decreased glycemia was also observed after grafting islets of P1-Pdx1Cre mice in normoglycemic animals. Hypoglycemia in P1-Pdx1Cre mice can be explained by the imbalance in hormone levels in the pancreas of old P1-Pdx1Cre mice, which differs from P1-Ngn3Cre and P1-RIPCre mice. An overview of the increase of different endocrine hormones in the pancreas of P1-Pdx1Cre, P1-Ngn3Cre, and P1-RIP Cre mice in relation to the blood glucose levels at different time points after birth is given in Table 1. In P1-RIPCre mice only the total pancreatic insulin level was significantly increased. The total pancreatic insulin content of 37–41-week-old P1-RIPCre and P1-Ngn3Cre mice was 3.1 times increased, while the total pancreatic insulin content of P1-Pdx1Cre mice was only 1.6 times increased (Table 1). This difference may be explained by the fact that in P1-Pdx1Cre mice only part of the β-cells express the PLAG1 transgene due to the mosaic expression of the Cre-recombinase in Pdx1-Cre mice (17), whereas almost all β-cells express PLAG1 in P1-RIPCre and P1-Ngn3Cre mice. In P1-Pdx1Cre and P1-Ngn3Cre mice the total pancreatic insulin levels were significantly increased along with the total pancreatic somatostatin levels, while the total pancreatic glucagon content remained unchanged. The increase of insulin versus somatostatin in the pancreas differed between the following transgenic mouse strains: in older P1-Pdx1Cre mice, the increase of somatostatin was higher than that of insulin while in young P1-Pdx1Cre mice and in P1-Ngn3Cre mice the increase of insulin was similar or higher than that of somatostatin. This suggests that specific hormonal imbalances may cause insulin resistance whereas others cause hypoglycemia (or even hyperglycemia). One possible explanation is that hypoglycemia in old P1-Pdx1Cre mice but not in young P1-Pdx1Cre, P1-Ngn3Cre, or P1-RIPCre mice could be due to the increase in somatostatin preventing insulin resistance. It has been described that somatostatin can decrease insulin resistance (24). However, no increase in the total plasma somatostatin level was observed in P1-Pdx1Cre mice despite a 3.8-fold increase in the pancreatic somatostatin content. This is likely caused by the fact that less than 5% of circulating somatostatin comes from the endocrine pancreas. The majority of circulating somatostatin is derived from other endocrine tissues, primarily the gastrointestinal epithelium (30). Alternatively, other hormones may contribute to the hypoglycemia in P1-Pdx1Cre mice.
Overview of the Fold Increase of the Different Endocrine Hormones and the Glycemia Levels

Fold increase of total pancreatic insulin, somatostatin, and glucagon content and the blood glycemia level of P1-pancreatic and duodenal homeobox 1 (P1-Pdx1)Cre, P1-neurogenein-3 (P1-Ngn3)Cre, and P1-rat insulin II gene promoter (P1-RIP)Cre mice compared to littermate Pdx1-Cre, Ngn3-Cre, and RIP-Cre mice, respectively, are shown at three different time points after birth (n = 5–10).
Other murine studies also demonstrated that specific pancreatic hormonal imbalances may lead to either normoglycemia, hypoglycemia, or even hyperglycemia. For instance, mono- or biallelic loss of Arx and/or Pax4 leads to different phenotypic changes in hormone-producing cell populations. This leads to decreased or increased insulin-, glucagon-, or somatostatin-producing cells, which, depending on the levels of the different hormones, are associated with hypoglycemia, normoglycemia, or hyperglycemia (6).
Recent developments in regenerative medicine give new hope for the next generation of diabetes treatment (5,23). It should be noted that upon differentiation of stem cells into pancreatic β-cells, mixtures of β-, a-, and δ-cells are generated and grafted. From the present study, it becomes clear that the balance of different endocrine cell types present in the transplant should be taken into account in the future in order to prevent hypoglycemia in diabetic patients treated by transplantation of stem cells differentiated into the pancreatic lineage.
Footnotes
Acknowledgments
The authors would like to thank Pedro Herrera for providing the Pdx1-Cre and Ngn3-Cre transgenic mice. We thank Valerie Roobrouck for her critical review of this manuscript to assure accuracy of the data, Scott Roberts for proofreading this manuscript, Jos Laureys for his help with the islet transplantation experiments, and Tineke Notelaers and Kristel Eggermont for their help with the quantifications of the islet cell mass and islet cell proliferation. J.D. and C.G. are postdoctoral fellows of the “Fonds voor Wetenschappelijk Onderzoek Vlaanderen” (FWO). CM. is holder of a Clinical Research Fellowship (FWO). This work was supported in part by the FWO grant 1.5.014.09 to J.D., the FWO grant G.0601.07 to C.M.V., C.M., and C.G., an FWO Odysseus award to C.M.V., K.U. Leuven CoE SCIL funds to C.M.V. and C.M., the K.U. Leuven grant GOA 2008/16 to C.M. and F.S., FWO-G.0400.07 to D.P., and the Belgian Ministry for Science Policy (IAP grant P6/40 to D.P., F.S., and C.M.).