
Abstract
This study was undertaken to compare the phenotype of human articular chondrocytes (ACs) and bone marrow-derived mesenchymal stem cells (MSCs) after cell expansion by studying the spectrum of proteins secreted by cells into the culture medium. ACs and MSCs were expanded in monolayer cultures for some weeks, as done in standard cell transplantation procedures. Initially, the expression of cartilage signature genes was compared by real-time PCR. Metabolic labeling of proteins (SILAC) in combination with mass spectrometry (LC/MS-MS) was applied to investigate differences in released proteins. In addition, multiplex assays were carried out to quantify the amounts of several matrix metalloproteases (MMPs) and their natural inhibitors (TIMPs). Expanded chondrocytes showed a slightly higher expression of cartilage-specific genes than MSCs, whereas the overall spectra of released proteins were very similar for the two cell types. In qualitative terms MSCs seemed to secrete similar number of extracellular matrix proteins (43% vs. 45% of total proteins found) and catabolic agents (9% vs. 10%), and higher number of anabolic agents (12 % vs. 7%) compared to ACs. Some matrix-regulatory agents such as serpins, BMP-1, and galectins were detected only in MSC supernatants. Quantitative analyses of MMPs and TIMPs revealed significantly higher levels of MMP-1, MMP-2, MMP-3, and MMP-7 in the medium of ACs. Our data show that after the expansion phase, both ACs and MSCs express a dedifferentiated phenotype, resembling each other. ACs hold a phenotype closer to native cartilage at the gene expression level, whereas MSCs show a more anabolic profile by looking at the released proteins pattern. Our data together with the inherent capability of MSCs to maintain their differentiation potential for longer cultivation periods would favor the use of these cells for cartilage reconstruction.
Introduction
Articular cartilage is thin avascular tissue that covers the terminal edges of bones, providing gliding surfaces and thus frictionless motion to the joints. Due to its limited capacity for self-repair, damaged cartilage needs in many occasions surgical interventions for either repair or replacement of the destroyed tissue. During the last decades a plausible amount of endeavors have been directed towards facilitating the biological repair of articular cartilage defects. The alternative methods have been diverse in nature, being based, for example, on ex vivo engineered tissue implants (40), the transplantation of autologous cells in different ways (14), or the injection of novel matrices embedding cells of different natures along with tailored cocktails of growth factors (24).
Looking at the attempts for biological repair of articular cartilage pursued in both animals and human models during the last two decades, the most widely used cell sources are autologous chondrocytes and bone marrow-derived stem cells. Over 20,000 surgical interventions have been performed worldwide using autologous chondrocytes implantation (ACI), a procedure launched by Brittberg and coworkers in the early 1990s (3). During the following years refinements of the ACI technique have been brought into practice by introducing new elements such as the use of collagen membranes instead of periosteal flaps (10), the differential selection of chondrocytes with high proliferation and differentiation potential from the total pool of harvested cells (35), or the use of matrix as cell carrier, an ACI variant termed MACI (12,20,29). In parallel, homologous approaches have also been attempted by using stem cells or chondroprogenitors instead of adult chondrocytes (15,32,38, 39). Studies have been undertaken to compare the outcomes following transplantation procedures using these two cell types (2,18). The final outcomes in most cases are showing similar upshots regarding clinical scores and quality of the repaired cartilage, in most instances of fibrocartilage appearance (17,33,37).
The dispute on which is the best cell type to attempt local cartilage repair or for creating laboratory engineered cartilage still remains. Defenders of the chondrocytes argue that adult chondrocytes are intrinsically programmed to produce an adult type of articular cartilage while for stem cells the differentiation process in most cases is not completely achieved and thus the resulting cartilage tissue is relatively immature (23,30). On the other hand, friends of the use of mesenchymal stem cells (MSCs) claim that harvesting stem cells is less invasive, that they have higher proliferative potential, and that the cells do not lose their differentiation capacity upon cell expansion in monolayer cultures, whereas chondrocytes may gradually dedifferentiate into a fibroblast-like cell, a phenomenon that can be irreversible if the expansion period is carried out for too long (4,26).
A limited number of studies have been conducted hitherto to compare the phenotypes of these cell types at more cellular and molecular levels. Because many of the established approaches apply in vitro expanded articular chondrocytes (ACs) and MSCs, this work was undertaken to explore the phenotypic differences between these two cell types after being expanded in monolayers for some weeks. We have focused our efforts on comparing secretomes of the two cell types during cell growth. Our data revealed intriguing differences between ACs and MSCs and provided novel insights to help understanding the nature of these two cell types and their predisposition for cartilage rebuilding before implantation.
Materials and Methods
Patient Data and Human Material
Bone marrow aspirates were harvested during surgical interventions from distal and proximal femurs as follows: i) MSCs from two patients aged 55 and 66 were extracted from the bone marrow of the proximal femur during total hip arthroplasty; ii) MSCs from another three other patients aged 35, 39, and 28 were extracted from the bone marrow of femoral condyle during arthroscopic microfracture procedure.
Human ACs were obtained from the surplus cells from patients undergoing autologous chondrocyte implantation (ACI). Initial biopsies were taken from non-weight-bearing areas, where macroscopically normal cartilage could be obtained. Cells from five different patients aged 39, 35, 32, 30, and 21 years old were included in this study. The patients participated with informed consent, and the Regional Ethical Committee at the University of Tromsø approved the study.
Isolation and Culturing of Human ACs and MSCs
Adult chondrocytes were isolated as previously described (23). Briefly, cartilage biopsies were collected and cut into 1–1.5-mm3 pieces. Enzymatic digestion of tissues was carried out for 18 h in 2–5 ml DMEM/HAM's F-12 (Cat. No. T 481–50, BioChrom Labs, Terre Haute, IN, USA) containing collagenase (Cat. No. C-9407, Sigma-Aldrich, Norway AS, Oslo, Norway) at a final concentration of 0.8 mg/ml. Digested cartilage was filtrated and the cell suspension was washed and thereafter resuspended in fresh growth medium (DMEM/HAM's F-12 supplemented with 10% human autologous serum). Cultures were further expanded by trypsinization (Cat. No. T-3924, Sigma). Chondrocyte growth was prolonged during 3–4 weeks in autologous serum to meet the requirements for ACI treatment. Surplus cells were thereafter cryopreserved until enough cells from several different donors were collected.
Marrow-derived mesenchymal stem cells were isolated as previously described (9). Briefly, about 6 ml of bone marrow was collected from each individual. Marrow aspirates were diluted 1:2 with basal medium and subjected to a discontinuous Ficoll gradient (Histopaque-1119, Sigma-Aldrich). The nucleated cell fractions were collected, washed in PBS, and resuspended in growth medium containing DMEM/HAM's F-12 supplemented with 10% fetal bovine serum (FBS). Cell suspensions were then plated in culture flasks at a density of 5 × 10⁴ nucleated cells/cm2, and cultured at 37°C in a humidified atmosphere containing 5% CO2. Medium changes were performed every 3–4 days and all nonadherent cells were discarded. After the initial 2–3 weeks of growth in primary cultures, MSCs were further expanded by trypsinization (Cat. No.T-3924, Sigma).
Preparation of Conditioned Medium for SILAC
DMEM and amino acids were from the Stable isotope labeling with amino acids in cell culture (SILAC™) Protein Identification and Quantitation Kit purchased from Invitrogen (Cat. No. SM10002, CA, USA). Basal medium was supplemented with ascorbic acid, L-glutamine, dexamethasone, antibiotics, and insulin-transferrin-selenium (ITS) supplement (Sigma-Aldrich, Cat. No. I3146-5ML). Amino acids [U-13C6]L-arginine and [U-13C6]L-lysine were added to the medium as described in the protocol for the kit. After initial cell expansion, 1.5 × 10⁶ MSCs and ACs were seeded in T-75 cell culture flasks. Culture medium was originally supplemented with 10% FBS to promote cell adherence during the first 24 h. After cell attachment, the cultures were extensively washed with basal DMEM medium, and thereafter the cells were incubated in 6 ml of [U-13C6]L-lysine and [U-13C6]L-arginine culture medium. Supernatants were removed after 5 days and replaced by the fresh labeled medium. The new supernatants were conditioned during additional 5 days and collected for analyses.
Quantitative Real-Time PCR
Cartilage was homogenized in liquid nitrogen before RNA was extracted using Trizol Reagent (Invitrogen) according to the manufacturer's protocol. The extracted RNA was then purified using a Qiagen RNeasy Mini kit (Qiagen, Germany) according to the manufacturer's protocol, and nucleic acid concentrations were measured with a spectrophotometer (NanoDrop ND-1000; Saveen & Werner, Norway). Total RNA from ACs and MSCs was extracted directly by a Qiagen RNeasy Mini kit and then quantified. A 20-μl aliquot of first-strand cDNA was generated by incubating a mixture of 100 ng of RNA, 1 (0.l of 0.5 μg/μl oligo(dT) primers, and 1 fo.l of 10 mM dNTPmix at 65°C for 5 min. The mixture was cooled on ice, after addition of 4 μl 5′ First Strand Buffer, 1 μl of 0.1 M dithiothreitol (DTT), 1 μl of 40 U/μl RNaseOUT, and 1 μl of 200 U/μl Superscript III reverse transcriptase (Invitrogen). The reaction was then carried out at 50°C for 40 min and 70°C for 15 min on a PTC-200 DNA Engine thermal cycler (MJ Research, Waltham, MA, USA). Quantification was performed using the ABI Prism 7900 Fast Sequence Detection System (Applied Biosystems, CA, USA) according to the comparative CT method. Real-time PCR reactions were performed using 2 μl of each reverse-transcribed sample. Cycle temperatures and times as well as primers and probes used for the reference gene (glyceraldehydes 3-phosphate dehydrogenase; GAPDH) and the genes of interest [collagen type I, collagen type II, aggrecan, and sex determining region Y box 9 (sox-9)] were as previously described (8). A validation experiment was performed to determine the efficiencies of the reactions (22). Because all probes are designed over an exon–exon junction, genomic DNA can be excluded as a template in the real-time PCR reaction. Transcript quantification was performed in duplicate for each sample, and the assay was repeated on material from three patients. The amount of targets was analyzed using the comparative CT method, where the threshold cycle (CT) values of each target sequence are given by the 2-ΔΔCT formula (19). We present the data as log n-fold change in gene expression normalized to the endogenous reference gene (GAPDH) and relative to the expression in the ACs cultured in monolayers. Statistical differences were evaluated with confidence intervals and t-test using Bonferroni correction. The differences are considered significant at p < 0.05.
Preparation of Protein Samples and 1D Gel Electrophoresis
Six milliliters of conditioned cultured supernatants were collected from each flask (2 × 10⁶ cells), and sterile filtered with 0.22 μm syringe filter units to remove potential cell debris and particulate material from fluids. Subsequently, the supernatants were concentrated by ultrafiltration (membrane cut-off 3 kDa, Vivascience, France) at 4,500 rpm for 50 min, until a final volume of 200–800 μl was obtained. Protein quantification was performed for each concentrated supernatant using the Bradford protein assay. Supernatants were thereafter mixed in sample buffer (NuPAGE, Invitrogen), and sample reducing agent (NuPAGE, Invitrogen), and about 40 μg of total protein were loaded to the gel (NuPAGE Novex Bis-Tris 4–12%, Invitrogen). The electrophoresis was performed using XCell SureLock™ Mini-Cell system (Invitrogen).
Gel Fractionation (Shotgun), Trypsin Digestion, and Mass Spectrometry
After gel electrophoresis the whole protein run was cut into bands. Around 20 gel sections were collected from each column. Gel pieces were subjected to gel reduction, alkylation, and tryptic digestion using 2 × 10 ng/μl trypsin (V511A, Promega, Wisconsin, USA) (36). Peptide mixtures containing 0.1% formic acid were loaded onto a nanoAcquity™ Ultra Performance LC (Waters, MA, USA), containing a 3-μm Symmetry® C18 Trap column (180 μm × 22 mm) (Waters) in front of a 1.7-μm Atlantis™ C18 analytical column (100 μm × 100 mm) (Waters). Peptides were separated with a gradient of 5–95% acetonitrile, 0.1% formic acid, with a flow of 0.4 μl/min eluted to a Q-TOF Ultima Global mass spectrometer (Micromass/Waters) and subjected to data-dependent tandem mass spectrometry analysis. Peak lists were generated by the ProteinLynx Global server software (version 2.1). The resulting pkl files were searched against the Swiss-Prot 55.5 protein sequence databases using an in-house Mascot server (Matrix Sciences, UK). Peptide mass tolerances used in the search were 100 ppm, and fragment mass tolerance was 0.1 Da. Proteins identified in Mascot containing peptides with bold red peptides containing the label 13C(6) (K) and 13C(6) (R) were identified as secreted. Proteins identified in Mascot with bold red lysine- or arginine-containing peptides were classified as not secreted.
Western Blotting
Supernatants were mixed in sample buffer (NuPAGE, Invitrogen) and sample reducing agent (NuPAGE, Invitrogen), and about 30 μg of total protein was loaded to the gel (NuPAGE Novex Bis-Tris 4–12%, Invitrogen). Sodium dodecyl sulphate-polyacrylamide gel electrophoresis (SDS-PAGE) was performed using XCell SureLock™ Mini-Cell system (Invitrogen). Following electrophoresis, the proteins were transferred to polyvinylidene difluoride (PVDF) membranes with pore size 0.2 μm (Invitrogen). Immunoblotting was performed using primary antibodies recognizing matrix metalloprotease 3 (stromelysin; MMP3), secreted protein, acidic, cysteinrich (SPARC; osteonectin), osteomodulin (OMD), chitinase-3-like protein 2 (CHI3L2) (all from Abcam), growth arrest specific protein 6 (GAS6; from AbNOVA), bone morphogenic protein 1 (BMP-1), galectin 1 (both from ABD Serotec), and serpin 12 (from ACRIS-Anti-bodies). The membranes were blocked with 3% dried milk in 10 mM Tris-HCl, pH 7.4, 0.15 M NaCl, and 0.2% Tween, and incubated with the primary antibodies at a 1:1,000 dilution followed by a secondary antibody conjugated to horseradish peroxidase (1:5,000 dilution). Bound antibody was detected by chemiluminescence (42).
Fluorescent Bead-Based Fluorokine-Multi Analytes Profiling Assay (Luminex)
MMPs and TIMPs measurements were performed using a suspension array technique (Bio-plex 200, Bio-Rad, CA, USA). One ampoule of each supernatant was thawed on ice. The levels of MMPs (MMP-1, –2, –3, –7, –9, and –13) were analyzed with a MMP multiplex kit (Cat. No. LMP000, R&D Systems, MI, USA). The samples were run in duplicate in 1:5 dilutions. The levels of TIMPs (TIMP-1, –2, –3, and –4) were analyzed with a TIMP multiplex kit (Cat. No. LKT-003, R&D Systems). The samples were run in duplicate in 1:5 dilutions. The levels of MMPs and TIMPs were detected using the Bio-plex 200 analyzer according to instructions from the manufacturer. Statistical differences were evaluated with confidence intervals and paired t-test using Bonferroni correction. The differences were considered significant at p < 0.05.
Results
Analysis of Cartilage Signature Gene Expression in Cartilage and Culture Expanded ACs and MSCs
Expression of cartilage-specific genes, including collagen II, collagen I, aggrecan and sox9, was used to explore the chondrogenicity of ex vivo expanded ACs and MSCs. Both cell types were cultured under the same conditions for 3–5 weeks before mRNA extraction. The expression of collagen type II was significantly lower in both cell types when compared to native cartilage (p < 0.001), whereas the expression of collagen type I was significantly higher in cultured cells, which indicate cellular dedifferentiation. Moreover, after comparing the results from ACs and MSCs, chondrocytes had a significantly higher expression of collagen II, aggrecan, and sox9 than MSCs (p < 0.05), and lower values of collagen I, which suggest a phenotype of cultured chondrocytes closer to native cartilage cells than cultured MSCs (Fig. 1).

Comparative real-time PCR analysis of cartilage-specific genes in cultured articular chondrocytes (ACs), mesenchymal stem cells (MSCs), and cartilage. Following 3–5 weeks of cell expansion in monolayers, the total mRNA was extracted from ACs, MSCs, and fresh cartilage tissues, and the gene expression of collagen type II, collagen type I, aggrecan, and sex determining region Y box 9 (sox9) was measured by semiquantitative real-time PCR. Data are expressed relative to the transcript levels in ACs. All experimental values were normalized against glyceraldehydes 3-phosphate dehydrogenase (GADPH). The results are mean values of three independent measurements run in duplicate (*p < 0.05 and **p < 0.001).
Mass Spectrometric Analyses of the Secretome of Cultured ACs and MSCs
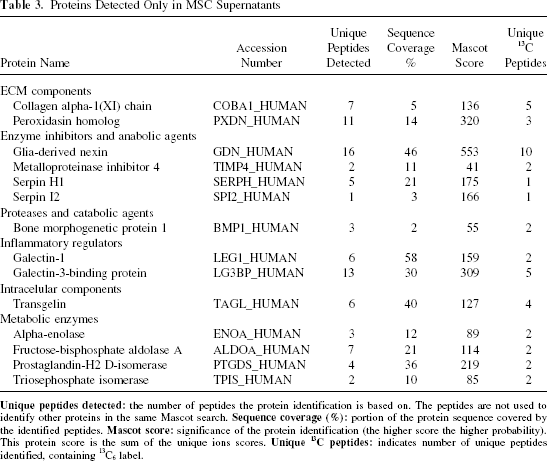
Both MSCs and ACs were cultured in serum-free SILAC medium for 10 days in order to achieve acceptable metabolic labeling of newly synthesized proteins. From all the proteins detected in the culture medium of ACs and MSCs, over 92% of proteins were labeled by 13C-lysine and 13C-arginine. Due to the interpatient variations we analyzed samples from different donors in order to achieve reproducible results. Most of the unlabeled proteins corresponded to contaminating plasma proteins most probably derived from the initial phase of cell expansion. Protein identification was carried out in Kyoto Encyclopedia of Genes and Genomes (KEGG) databases and the proteins were categorized into groups according to their functionality (Fig. 2). Qualitative comparison showed that similar numbers of matrix components (45% in ACs vs. 43% in MSCs) and matrix catabolic agents (10% in ACs vs. 9% in MSCs) were released into the media by cultured cells. However, MSCs expressed a higher number of matrix anabolic agents (12% vs. 7%). Overall, the majority of identified proteins were found in the spent medium of both cell types (Table 1). However a few proteins such as clusterin, mimecan, proteoglycan 4, tenascin and sushi, von Willebrand factor type A, EGF and pentraxin domain containing 1 (SVEP1) were identified only in secretion media of ACs (Table 2), while other molecules like serpins, bone morphogenic protein-1, and galectins were identified only in secretion media of MSCs (Table 3).
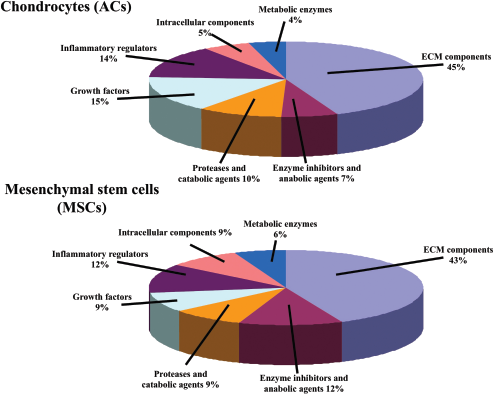
Protein distribution of ACs and MSCs cell secretome. Primary mass spectrometry (MS) values were contrasted in universal Kyoto Encyclopedia of Genes and Genomes (KEGG) databases for protein identification. The spectra of proteins identified in supernatants of ACs and MSCs were then distributed into seven main clusters according to their specific functions. The percentage of each protein category from the total number of proteins identified is reported.
Proteins Detected in Both AC and MSC Supernatants

Proteins Detected Only in AC Supernatants

Proteins Detected Only in MSC Supernatants
Validation of MS Analysis by Western Blotting
Validation of the MS analyses was done by specific immunodetection of eight relevant proteins (Fig. 3) that were either equally or differently expressed, including matrix regulators and growth factors that we consider of high relevance in the context of cartilage matrix regulation. Western blot analyses confirmed the data recorded by MS. Secreted protein acidic and rich in cysteine (SPARC) and growth-arrest specific protein 6, two of the proteins found in supernatants of both ACs and MSCs showed similar band intensities in the blots (Fig. 3). On the other hand, chitinase-3-like protein 2, osteomodulin, and stromelysin were highly expressed in AC and weakly expressed or not found in MSC supernatants. Additionally, antibodies against bone morphogenic protein 1, galectin 1, and serpin I2 had more intense bands in MSCs than in ACs as seen in the MS analyses. The size of the bands (kDa) obtained in Western blots of all tested proteins corresponded approximately to the expected size of the full-length proteins.

Validation of protein expression by Western blotting. The expression levels of eight relevant proteins identified by MS were confirmed by immunoblotting. Equal amounts of protein were loaded in gels. As observed by proteomic analyses, the levels of secreted protein acidic and rich in cysteine (SPARC) and growth-arrest specific protein 6 (GAS6) were similar in ACs and MSCs supernatants. Chitinase-3-like protein 2 (CHI3L2), osteomodulin (OMD), and stromelysin (MMP-3) were upregulated in ACs, and bone morphogenic protein 1 (BMP-1), galectin 1, and serpin I2 were upregulated in MSCs. Molecular weight markers are shown at the left side of each gel. Bands appearing approximately at the predicted molecular weight of each individual protein are shown.
Measurement of Proteases and Protease Inhibitors in Supernatants of ACs and MSCs
Quantitative measurement of MMPs and TIMPs in supernatants of ACs and MSCs was performed. In order to achieve reproducibility of the results, supernatants of ACs from five different donors and of MSCs from another five donors were analyzed. Results revealed that both MMP-2 and MMP-3 were abundantly expressed by both cell types, whereas MMP-9 and MMP-13, the last one being the main catabolic enzyme for collagen type II, were nearly undetectable in our system for either cell source (Table 4). Significant higher concentrations of MMP-1 (p < 0.05), MMP2 (p < 0.05), MMP3 (p < 0.001), and MMP7 (p < 0.05) were detected in supernatants of ACs. Regarding protease inhibitors, TIMP-1 and -2 were at markedly higher levels than TIMP-3 and -4 by both cell types. Quantitative measurements revealed approximately equivalent expression of all four TIMPs in ACs versus MSCs (Table 4).
Mean Concentrations of MMPs and TIMPs Identified in Cultured Medium of ACs and MSCs

Concentrations are in ng/ml. —: below the measurable range.
Values are extrapolated from the standard curves.
Discussion
The issue on which cell type is the best to attempt biological repair of cartilage is still a matter of active debate among scholars in the field. In our study we have made an attempt to compare the phenotype of the two cell types at the gene and protein level after standard ex vivo cell propagation. Both dedifferentiated ACs and undifferentiated MSCs display a phenotype that differs considerably from native cartilage cells. Additionally, both cell types show great similarities after looking at the overall spectrum of released proteins. However, our results uncover intriguing differences between the two cells types that could be of importance in the context of cell transplantation strategies.
The secretome of ACs in either monolayer cultures or in tissue explants have been studied earlier by our group and others (7,11,31). Similar to those previous studies, in this study the SILAC analyses revealed that dedifferentiated chondrocytes express numerous matrix components and matrix regulatory agents (over 70% of total proteins identified); however, traditional markers of mature differentiated cartilage such as collagen type II and aggrecan could not be found in the supernatants, indicating a transformation of the cells towards fibroblastic phenotypes. Additionally, among the matrix regulatory agents, we have identified nine different types of proteases and five different types of protease inhibitors, showing the dominance of catabolic substances over anabolic ones in the secretion media of cultured chondrocytes.
Studies of the secretory protein profiles of undifferentiated MSCs are scarce. Most efforts have been used to study the pattern of released proteins by MSCs at late stages of adipogenic, osteogenic, or chondrogenic differentiation (1,13,41). A study by Chiellini and coworkers showed the secretome of human mesenchymal stem cells at early stages of adipogenic and osteogenic differentiation where the spectrum of proteins found in the cell culture medium of undifferentiated MSCs (day 0 of differentiation) by MS was rather similar to the proteins identified by our approach using SILAC (5). A comparable pattern of matrix components were identified, and a similar profile of matrix regulators including SPARC, MMP-1, MMP-2, TIMP-1, and serpins were found in our study. We could not detect in the conditioned medium of MSCs morphogenic markers characteristic of the adipocyte, osteoblast, or chondrocyte differentiated forms, which confirm the undifferentiated status of the cells.
In our study, each cell kind differentially expressed some proteins, and eight candidate molecules were selected for validation studies by immunonoblots. Chondroitin sulfate proteoglycan 4, clusterin, tenascin, chitinase-like proteins, MMP-3, MMP-7, and osteomodulin were identified only in secretion medium of ACs. The presence of clusterin, tenascin, and chitinase-like proteins in the secretome of ex vivo cultured ACs might indicate dedifferentiation and cell distress, which might be similar to OA conditions in vivo. On the other hand, a group of factors including serpins, BMP1, and galectins were identified only in media of MSCs. BMP-1 is an extracellular matrix (ECM) regulator that plays an important role in inducing cartilage and bone development. It is not a growth factor belonging to the TGF-β family of proteins like the other BMPs, but acts as a metalloprotease cleaving the C-terminus part of procollagens I, II, and III, thus transforming them into functional ECM components (16). Serpins are powerful inhibitors of proteases and have an important role in regulating ECM homeostasis (6,28). Galectin 1 is a member of a family of β-galactoside binding proteins. It has been shown to upregulate expression of MMP13 gene, and downregulate the expression of type-II collagen and aggrecan (21).
By multiplex protein kit assays, significantly higher expression of MMPs was found in supernatants of chondrocytes with respect to MSCs, whereas the two cell types secreted TIMPs at similar amounts. In MS analyses MMP-3 and MMP-7 could only be identified in the media of chondrocytes, and the quantification with the luminex showed also much higher expression levels of these two proteases in ACs supernatants. On the other hand, TIMP-4 was found by luminex analyses in both ACs and MSCs, while in proteomic analysis TIMP-4 was identified only in MSCs. This could be explained by the generation of inaccurate results by MS due to the identification of peptides sharing very close amino acid sequences but corresponding to different proteins from the same family. Thus, TIMP-4 in supernatants of ACs could have been identified as another TIMP class in the universal database. All together, these results also put in evidence the more catabolic nature of chondrocytes after in vitro growth.
In general, most studies in both clinical and preclinical set-ups comparing ACs and MSCs have been of a largely empirical nature, based on trial and error (25). Few efforts have been used so far in comparing the two cell types at a more fundamental level, and little attention has been paid to explore the consequences of in vitro cell expansion on cell function and cell dedifferentiation. Regarding the use of marrow-derived stem cells for articular cartilage resurfacing, most attempts in both animals and humans have been performed using uncultivated cells, readily available from subchondral bone bleeding or after density gradient enrichment of bone marrow samples. In this context, previous studies have shown in animal models that autogenic MSCs-enriched bone marrow gives superior quality tissue than even allogenic embryonic MSCs (27). On the contrary, other studies have shown that harvested cells from repaired cartilage after microfracture show phenotypes halfway between cartilage and bone (34). The available literature is fed with contradictory observations in this regard, and similar ambiguous outcomes are observed with chondrocytes. Advantages and disadvantages can objectively be found in the use of either cell type for cartilage repair (Table 5). Our results support the conception that dedifferentiated chondrocytes hold a phenotype closer to cartilage cells at the gene expression level than MSCs; however, expanded chondrocytes also show a more catalytic nature than MSCs a fact that could negatively influence the production of new tissue after transplantation.
In summary, we have analyzed the secretome of ACs and MSCs after some weeks of cell expansion using last generation proteomic approaches. Our data indicate that the phenotype of the two cell types differs considerably from cartilage tissue cells, and shows a big overlapping spectrum of released proteins. However, MSCs present a more anabolic phenotype than ACs, which could favor their use in autologous cell implantation strategies. Although relevant, our results would not be sufficient to predict the final outcomes regarding the extent of cell differentiation or the quality of the replaced tissue after implantation. Moreover, the biological relevance of the differentially expressed proteins revealed in this study remains an area of investigation.
Overview of Advantages and Disadvantages for the Use of ACs and MSCs for Cartilage Repair

Footnotes
Acknowledgments
The authors are thankful to the excellent technical assistance of Toril Anne Grønset in running the samples for the MS analyses, Kirsti Rønne in running the Western blots, and Vivian Berg in running the Luminex.