
Abstract
Recent evidence suggests that adult neurogenesis contributes to the pathophysiology of different psychiatric disorders, including depressive disorder, anxiety disorder, and schizophrenia. Seasonal affective disorder (SAD) is a specific form of recurrent depressive disorder that can be induced by shortened light period. It is unclear yet whether neurogenesis is affected in SAD or under altered light/dark cycle. The present study aims at examining whether neurogenesis and dendritic growth of immature neurons are affected in Mongolian gerbils, a mainly diurnal rodent, under light deprivation. Animals were divided into two groups: the control (kept in 12 h light:12 h dark) and the light-deprived groups (kept in 24 h dark). Depression-like behaviors and neurogenesis were assessed after 2 weeks. Compared with the control group, light-deprived gerbils showed increased immobile time in the tail suspension test and forced swimming test, which indicates induction of depression-like behavior. Cell proliferation in both the hippocampal and subventricular zone were significantly decreased in the light-deprived group, which also showed a decreased neuronal differentiation. Dendritic maturation of immature neurons was suppressed by light deprivation, which is revealed by doublecortin staining and Sholl analysis. The results revealed that the light/dark cycle exerts impacts on neurogenesis and maturation of new neurons. Additionally, the current experiment may offer a model for exploring the relationship among daylight exposure, circadian cycles, depressive behavior, and the underlying mechanisms.
Keywords
Introduction
Seasonal affective disorder (SAD) is a recurrent mood disorder that occurs during fall or winter, and full remission is found during the spring or summer time (39). The prevalence of the disorder ranges from 1.4% to 9.7% (46). Classical symptoms of the disorder include hypersomnia, overeating, and carbohydrate craving (47). Sometimes it is defined to be a seasonal pattern of major depression disorder (39). Recently, research groups have used a diurnal rodent (fat sand rat, Psammomys obesus) as an animal model of SAD. This provides the opportunity to study the basic mechanisms and potential treatment of SAD (3,16).
The pathophysiology of SAD is still obscure. The contradictory results regarding the pathology of SAD may attribute to the biologically heterogeneous nature of the disease (30). Because SAD shares common signs and symptoms with major depression, it is possible that a common pathophysiology could be found between the two disorders. During the past few years, increasing attention have been drawn to the “neurogenesis hypothesis of depression” (14), which attempts to explain the etiology of major depression from this special form of neuroplasticity. Adult neurogenesis, the continuous production of new neurons in adulthood, is a multistage process consisting of cell proliferation, differentiation, and maturation (15,56). The new neurons could be found in different brain regions, such as hippocampus (15), subventricular zone (SVZ), amygdala, hypothalamus (19), or in the cortex after induction of ischemic stroke (50). Neurogenesis is involved in different biological processes like learning and memory (11,27), odorant exploration and differentiation (40), mating preference (37), and there is evidence showing its roles in major depression. The relationship between neurogenesis and major depression is supported by two observations: firstly, stress, a risk factor of depression, decreases neurogenesis; secondly, various antidepressant treatments increase neurogenesis (24,38,44). When neurogenesis was ablated, the therapeutic effects of antidepressants were abolished (1,48). Such evidence suggests that targeting neurogenesis may provide promising result in searching effective antidepressants in the future.
Because major depression shares common signs and symptoms with SAD, it is worth investigating whether neurogenesis is disturbed in an SAD animal model. Previous reports showed that diurnal fat sand rat (Psammomys obesus) was a suitable animal model for the study of the SAD (2,16). When the fat sand rats were subjected to a short daylight cycle (5 h light/19 h dark), depression-like behavior was induced and light therapy was effective to decrease the signs of depression (2). In the current study we used a commonly used diurnal laboratory animal, Mongolian gerbil, to investigate the effect of light deprivation on neurogenesis. The aims of the study are (i) to test whether light deprivation induces depression-like behavior in the gerbils and (ii) to test whether neurogenesis is affected by light deprivation. We hypothesize that light deprivation induces depression-like behaviors and suppresses growth and maturation of newborn neurons. If neurogenesis is distorted in this animal model, it should shed light on current understanding of the pathogenesis of SAD and how light/dark cycle affects neural plasticity in the brain.
Materials and Methods
Animals and Light Deprivation
Adult male Mongolian gerbils (Meriones unguiculatus, 120 ± 20 g, 3–4 months old) were obtained from the Laboratory Animal Unit, the University of Hong Kong. Laboratory rat chows and water were available ad libitum. Animals were treated according to the guidelines for the use of experimental animals provided by the Committee on the Use of Live Animals in Teaching and Research, The University of Hong Kong.
For light deprivation, animals were kept in a ventilated, light-tight chamber (i.e., 0 h light/24 h dark; n = 9) for 2 weeks. To label newborn cells in the brain, all animals received six injections of bromodeoxyuridine (50 mg/kg, Sigma-Aldrich, IP injection) in 12-h intervals at day 12 to 14. Control animals (n = 9) were kept in 12-h light/12-h dark lighting conditions.
At day 15, the animals were subjected to the tail suspension test and forced swimming test to determine depression-like behavior (52). After behavioral tests, animals were killed by transcardial perfusion at day 16. After anesthesia with sodium pentobarbital (150 mg/kg), the animals were first perfused with 0.9% NaCl for 4 min to remove the blood, then followed by perfusion of 4% paraformaldehyde in 0.1 M phosphate buffer for 10 min. Brains were then dissected, stored in 30% sucrose overnight at 4°C for cryoprotection, sectioned with a freezing microtome, and stored at 4°C until use.
Coronal sections (40 μm, 1 in 12) of the brain were used for the following assays: a) cell proliferation assay; b) phenotyping of new cells; c) dendritic maturation assay, and d) Sholl analysis of immature neurons (32,35). Sections contained the hippocampus (1.0 mm posterior to bregma to 2.1 mm posterior to bregma) and SVZ (0.7 mm anterior to bregma to 0.4 mm posterior to bregma) (34) were used for analysis.
Tail Suspension Test
Depression-like behavior of gerbils was assayed using the tail suspension test, which is widely used for testing “behavioral despair of mouse” (52). The tail suspension test in gerbils was previously verified by Varty et al. (53). In brief, the animal, held by the tail, was suspended 50 cm from the floor and the behavior of the animal was recorded by a video camera for 6 min. Then the time of immobility (indicator of depression-like behavior) was assessed by a blinded experimenter. The test was carried out at 1400–1600 h.
Forced Swimming Test
The forced swimming test (FST) (16,36), which is commonly used to assess antidepressant activity of pharmacological agents, was used as another test for depression-like behavior (or termed learned helplessness). A separated group of gerbils (n = 7 for each group) was used for the forced swimming test. At 1400–1600 h, gerbils were placed individually for 15 min in cylinders (30 × 50 cm) that were filled with water 23–25°C, to a 30-cm depth. At this depth the gerbils could not reach the bottom of the cylinder with the feet or tail. Behaviors of the gerbils (swimming and immobility) were recorded in complete darkness by an infrared video camera placed above the cylinder for subsequent analysis. After the test the gerbils were removed from the cylinder, dried with a towel, and returned to the home cage. A timed behavior sampling technique (13) was employed. The sampling procedure measured the frequency of behaviors over 5-s intervals during the test session. The behaviors selected for measurement in the modified FST were immobility (passive floating with no active movement or with only minimal activity to keep the head above water) and swimming (horizontal motion moving from one quadrant of the water tank to another). The predominating behavior (either swimming or immobility) in each 5-s period of the 300-s test was recorded. The rater of the behavioral patterns was blinded to the experimental conditions being scored.
Cell Proliferation Assay
Frozen slices were affixed onto gelatin-coated slides and air dried overnight. Then the sections were subjected to antigen retrieval in citric acid (pH 6.0) for 10 min, followed by 0.01 M phosphate-buffered saline (PBS) rinses. The brain sections were incubated in 1 M HCl (37°C, 30 min) and then boric acid buffer (pH 8.5, 10 min). After washing in three changes of 0.01 M PBS, the sections were incubated for 30 min with hydrogen peroxide (H2O2) to eliminate endogenous peroxidase. After blocking with 10% normal goat serum, the sections were incubated with mouse anti-BrdU antibody (1:1000, Roche Molecular Diagnostics, Pleasanton, CA) overnight at room temperature. Sections were then washed and incubated for 2 h with biotinylated goat anti-mouse antibody (1:200, Vector Laboratories, Inc., Burlingame, CA). It was followed by signal amplification with avidin-biotin complex (Vector Laboratories). BrdU immunoreactivity was visualized with diaminobenzidine. Cell counting was performed with a semiautomatic stereology system with stereo investigator (MicroBrightField Inc., Williston, VT). Data were presented as mean ± SEM.
Phenotyping of New Cells
Brain sections were coimmunostained with doublecortin (DCX) (8), an immature neuronal marker, to determine whether neuronal differentiation was affected by the treatment. The brain sections with the hippocampus were coimmunostained with rat anti-BrdU (Roche) and rabbit anti-DCX (1:400, Cell Signaling Technology, Danvers, MA), which were visualized with fluorescence secondary antibodies (1:200, Alexa Fluor 488 goat anti-rat and Alexa Fluor 568 goat anti-rabbit antibodies; Molecular Probes) under epifluoresecent microscope. The coexpression of BrdU and DCX indicated newborn neurons expressing neuronal phenotype. At least 25 BrdU-positive cells were counted for each animal (n = 7 for each group), and the results are expressed in proportion of BrdU-positive cells expressing DCX.
Quantification of DCX-Positive Cells
The brain sections immunostained with rabbit anti-doublecortin antibody (Cell Signaling Technology) and peroxidase staining were used. The DCX-labeled cells, located in the dentate gyrus, either with or without tertiary dendrites, were quantified with StereoInvestigator (Version 8.11, MicroBrightField) (22). The data were presented as mean ± SEM.
Sholl Analysis of Dendritic Complexity
Dendritic complexity was investigated according to previous reports (32,35,54). The hippocampal DCX-positive cells with tertiary and relatively untrauncated dendrites were selected randomly for the Sholl analysis (n = 7 gerbils for each group, and 10Undash;15 cells per brain were chosen for analysis). The cells were traced with Neurolucida software (MicroBrightField) under 400× magnification. The tracings were then imported into NeuroExplorer software (MicroBrightField) for the Sholl analysis: concentric circles, with increasing radii of 10 μm, centered on a cell body were drawn. The number of intersections between dendrites and the circles and total dendritic length between two adjacent concentric circles were quantified. The dendritic complexity was expressed in terms of dendritic length and number of intersections. The analysis was carried out by an experimenter blinded to the treatment condition of the animals.
Statistics
Comparison between the control and light-deprived animals was carried out with Student's t-test. A significant difference was defined with a value of p < 0.05. Values were expressed as mean ± SEM.
Results
Light Deprivation Induced Depression-Like Behavior in Gerbils
The tail suspension test (TST) result of the light-deprived and control animal is shown in Figure 1A. A significant difference in the duration of immobility was found between the control group (232.6 ± 5.57 s) and light-deprived group (254.7 ± 4.29 s; p = 0.004). The induction of depression-like behavior was also shown in the forced swimming test (FST). The light-deprived animals showed a significantly increased immobile duration compared with the control animals (control: 16.75 ± 16.75; dark: 38.875 ± 3.12; p = 0.00019) (Fig. 1B). A longer duration of immobility in the light-deprived animals indicated the induction of depression-like behavior following light deprivation.

Light deprivation induced depression-like behavior. (A) Duration of immobility during the tail suspension test. The light-deprived group (Dark) shows a significantly longer duration of immobility than the control (Light) group. (B) Duration of immobility during the forced swimming test. The light-deprived group shows a significantly higher immobility count compared with the control group. Values are expressed in mean ± SEM. **p < 0.01.
Light Deprivation Suppressed Both Hippocampal and SVZ Cell Proliferation and Inhibited Neuronal Differentiation of Newborn Cells in the Dentate Gyrus
To examine whether light deprivation suppresses neurogenesis in the dentate gyrus and cell proliferation in the SVZ, gerbils were divided into the control group (Light/Dark group) and light deprivation groups (Dark group). BrdU was injected at day 12–14 in 12-h intervals before behavioral testing at day 15 and killing at day 16.
In the dentate gyrus, BrdU-immunoreactive cells were located in the subgranular zone, with a suppressed level of cell proliferation in the light-deprived group (Fig. 2A, B, indicated by arrows). Quantification by unbiased stereology showed that the number of proliferative cells in the light-deprived group was significantly lower than the control group (Fig. 2C, Control: 2567.18 ± 440.538; Dark: 1253.66 ± 296.56; p = 0.029). In the SVZ, there was a light deprivation-suppressed cell proliferation (Fig. 2D, E). Stereological quantification showed a significantly lower number of BrdU-positive cells in the light-deprived group than the control group (Fig. 2F, p = 0.034). Thus, light deprivation was shown to suppress cell proliferation in the two neurogenic regions in the CNS.
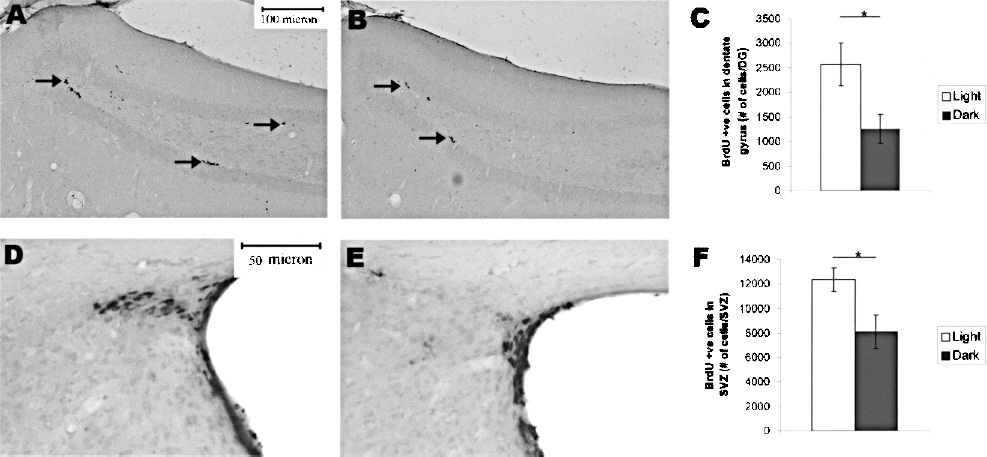
Light deprivation suppressed neurogenesis in the dentate gyrus and cell proliferation in the subventricular zone (SVZ). (A, B) Microphotograph showing BrdU-immunoreactive cells in the dentate gyrus of the control animal (A, indicated by arrows) and light-deprived animal (B). (C) BrdU-immunoreactive cell number in dentate gyrus of the light-deprived gerbils (Dark) is significantly lower than the control group (Light). (D, E) Microphotograph showing BrdU-immunoreactive cells in the subventricular zone of the control animal (D) and light-deprived animal (E). (F) Significantly less BrdU-positive cells could be found in the SVZ in the light-deprived gerbils. *p < 0.05. Values are expressed as mean ± SEM.
To examine whether light deprivation affects the neuronal differentiation of new neurons in the hippocampus, brain sections were processed for double immunofluorescence of BrdU and doublecortin (DCX, an immature neuronal marker). A cell expressing both BrdU and DCX is illustrated in Figure 3A. The proportion of new cells (BrdU+) expressing DCX was 0.54 ± 0.04 in the control group while that of light-deprived group was 0.41 ± 0.04. A significant difference was found between the two groups (Fig. 3B, p = 0.048). In short, neurogenesis in the dentate gyrus was suppressed by light deprivation.
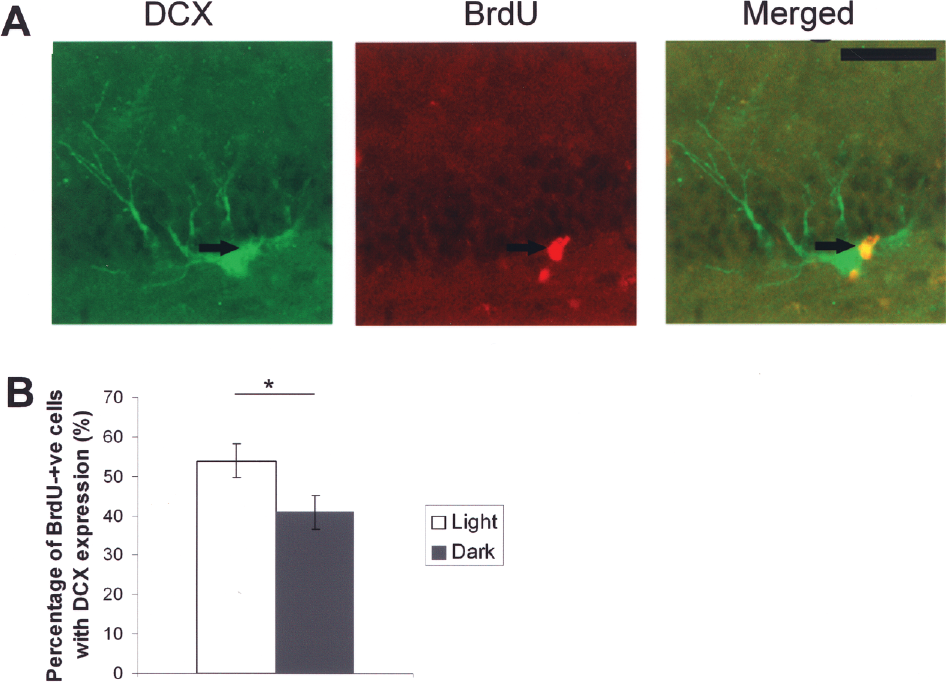
Phenotyping of BrdU-positive cells with DCX immunochemistry. (A) Arrow indicates a BrdU-labeled new cell expressing DCX. (B) The dark-adapted animals show a significantly lower number of BrdU-positive cells expressing DCX. *p < 0.05. Values are expressed as mean ± SEM. Scale bar: 10 μm.
Light Deprivation Decreased the Number of DCX-Immunoreactive Cells in the Dentate Gyrus
DCX immunostaining (Fig. 4A, B) was used for: 1) further confirming whether the number of newborn neurons is affected by light deprivation and 2) examining the effect of light deprivation on the dendritic complexity of new neurons. The quantification of DCX-positive cells in the dentate gyrus showed that the light-deprived group exhibited fewer DCX-positive cells than the control group (Fig. 4C, p = 0.048). Further investigation of the DCX-positive cells with tertiary dendrites (Fig. 4A, inset) showed that light deprivation also decreased the number significantly more than the control group (Fig. 4D, p = 0.005). The results indicate the suppressing effect of light deprivation on neurogenesis and dendritic growth of immature neurons.

Light deprivation decreased the number of DCX-immunoreactive cells in the dentate gyrus. (A, B) Representative photomicrographs showing DCX-positive cells in the dentate gyrus of the control animal (A) and light-deprived animal (B). Light-deprived animals showed a significantly lower number of DCX-positive cells than the control animals (C). (D) Quantification of DCX-expressing cells with tertiary dendrites showed a significant difference between the control group (Light) and light-deprived group (Dark). *p < 0.05; **p < 0.01.
Light Deprivation Suppressed Dendritic Maturation of Newborn Neurons in the Dentate Gyrus Shown by the Sholl Analysis
To examine the effect of light deprivation on the dendritic complexity, the Sholl analysis was performed with Neurolucida software. Ten DCX-positive cells with tertiary dendrites were selected from each animal for analysis. Tracings of representative DCX-stained cells were depicted in Figure 5A–D (A & B: a cell from control group; C & D: a cell and its tracing from Dark group). It was found that the DCX-positive cells in the light-deprived animals had significantly decreased dendritic length (Fig. 5F, p < 0.05). The number of intersections of light-deprived group was also significantly lower than the control group (Fig. 5G, p < 0.05). The dendritic complexity of DCX-positive cells in the light-deprived animals was decreased.

Light deprivation suppressed the dendritic complexity of DCX-immunoreactive cells in the dentate gyrus. (A) Representative microphotograph of a DCX-expressing cell in the dentate gyrus of the control group gerbil. Its traced outline for the Sholl analysis is shown in (B). (C) Representative photo of a DCX-positive cell in the dentate gyrus of the light-deprived gerbil and (D) its traced outline. (E) Graphical representation of the Sholl analysis of the branching pattern of dendrites. Concentric circles with increasing radii of 10.0 μm were drawn on reconstructed DCX-positive cells. (F) Light deprivation decreased the dendritic length of the DCX-positive cells. (G) Light deprivation also decreased the number of intersections of the DCX cells in the Sholl analysis. *p < 0.05, values expressed as mean ± SEM.
Discussion
Light Deprivation Induced Depression-Like Behavior and Suppressed Neurogenesis
The results described above showed that altered light/dark period exerts impact on neurogenesis: light deprivation in this animal model led to depression-like behavior, suppression of neurogenesis, and inhibition of dendritic maturation of newborn neurons in the hippocampus. Thus, apart from the fat sand rat, the current experimental paradigm and choice of Mongolian gerbil may serve as an animal model for SAD study.
Mongolian Gerbil as a Model for Study of SAD
Understanding the pathophysiology of SAD relies on the availability of appropriate animal models that mimic the disease. Recently, research groups of Ashkenazy and Einat used the fat sand rat (Psammommys obesus) to study SAD because the species is diurnal and depression-like behavior was induced by a shortened light cycle (3,16,18). Furthermore, treatments that are effective to reduce SAD symptoms were found to reduce depression-like behavior in the fat sand rats (2), which confirms the validity of the animal model as a simulation of SAD. In the present study, we adopted the Mongolian gerbil for the experiment and found that depression-like behavior was induced by light deprivation. This may serve as an alternative animal model for studying SAD. To further confirm whether the present experiment is suitable for being a SAD model, the face validity (e.g., effect of different treatment for SAD on depression-like behavior of the gerbil), predictive validity (e.g., effect of exposure to light should be tested on the current animal model), and construct validity should be tested (2). To further confirm that the increased immobility is not caused by suppressed locomotor activity, additional control groups should be included in future studies. For instance, being kept under 12-h light/12-h dark lighting conditions, one of the control groups should have decreased locomotor activity (e.g., with D1 agonist SKF 38393 treatment) (6) while another group should have increased physical activity. The forced swimming test and tail suspension test results would indicate whether or not the immobility time is affected by altered locomotor activity. Additionally, tests for locomotor activity such as open field test should be conducted in future studies, too.
Hypotheses for Physiopathology of SAD
The mechanisms of SAD are still obscure. One of the hypotheses states that abnormal or disturbed circadian cycle is the underlying cause of the disorder (4,9,51). According to Avery et al. (4) and Dahl et al. (9), the circadian temperature and cortisol rhythm was phase delayed 2–2.5 h while melatonin was phase delayed 1.5 h in people suffering from SAD. Cortisol was speculated to play an important role in depressive disorders as over 50% of major depression patients showed an elevated cortisol level (43) and injection of corticosterone was known to induce depression-like behavior in rodents (25). The dysregulation of daily secretion rhythm of cortisol may imply maintenance of cortisol at a high level without fluctuation, which may contribute to the symptoms of depressive disorder. Melatonin, a hormone produced in the dark phase and inducing sleepiness, was suggested to be the key player of the SAD pathology. However, evidence until now could not delineate the exact roles of melatonin in depressive disorder as the evidence has been contradictory. For instance, it was found that SAD patients showed an elevated serum level of melatonin during the light phase (10), but exogenous application of melatonin or agomelatine (a melatonin receptors agonist) could reduce the depression symptoms in rodents and patients (12,42). Furthermore, although there are reports on the altered circadian rhythm of melatonin levels in SAD patients (9,55), there are studies that failed to show the altered melatonin secretion pattern (7). Thus, how melatonin affects the pathophysiology of SAD remains a matter to be determined.
Another possibility is attributed to the insufficient serotonin level and dysregulation of serotonergic system (49). This hypothesis is partly due to the monoamine hypothesis of major depression, and it is supported by the finding that hyperactive serotonin transporter, which removes serotonin from the synaptic cleft, was found in SAD patients (57). It is shown that serotonin turnover rate is lower in the winter, and the rate of production of serotonin is positively associated with the intensity of sunlight exposure and illumination luminosity (31). Furthermore, intravenous infusion of serotonin agonist meta-chlorophenylpiperazine reduced carbohydrate craving and induce activation-euphoria in the SAD patients (28). In addition, tryptophan (precursor of serotonin) depletion induced relapse of depressive state in the remitted SAD patients (41). All of these suggest that serotonin dysfunction may play an important role in SAD.
Relationship Between Neurogenesis and Circadian Cycle
The present study suggests a new aspect that may be involved in SAD pathology: alteration of neurogenesis by light/dark cycle. Relatively few, if not a total lack of, reports showed the relationship between adult neurogenesis and circadian rhythm. In lobsters, the level of neurogenesis of olfactory-projecting neurons was found highest at dusk, which is the most active period of lobsters (23). Voluntary running, which is a robust promoter of neurogenesis in rodents, was shown to increase hippocampal neurogenesis in mice when the animals were allowed wheel access at their most active period (i.e., middle of the dark phase) but not at inactive phases (26). Such findings showed that neurogenesis peaks at the time period when the animals are most active, and neurogenesis may serve specific roles during the active period. The result from the present study agrees with these findings because the gerbils, which are active during the light phase, showed a decreased neurogenesis when they were kept in constant darkness. Apart from cell proliferation, the maturation of dendrites of immature neurons was also hampered by the dark adaptation. The biological significance of neurogenesis in circadian rhythm is still unclear, but the alteration of neurogenesis may affect functions like reproduction (20), memory formation (33), and contribute to pathology of psychiatric disorders (54). On the contrary, a study showed that difference in neurogenesis at different light/dark period could only be found in the hilus but not dentate gyrus in mice. This suggested that gliogenesis, rather than neurogenesis, is influenced by the circadian rhythm (29). To clarify the relationship between circadian cycle and neurogenesis, further studies are required.
Recent studies started to shed light on how the light/dark cycle affects neurogenesis at the molecular level. A recent report showed the suppressive role of Period 2 (per2) gene on neurogenesis (5). per2 is expressed in the suprachiasmatic nucleus (SCN) under a rhythmic control, which shows a circadian pattern (39). Its expression is highest at the first part of the day and is suppressed thereafter (21). Being different from the suprachiasmatic nucleus, the hippocampal neural progenitor cells constitutively express per2 (5). In per2 knockout mice, both the rate of cell proliferation and differentiation were higher than the wild-type controls, which reveals the suppressive role of per2 on neurogenesis. On the other hand, neuroendocrine signals may be the mediators of neurogenesis as well. The SCN projects output to various structures, including the paraventricular nucleus (PVN) and pineal gland. The PVN plays major regulator roles on corticosteroid secretion, which was known for its suppression on hippocampal neurogenesis (44). The pineal gland is the production site of melatonin. Melatonin, a biochemical transducer of photoperiodic information to various cell types in the body (39), was found to promote the survival of mice neural progenitor cells and immature neurons and thus increase the net amount of new neurons (45). Taken together, the light/dark cycle may influence neurogenesis via the expression of circadian genes and neuroendocrine signals. Because the results of the above studies were gained mainly from the mice or rats, which are nocturnal animals, translation of the findings to humans may be hindered. Thus, studies with the appropriate diurnal animal models may be in demand.
The present study provides new information on brain plasticity affected by the light/dark cycle. Through a mechanism not fully understood yet, the neurogenesis rate and maturation of new neurons were suppressed by light deprivation. The disrupted neurogenesis may be the downstream consequence of the disturbed circadian cycle, hormonal homeostasis, and serotonin level, which requires further confirmation. Nevertheless, the results of this study demonstrated that the organic disturbance could be quantitatively analyzed in a potential SAD animal model, which is an alternative model from the use of fat sand rat (3,16). To further understand the role of neurogenesis in SAD, future exploration of the potential causal relationship should be pursued, as the importance of modified neurogenesis in depressive disorders is still controversial (17).
Footnotes
Acknowledgments
This work was supported by National Science foundation of China grants (663031 to M.P.); Ministry of Science and Technology of China grants (2007AA02Z146 & 2009CB320900 to M.P.); NSFC/RGC Joint Research Scheme under the contract N_HKU750/08 (K.F.S.); the Fundamental Research Funds for the Central Universities (21609101, K.F.S.); and National Basic Research Program of China (973 Program) (2011CB707501, K.F.S.).