
Abstract
During mouse embryogenesis, hematopoietic development takes place in several distinct anatomic locations. The microenvironment of different hematopoietic organs plays an important role in the proliferation and maturation of the hematopoietic cells. We hypothesized that fetal stromal cells would be distinct to adult bone marrow (BM)-derived stromal cells because the BM contributes mainly to the homeostasis of hematopoietic stem cells (HSCs), while extensive expansion of HSCs occurs during fetal development. Here we report the establishment of stromal cell lines from fetal hematopoietic organs, namely aorta-gonad-mesonephros (AGM), midgestation placenta (PL), and fetal liver (FL) together with adult bone marrow (BM). The growth patterns and hematopoietic supportive potential were studied. Their phenotypic and molecular gene expression profiles were also determined. Stromal cell lines from each tissue were able to support cobblestone area formation of BM c-Kit+Sca-1+ hematopoietic cells: 22 (22/47) from AGM, three (3/4) from PL, three (3/4) from FL, and three (3/3) from BM. There were similar levels of expansion of total mononuclear cells (TMNs) when HSCs were cocultured with fetal stroma and adult BM stroma. However, PL-derived stromal cells supported higher levels of generation of colony-forming progenitor cell (CFU-C), indicated by more colonies and colonies with significantly larger size. Flow cytometric analysis of the PL1 cells demonstrated a phenotype of CD45-, CD105+, Sca-1+, CD34+, and CD49d+, compared to adult BM1 cells, which were CD45-, CD105+, Sca-1+, CD34-, and CD49d-. Using Affymetrix microarray analysis, we identified that genes specifically express in endothelial cells, such as Tie1, Tek, Kdr, Flt4, Emcn, Pecam1, Icam2, Cdh5, Esam1, Prom1, Cd34, and Sele were highly expressed in stroma PL1, consistent with an endothelial phenotype, while BM1 expressed a mesenchymal stromal phenotype. In summary, these data demonstrate distinct characteristics of stromal cells that provide insights into the microenvironmental control of HSCs.
Introduction
During mouse embryogenesis, hematopoietic development is a complex process, which takes place in several distinct anatomic locations (56). The initial hematopoietic activity occurs in the yolk sac at E7.5 (37). Adult-type, definitive hematopoiesis can be detected first at E10.5 in the intraembryonic aorta-gonado-mesonephros (AGM) region (33). Thereafter, hematopoietic cells colonize the fetal liver where they undergo expansion and maturation (25), before finally moving to the bone marrow. Recent studies have independently reported that clonogenic hematopoietic progenitors and multipotent hematopoietic stem cells (HSCs) can also be detected in the placental region during midgestation, identifying a novel fetal hematopoietic site (1,19,38).
It is now widely accepted that the microenvironment in different organs (the so-called “stem cell niche”) plays an important role in the development and maturation of the hematopoietic cells during embryogenesis (56). This niche is believed to be composed of stromal cells and various extracellular matrices. Stromal cells, being the principal component of the microenvironment, interact and regulate the generation, proliferation, and maintenance of hematopoietic cells possibly by cell–cell contact and/or local paracrine molecules (22).
Adult bone marrow (BM) is thought to maintain and support hematopoiesis throughout normal life. Hence, a number of BM-derived stromal cell lines—MS-5 (44), S17 (12), and HESS-5 (49)—have been established and studies have demonstrated their ability to maintain primitive hematopoietic cells. But the adult BM microenvironment mostly maintains homeostasis as HSCs exist as slow-cycling cells in a quiescent state without undergoing significant expansion. The quiescent state is thought to be an essential mechanism to protect HSCs from stress and to sustain long-term hematopoiesis (2,54).
Midgestation fetal liver (FL) is believed to be the organ where the HSC compartment undergoes expansion through self-renewal in addition to differentiation (37). Cloned stromal cell lines from FL have been shown to promote proliferation and differentiation of hematopoietic cells in vitro (36,45,55). In particular, AFT024, a FL stromal cell line immortalized with a retroviral vector encoding a temperature-sensitive SV40 T antigen, has been studied extensively for its ability to support hematopoiesis (36,55).
Recent work by several groups has suggested that the stromal cells derived from the AGM region of E10.5 mouse embryos promoted the generation of both mouse and human progenitors from primitive hematopoietic cells without additional cytokines (57). Although, the AGM region was assumed to be the source of definitive hematopoiesis colonizing the FL (15), the number of HSCs in the AGM region remains low throughout embryonic development (19,34). This means that while the AGM region may provide a favorable microenvironment for the generation of definitive HSCs, it seems to have limited contribution for the expansion of HSCs.
Other studies have reported that clonogenic hematopoietic progenitors and multipotent HSCs can be detected in the placental region during midgestation, thus identifying a third prehepatic hematopoietic site (1,19,38). One study showed that the placental HSC pool expands until E12.5–E13.5 and contains >15-fold more HSCs than the AGM (19). Another study found that the earliest progenitors that yielded high proliferative potential colony-forming cells (HPP-CFCs) were two to four times more frequent in the placenta than in the yolk sac or FL. In the FL, late progenitors were more frequent (1). So far, only a few studies have documented the derivation of human placenta mesenchymal stroma and its hematopoietic supportive property (60).
The molecular milieu elaborated by different stromal cell lines has been previously studied, especially AFT024 (21). These studies revealed gene products of several categories, which differ between hematopoietic supportive and nonsupportive lines. No study, to date, has examined the gene expression of the placenta stromal cells.
Hence, in this study, we derived stromal cell lines from fetal hematopoietic organs: mouse midgestation placenta (E11.5–13.5) together with those from the AGM region of E10.5–11.5, FL of E13.5 to 14.5, and adult BM from a commonly used mouse strain B6D2F1. These specific embryonic days were chosen based on previous reports (35). We have compared the hematopoietic supportive potential of these stromal cell lines and their gene expression profiles.
Materials and Methods
Embryo Generation
To generate embryos, timed matings were set up using B6D2F1 mice (NCI Jackson Laboratory, Bar Harbor, ME). Embryonic development was estimated by considering the day of vaginal plug discovery as E0.5. Pregnant mice were sacrificed by cervical dislocation and the embryos were isolated from the uterus. The animal use protocols were approved by the University of Miami Institutional Animal Care and Use Committee.
Establishment of Murine Stromal Cell Lines and Culture Conditions
Murine stromal cell lines were established from the BM, the AGM region, midgestation placenta, and FL.
AGM stromal cell lines were derived from E10.5–11.5 embryos. The region surrounding the aorta, genital ridge, and mesonephros was dissected using a dissecting microscope and organ cultures were set up as previously described (57) with modifications. Briefly, the AGM tissues were cultured in 96-well plates (Evergreen Scientific, Los Angeles, CA) with 100 μl medium. Adherent cells started to appear around the tissues 2–3 days later, and the AGM tissues were removed 1 week later. The adherent cells were harvested from the wells using 0.05% trypsin-EDTA (GIBCO BRL, Grand Island, NY) and were transferred to 24-well plates, 6-well plates, etc., for culture expansion. The medium was replaced twice weekly.
The E11.5–E13.5 placenta (PL), separated from the decidua and fetal hematopoietic tissues, were dissected from embryos and prepared as previously described (19). Tissues were first mechanically dissociated and then incubated with collagenase (Sigma Chemical, St. Louis, MO) at a final concentration of 0.12% v/v for 1 h at 37°C in phosphate-buffered saline supplemented with 1% fetal bovine serum (FBS; Hyclone, Logan, UT). The cell suspension was washed once in PBS with 1% FBS, and subsequently incubated in Murine Mesenchymal Medium with Supplements (Stem Cell Technologies, Vancouver, BC). The medium was replaced twice weekly. When the cultures reached approximately 50–90% monolayer confluence, cells were recovered by using 0.05% trypsin-EDTA for culture expansion. FL stroma lines from E13.5 to 14.5 embryos were established using similar method.
BM cells were collected by flushing the femurs and tibiae of 6-12-week-old mice with PBS supplemented with 1% FBS. Cells were dissociated by gentle pipetting and passed through a 70-μM nylon cell strainer (BD Falcon, Bedford, MA). Red blood cell-depleted bone marrow mononuclear cells (BMMNCs) were plated at a density of 106 cells/cm2 in Murine Mesenchymal Medium with Supplements. Nonadherent cells were eliminated with removal of half the media and replacement with fresh media at day 3.
AFT024 stromal cells (kindly provided by K. A. Moore; Princeton University, Princeton, NJ) from FL, which have been shown to support hematopoiesis previously, were used as a control cell line. The AFT024 cells were cultured in Dulbecco's modified Eagle's medium (DMEM; GIBCO BRL) supplemented with 10% FBS and 5 × 10⁻⁵ mol/L β-mercaptoethanol (2-ME; Sigma) at 32°C, 5% CO2, and 100% humidity (36,55).
Hematopoietic Stem/Progenitor Cell Purification
To harvest adult hematopoietic stem/progenitor cells, 6–12-week-old GFP+ mice [C57BL/6-Tg(UBC-GFP)] (NCI Jackson Laboratory, Bar Harbor, ME) were injected with 150 mg 5-fluorouracil (5-FU) (Sigma) in 0.9% sodium chloride (NaCl, Abbott Laboratories, Chicago, IL) per kilogram of body weight intraperitoneally. Three days later they were killed and single cell suspensions prepared from their femurs and tibiae. To sort GFP+Sca-1+c-Kit+ cells, nucleated cells were incubated with anti-c-Kit-allophycocyanin (anti-c-Kit-APC, BD Bioscience) and anti-Sca-1-phycoerythrin (anti-Sca-1-PE, BD Bioscience) and sorted on a FACSVantage (Becton Dickinson, Mountain View, CA). More than 95% of the sorted cells were GFP+Sca-1+c-Kit+ by flow cytometric analysis.
Coculture of Hematopoietic Stem/Progenitor Cells with Stromal Cells
Stromal cells were prepared on six-well tissue culture plates and grown at 37°C, 5% CO2, and 100% humidity. To determine cobblestone area (CA) formation, enriched Sca-1+c-Kit+ adult BM hematopoietic cells (1,000 cells/well in six-well plates) were seeded onto irradiated (20 Gy, Gammacell 40; Atomic Energy of Canada Limited) stromal monolayers. And the cultures were maintained in α-minimum essential medium (α-MEM; Mediatech Inc., Herndon, VA) supplemented with 100 U/ml penicillin, 100 mg/ml streptomycin (Pen/Strep; GIBCO-BRL), and 20% FBS without cytokine supplement. CA development was evaluated at day 7. The same volume of culture medium was added to the wells on day 7. At different time points (day 7 and 14) of cocultures, individual wells were harvested. The cultured cells (including hematopoietic cells and stromal cells) were stained with trypan blue and counted, the rest replated into cytokine-supplemented semisolid clonogenic progenitor assays (CFU-C). All experiments of coculture were started in triplicate.
Lineage content of the coculture products was determined by Wright/Giemsa staining of a cytospin slide preparation. The harvests were also analyzed by flow cytometry using pan-leukocyte marker anti-CD45 and lineage-specific marker Mac-1, CD3, and CD45RO/B220 (all from BD Bioscience).
In Vitro Hematopoietic Progenitor Cell Assay
The progenitor content of hematopoietic cell/stromal cell cocultures was assessed using in vitro methylcellulose colony-forming assay.
Recombinant murine (rm) interleukin-3 (IL-3) and granulocyte macrophage colony-stimulating factor (GM-CSF) were purchased from PeproTech Inc (Rocky Hill, NJ). Recombinant human (rh) IL-6, granulocyte colony-stimulating factor (G-CSF), and recombinant rat (rr) stem cell factor (SCF) were obtained from Amgen (Thousand Oaks, CA).
Cells were plated in methylcellulose (M4230, Stem-Cell Technologies) supplemented with 100 ng/ml rr SCF, 100 ng/ml rm IL-3, 100 ng/ml rh IL-6, 100 ng/ml rh G-CSF, and 100 ng/ml rm GM-CSF. Hematopoietic colonies (committed colony-forming cells granulocyte-macrophage, CFU-GM) were scored after 14 days of culture in 5% CO2 at 37°C according to the established criteria (47). Colonies that reached greater than 0.5 mm in size after 14 days were scored as high-proliferative potential colony forming cells (HPP-CFC) (32).
Colony assays were also performed with 103 freshly sorted GFP+Sca-1+c-Kit+ BM cells. CFU progenitor contents of all stromal cocultures were normalized to an original input of 103 HSCs.
FACS Analysis
The phenotype of the stromal cell clones derived was determined by FACS analysis. Stroma cells were stained with a panel of antibodies and the corresponding isotype controls. The labeled cells were detected on a FACScalibur cytometer (Becton Dickinson) and analyzed using CellQuest software (BD). There were 100,000 events acquired for each analysis. The antibodies used were CD3-PE, CD11b-PE, CD14-PE, CD34-PE, CD34-FITC, CD45-PE, CD45RO/B220-PE, CD49d-PE, CD90.2-PE, Gr-1-PE, Sca-1-PE, CD117(c-Kit)-FITC, purified rat anti-mouse CD105 (Endoglin) followed by FITC polyclonal anti-rat Ig (all from BD).
Statistical Analysis
The differences in expansion fold among 10 stroma clones, two from each source plus two repeats of AFT024, were analyzed by ANOVA. Post hoc tests by LSD were performed to analyze the difference between two groups. A value of p < 0.05 was considered statistically significant. All statistical analysis was performed using SPSS software (v16.0) (SPSS Inc., Chicago, IL).
Total RNA Extraction and Quality/Quantity Control
RNA of PL1 was extracted from three independent cultures of passage (P) 5, P13, and P27, BM1 from P5, P9, and P11, and two cultures of AFT024. Total RNA was isolated using TRIzol reagent (Invitrogen Life Technologies, Carlsbad, CA) according to the manufacturer's instruction and additionally purified with RNeasy Mini Kit (Qiagen, Cat. #74106). The concentration of RNA was measured by its absorbance at 260 nm, and RNA purity was determined by the ratios of OD260 nm/280 nm using the NanoDrop spectrophotometry (NanoDrop ND-1000, Wilmington, DE). The integrity of the RNA was assessed by detecting RIN (RNA Integrity Number) using an Agilent Bioanalyzer 2100 (Agilent Technologies, Inc., Santa Clara, CA). RIN of all RNA samples used in the experiments was above 9.
Probe Preparation, Microarray Hybridization, and Data Analysis
The RNA was processed for use on GeneChip Mouse Genome 430_2.0 array (Affymetrix, Santa Clara, CA) according to the manufacturer's instructions at the Microarray and Gene Expression Core, University of Miami (Miami, FL, http://www.mihg.org/weblog/core_resources/2007/11/microarray-and-gene-expression.html). Briefly, 5 μg of total RNA was reverse transcribed to double-stranded cDNA. The double-stranded cDNA was used in an in vitro transcription reaction to generate biotinylated cRNA probes. The cRNA probes were purified, fragmented, and hybridized to the Affymetrix chip. Washing and staining was performed in an Affymetrix Gene Chip Fluidics station 450. The Affymetrix arrays were scanned using an Affymetrix Gene Chip Scanner 3000 7G. The hybridizations were performed in three biological replicates for placenta stroma and BM stroma and two replicates for AFT024 as stated above. Analyses were performed using GeneSpring GX 10.0 software (Agilent Technologies). Genes that were present in all PL1 stromal samples and significantly [False Discovery Rate (FDR) <0.05, different by twofold] either up- or downregulated compared to BM1 stromal cells are presented in the results. The genes were assigned to functional classes based on the GO database (http://www.geneontology.org/GO.annotation.html), and significantly overrepresented GO categories in the gene sets were analyzed using the Onto-Express (http://vortex.cs.wayne.edu/projects.htm) (14,28). We also manually, functionally annotated genes using PubMed searches.
Semiquantitative RT-PCR
To validate the results of the microarray analysis, some of the differentially expressed genes by PL1 and BM1 were further analyzed by RT-PCR as described previously (51). The primers were designed using primer design program (http://frodo.wi.mit.edu/cgi-bin/primer3/primer3_www.cgi). The primer sequences are shown in Table 1. Total RNA (1 μg per reaction) was reverse transcribed using Oligo dT and the SuperScript II reverse transcriptase kit (Invitrogen). One twentieth of the cDNA mixture was used for all genes. Samples were amplified in iCycler (Bio-Rad, Richmond, CA) under the following conditions for 35 cycles: first a denaturing step at 95°C for 30 s, then an annealing step at 55–58°C for 30 s, and finally an amplification step at 72°C for 30 s. RT-PCR products were visualized (with ethidium bromide) on a 1.5% agarose gel. Relative gene expression was normalized to housekeeping gene glyceraldehyde-3-phosphate dehydrogenase (GAPDH).
Oligonucleotide Primers Used for RT-PCR
Results
Establishment of Stromal Cell Lines
Stromal cells are the principal components of the HSC microenvironment; thus, stromal cell lines are considered useful tools for analyzing the interaction of hematopoietic cells with its specific niche. We isolated a panel of stromal cell lines from fetal hematopoietic organs (AGM, midgestation PL, and FL) and adult BM, as these tissues/organs contribute to the generation, proliferation/expansion, and maintenance of hematopoietic cells.
Under the culture conditions described above, stromal cells from E10.5–11.5 AGM region could be readily obtained with a population doubling (PD) time of 1–3 days. Of the 47 AGM stromal cell lines established, 25 had a fibroblast-like morphology (Fig. 1A). Nine were mainly composed of large, flat cells and the rest were heterogeneous in morphology.

Representative phase microscopy of stroma cell lines established. (A) From E10.5 AGM. (B) PL1, from E11.5 placenta, showed mainly endothelial-cell like morphology. (C) From E14.5 fetal liver. (D) BM1, from adult BM, showed spontaneous differentiation to adipocytes. AGM: aorta-gonad-mesonephros; PL: placenta; FL: fetal liver; BM: bone marrow; P: passage.
Four stromal cell lines from E11.5–E13.5 PL, four from E13.5–E14.5 FL, and three from adult BM were also established. But their growth kinetics showed distinct characteristics from the AGM stroma cells. While most of the stromal cells showed a heterogeneous fibroblast-like morphology as expected, one line from placenta (PL1) showed mainly an endothelial cell-like morphology (Fig. 1B). One line from BM showed spontaneous differentiation to adipocytes (10–30%) starting from passage 3 (Fig. 1D). Therefore, the morphology of the stromal cells demonstrated significant heterogeneity.
Coculture of Mouse BM c-Kit+Sca-1+ Cells on Stromal Cells: “Cobblestone Area” (CA) Formation
To study the hematopoietic supportive ability of the stromal cell lines established, 103 GFP+c-Kit+Sca-1+ mouse BM cells were sorted and plated on the stromal monolayers and cocultured for 2 weeks. CA colonies appeared beginning on day 3 of incubation with continued increase in colony size and number (Fig. 2).

Cobblestone-like colonies generated in the coculture of mouse BM GFP+c-Kit+Sca-1+ hematopoietic cells with placenta stroma (PL1) on day 7. (A) Phase microscopy. (B) Fluorescent microscopy.
Out of the 57 stromal cell lines established in total, we identified 31 cell lines that could support cobblestone area formation: 22 (22/47) from AGM, three (3/4) from PL, three (3/4) from FL, and three (3/3) from BM. Primary CA colonies formed after 1 week varied markedly (ranging from 11 to 223 colonies per 103 c-Kit+Sca-1+ input) and the size of the colonies was highly variable as well. Nonadherent hematopoietic cells continued to be released into the culture medium. After 2 weeks of culture, individual colonies became coalescent and were unable to be counted separately. Thus, the whole culture products were harvested and the fold expansion determined. Two stromal cell clones from each hematopoietic organ/tissue that gave comparable or better support for murine c-Kit+Sca-1+ cells than AFT024 (36) were included in our statistical analysis.
Total Nucleated Cell (TNC) Expansion
After 1 week, AGM stroma supported expansion of TNC of 284-fold (range: 76–512-fold) compared to the initial input cell number, PL 273-fold (103–440), FL 250-fold (127–412), BM 416-fold (110–612), and AFT024 304-fold (125–482) (ANOVA: p = 0.24) (Fig. 3). After 2 weeks, AGM stroma resulted in 875-fold (670–1100) expansion of TNC, PL 1057-fold (724–1680), FL 991-fold (650–1410), BM 1380-fold (824–2100), and AFT024 1123-fold (700–1512) (ANOVA: p = 0.06) (Fig. 3).
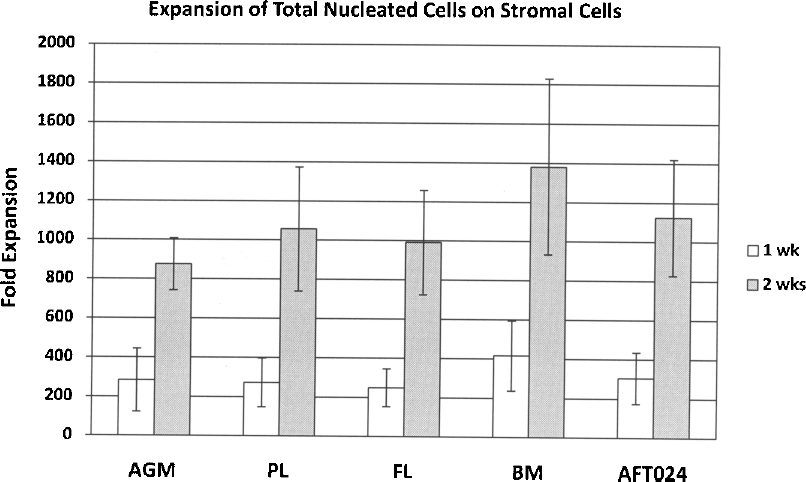
Expansion of total nucleated cells on stroma cell lines. BM c-Kit+Sca-1+ cells were sorted and plated at 1,000 cells/well in six-well plates on stroma cells (irradiated at 20 Gy). Cocultures were maintained for 7 or 14 days at 37°C. From cocultures, both the nonadherent and adherent cell fractions (containing the stromal cells) were harvested and total nucleated cells were counted. The mean in expansion folds of triplicate samples of four experiments is indicated along with the standard deviation. For both 1- and 2-week culture, stroma cells from different sources showed similar effect on total nucleated cell expansion (ANOVA: 1 week, p = 0.24; 2 weeks, p = 0.06).
Progenitor Cell Expansion
Progenitor cell assays demonstrated expansion of early and committed progenitors in all eight stroma cell lines tested, two from each source. Results from CFU assays and two representative experiments are presented in Figures 4 and 5. As shown in Figure 4A, after 1 week, AGM stroma expanded CFU-GMs by 6.1-fold (5–7.4), PL 14.6-fold (10.5–18.9), FL 7.5-fold (5.4–10.2), BM 4.6-fold (2.2–6.1), and AFT024 6.1-fold (4.8–7.8) (ANOVA: p < 0.001). After 2 weeks, AGM resulted in 16.0-fold (10.6–23) expansion of CFU-GMs, 47.5-fold (37.9–61.5) in PL, 27.7-fold (17.8–37) in FL, 18.4-fold (11.1–26.1) in BM, and 22.5-fold (12.4–30.4) in AFT024 (ANOVA: p < 0.001). Therefore, PL stroma cells supported significantly more fold expansion of CFU-GMs after 1 or 2 weeks of coculture (post hoc tests by LSD: p < 0.001).

In vitro colony formation assay. c-Kit+Sca-1+ cells (1 × 10³) from murine BM were cocultured with stroma cells (irradiated at 20 Gy) for 1 or 2 weeks. Harvested cells were applied to colony formation assay. The number of CFU-GM and HPP-CFC was determined at day 14. CFU-GM and HPP-CFC from freshly isolated murine BM 1 × 10³ c-Kit+Sca-1+ cells was used as the control of initial input. The number of colonies indicates the mean ± SD of triplicate cultures. The experiment was repeated four times with similar results (ANOVA: 1 week, p < 0.001 for both CFU-GM and HPP-CFC; 2 weeks, p < 0.001 for both CFU-GM and HPP-CFC). (A) CFU-GM: 1 week: ANOVA significance <0.001. Post hoc testing by LSD test: PL versus AGM, FL, BM, AFT024, p < 0.001. FL versus BM, p = 0.029. 2 weeks: ANOVA significance <0.001. Post hoc testing by LSD test: PL versus AGM, FL, BM, AFT024, p < 0.001. FL versus AGM, p = 0.015. FL versus BM, p = 0.047. (B) HPP-CFC: 1 week: ANOVA significance <0.001. Post hoc testing by LSD test: PL versus AGM, FL, BM, AFT024, p < 0.001. 2 weeks: ANOVA significance <0.001. Post hoc testing by LSD test: PL versus AGM, FL, BM, AFT024, p < 0.001.

In vitro colony formation assay after 1 week of coculture. c-Kit+Sca-1+ cells (1 × 10³) from murine BM were cocultured with stroma cell clones PL1, BM1, or AFT024 for 1 week. Harvested cells (5 × 10⁴) were applied to CFU assay. The number of CFU colonies was determined at day 14. Two representative experiments of CFU-GMs produced from PL1, BM1, and AFT027 stroma coculture are shown. PL1 permitted more CFU-GM production and/or with larger colony size than BM1. The experiment was repeated four times with similar results. BM, bone marrow; PL, placenta; CFU-GM, colony-forming unit-granulocyte macrophage.
The stroma cell lines established also expanded HPP-CFCs, which are defined as colonies grown in semisolid medium whose diameter exceeds 0.5 mm (32). As shown in Figure 4B, after 1 week, AGM stroma expanded HPP-CFCs by 1.7-fold (0.7–2.5), PL 3.9-fold (2.9–4.7), FL 1.7-fold (1.1–2.3), BM 1.5-fold (0.7–2.1), and AFT024 1.9-fold (0.6–2.6) (ANOVA: p < 0.001). After 2 weeks, AGM resulted in 3.8-fold (2.2–5.0) expansion of HPP-CFCs, 8.4-fold (7.2–9.8) in PL, 4.8-fold (3.3–6.9) in FL, 4.0-fold (2.1–5.3) in BM, and 4.2-fold (2.7–5.1) in AFT024 (ANOVA: p < 0.001). Thus, stroma cells from PL also permitted more fold of HPP-CFC expansion than the other stroma cells tested (post hoc tests by LSD: p < 0.001).
When 5 × 10⁴ or 1 × 10⁵ harvested cells from coculture were used for CFU assay, PL consistently produced more colonies with significantly larger size (Fig. 5). Therefore, numbers of CFU-GM and HPP-CFC in the coculture with PL cells were approximately two to three times more than that with BM cells. These result indicated that PL is able to promote the proliferation of hematopoietic progenitors without any exogenous cytokines, more potent than BM or AFT024. PL1 from placenta was identified to be the most superior in supporting CFU-GMs and HPP-CFCs expansion.
To test this further, we also did a cytospin on freshly sorted BM c-Kit+Sca-1+ cells and harvested products of PL1 and BM1 cocultures. Freshly sorted BM c-Kit+Sca-1+ cells had a high nuclear to cytoplasmic ratio, dark blue cytoplasm, and represent BM primitive hematopoietic cells (data not shown). After coculture with BM1 stroma for 1 week, the harvested population mainly consisted of cells with an abundant light-blue cytoplasm and a relatively small nucleus, resembling more mature hematopoietic cells (Fig. 6, bottom panel). Cytospin of cells cultured on PL1 contained more primitive blast-like cells (>10 cells per high power) (Fig. 6, top panel) compared to BM1 (<5 cells per HP).

Cytospin. c-Kit+Sca-1+ cells (1 × 10³) from murine BM were cocultured with stroma cell clones PL1 and BM1 for 1 week. The harvested cells were collected by cytospin centrifugation and stained with Wright-Giemsa stain and observed by microscopy. Top panels: cytospin of hematopoietic cells cultured on PL1 contained more primitive blast-like cells with scant dark blue cytoplasm (>10/high power, 19/42, 14/32, 16/29). Bottom panels: the harvested population from BM1 mainly consisted of cells with an abundant light-blue cytoplasm and a relatively small nucleus, resembling more mature hematopoietic cells with less blast-like cells (<5/high power; 4/33, 6/37, 2/26).
Flow cytometry studies indicated the persistence of immature c-Kit+ and/or Sca-1+ hematopoietic cells along with more mature CD45+ cells, mostly CD11b (Mac-1)+ granulocytes, also CD3+ T lymphocyte, CD45RO/B220+ B lymphocytes in both PL1 and BM1 (data not shown).
Results from the above biological studies indicated that PL1 could be an active component representing the midgestation placenta hematopoietic niche, which appeared to have distinct hematopoietic supportive property than adult BM niche. We thus further pursued these two representative stromal cell lines (PL1 and BM1) by analysis of their phenotype and gene expression profiles.
Surface Marker Expression
We analyzed the surface marker expression to ascribe a phenotype to the stroma cells PL1 and BM1. Not surprisingly, both PL1 and BM1 showed high level of CD105 expression and were negative for CD45. They also expressed Sca-1, which has been shown to be expressed in stroma cells from AGM previously (52). In contrast to AGM stromal cells (52) and BM1 in our present study, PL1 also expressed high levels of CD34 and CD49d (ITGA4, integrin α4) and low level of CD117 (Fig. 7). Phenotypic analysis also confirmed consistency between the three hematopoietic supportive placental stromal lines established with all three expressing Sca-1, CD105, and CD90 and all three negative for CD45 (data not shown).
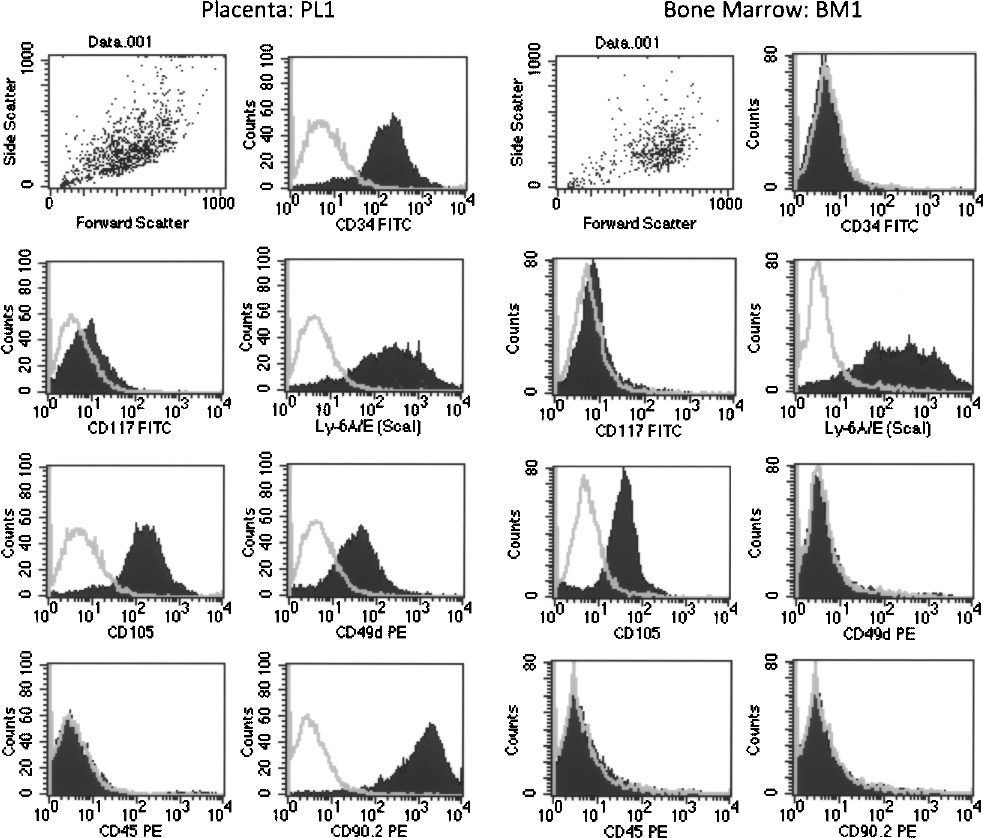
Flow cytometric analysis of surface markers of PL1 and BM1. Stroma cells were trypsinized and harvested for staining with a panel of antibodies and the corresponding isotype controls. The labeled cells were detected on a FACScalibur cytometer and analyzed using CellQuest software; 100,000 events were acquired for each analysis.
Gene Expression Profile of PL1 Stroma
To compare the set of genes differentially expressed between PL1 and BM1, we used GeneChip Mouse Genome 430_2.0 array consisting of 39,000 different transcripts. We identified 1,153 probe sets representing 982 genes that are differentially expressed, with 571 genes upregulated in PL1 and 411 downregulated. These gene products and their gene ontology (GO) annotations (3,14,28) are shown in Table 2.
Top GO Processes Differentially Expressed in Stroma Cell Line PL1 Versus BM1

The molecular function of differentially expressed genes between PL1 and BM1 involved in actin binding and cytoskeletal protein binding, kinase activity, GTPase activator activity, transcription factor activity, guanyl-nucleotide exchange factor activity, and lyase activity in GO clustering (Table 3).
Annotation of Genes That Are Differentially Expressed in Placenta Stroma Compared to Adult Bone Marrow Stroma: Molecular Function

U: upregulated; D: downregulated.
The study of actin filament-associated cytoskeletal gene products reveals higher expression of Arpc3, Spnb2, and Sntb2 and lower level of expression of Tpm2, Myh10, Vill, Gsn, and Sdc2 in PL1 stroma. These genes function in remodeling and communication of stroma cells with neighboring hematopoietic cells.
The study of kinase activity molecules shows that molecules of MAPK signaling pathway including Mapk12, Mapk9, Map3k3, and Map3k7 were highly activated in PL1 stroma.
Highly represented protein kinases in PL1 also included Tie1 (tyrosine kinase receptor 1; 160-fold), Tek (endothelial-specific receptor tyrosine kinase; 80-fold), Kdr (kinase insert domain protein receptor; 120-fold), and Flt4 (FMS-like tyrosine kinase 4; 91-fold). Tie1 and Tek (Tie2) are the members of the Tie family, which are endothelial cell-specific receptor tyrosine kinases critical to vascularization (46). Angiopoietins (Ang1–4) are Tie receptor ligands (50). Kdr (also termed VEGFR-2, Flk-1) and Flt-4 (also termed VEGFR-3) are related transmembrane receptor tyrosine kinases specifically expressed in endothelial cells that mediate vascular endothelial growth factors (VEGF) signal transduction, which is crucial in angiogenesis and vasculogenesis (26,46).
The study of transcription factors reveals the upregulation of Sox7 (SRY-box containing gene 7; 347-fold) and Sox18 (SRY-box containing gene 18; 747-fold), Hhex (hematopoietically expressed homeobox; 114-fold), Meox1 (mesenchyme homeobox 1; 63-fold), homeo box D (D9, D8, D3, D4, and D10), and homeo box B (B9, B6 and B5) in PL1 stroma and downregulation of homeo box C (C9, C8, and C13).
Sox7, Sox17, and Sox18 constitute group F of the Sox family of HMG box transcription factor genes. They are cooperatively involved in mammalian arterio-venous specification. Knockdown of the orthologs of Sox7 and Sox18 together in zebrafish causes severe vascular defects (9). And Sox18 mutation causes human disease hypotrichosis-lymphedema-telangiectasia, characterized by chronic swelling of the extremities due to dysfunction of the lymphatic vessels (24).
Homeobox genes are transcription factors that encode a highly conserved 61 amino acid DNA binding domain termed the homeodomain (18). They are essential for the development of the blood and lymphatic vascular systems. Belotti et al. demonstrated that the expression of 8 out of 10 HoxB cluster genes in human umbilical vein endothelial cells (HUVECs), suggesting their involvement in the generation of new blood vessels (5). Hox D3 has been shown to be abundantly expressed in active proliferating endothelial cells forming tubes in vitro (6). Hhex expression starts soon after that of VEGFR2 in the blood islands and can be used as an early marker for endothelial precursor cells (48). Hhex is required for hemangioblast differentiation into both endothelial and hematopoietic cells (20).
Upregulation of Emcn (endomucin; 2121-fold), Pecam1 (platelet/endothelial cell adhesion molecule 1; 1005-fold), Icam2 (intercellular adhesion molecule 2; 901-fold), Cdh5 (cadherin 5, CD144; 694-fold), Esam1 (endothelial cell-specific adhesion molecule; 656-fold), Prom1 (prominin 1, CD133; 409-fold), Cd34 (CD34 antigen; 11-fold), and Sele (selectin, endothelial cell; 63fold) in stroma PL1 was also observed (Fig. 8).

Hierarchical clustering of genes up- and downregulated in stroma cell clones PL1 and BM1. Each column corresponds to a stroma cell sample from PL1 P5, PL1 P13, PL1 P27, BM1 P5, BM1 P9, BM1 P11, and AFT024, respectively. Each row represents a gene. Color scale indicates the normalized intensity values. Gene clusters are shown at left side. BM: bone marrow; PL: placenta; P: passage.
Endomucin is an early endothelial-specific antigen. During in vitro differentiation of embryonic stem cells to endothelial cells, endomucin is expressed at day 6 after onset of differentiation, 1 day later than PECAM-1 (7). Platelet endothelial cell adhesion molecule-1 (PECAM-1 or CD31), Icam2, Cdh5, and Esam1 are endothelial cell junctional molecules (13). CD133 and CD34 are both progenitor/stem cells markers expressed in hematopoietic lineage and endothelial lineage (39).
On the other hand, BM1 preferentially expressed genes specific for mesenchymal cells, which includes Endosialin (TEM1, CD248; 28-fold), Serpinf1 (740fold), Fgf7 (649-fold), and Col1a1 (collagen, type I, alpha 1; 342-fold) (Fig. 8).
Endosialin (TEM1, CD248) is a marker of stromal fibroblasts (31), interacting with extracellular matrix proteins mediating cell adhesion and migration.
Sarojini et al. (43) have reported a mesenchymal stem cell line from adult mouse bone marrow could secrete pigment epithelium-derived factor (PEDF, Serpin-F1), a member of the serpin protease inhibitor family. Quan et al. (40) have shown PEDF was expressed by osteoblasts lining the bone spicules in the ossification zone of metaphyseal bone, as well as by osteoblasts lining cortical periosteum.
Col1a1 (collagen, type I, alpha 1) has been a well-known marker of osteoblastic differentiation (27).
Several previous studies have shown that osteoblasts play an important function in adult BM niche (8,59,61). In vitro study of human BM mesenchymal stem cells also showed that hematopoiesis-supportive clones are associated with high osteogenic potential (17).
Fibroblast growth factor-7 (FGF-7, keratinocyte growth factor, KGF) is a 163-amino acid glycoprotein synthesized and secreted by mesenchymal cells (e.g., fibroblasts/fibrocytes) in epithelial organs, functioning as a paracrine mediator of epithelial cell proliferation (16).
We searched KEGG and Biocarta databases and PubMed manually using GeneGo (GeneGo, Inc., St. Joseph, MI), and came up with a group of genes specifically or preferentially expressed in endothelial cells or mesenchymal cells. This supervised hierarchical clustering (Fig. 8) showed significant similarity in gene expression profiles between BM1 and AFT024. And the profiles are distinct from that of PL1.
Validation of the microarray results was performed by semiquantitative RT-PCR on 12 selected genes. In accordance with microarray analysis, eight genes associated with endothelial differentiation (Sox18, Sox7, Esam, Pecam1, Prom1, Tek, Tie1, Emcn) showed higher expression in PL1 than BM1, whereas four genes (Fgf7, Col6a2, Col1a1, Serpinf1) were downregulated (Fig. 9). We also compared the three hematopoietic supportive stromal lines (PL1, PL2, and PL3), which were established from midgestation placenta by semiquantitative RT-PCR. We demonstrated the expression of genes associated with endothelial differentiation (Esam, Tie1, and Prom1) in all three placental lines. In addition, other genes that were expressed in PL1, including Fgf7 and Col6a2, were expressed in both PL2 and PL3 (data not shown).

Confirmation of microarray analysis of selected genes by semiquantitative RT-PCR. Equal amount of first-strand cDNA product was used in each reaction. GAPDH gene was used as a housekeeping gene to show equal amplification in all stroma clones. The images showed the amplification products on a 1.5% agarose gel after 35 cycles.
Discussion
The self-renewal potential of HSCs is considered an intrinsic property that is controlled at least in part by the stromal niche. However, during normal homeostasis the main function of HSCs is the production of mature functional blood cells. In contrast, during embryogenesis and fetal development there is a need for expansion of HSC numbers. This led us to propose that the stromal cells derived from hematopoietic tissue at different developmental stages would differ in their ability to support proliferation and differentiation of HSCs. Stromal cells from adult tissue (e.g., the BM) would preferentially support the maintenance and differentiation of HSCs, while stromal cells from fetal tissue would preferentially support proliferation of HSCs. Previously, we have showed that mesenchymal stem cells (MSC) from human umbilical cord blood were capable of supporting ex vivo expansion of hematopoietic stem/progenitor cells (23). In this present study, we have isolated stromal cell lines from fetal hematopoietic organs, namely AGM, PL, FL, and adult BM, and studied their supportive property in ex vivo hematopoiesis.
Our data demonstrate higher levels of support of ex vivo expansion of hematopoietic progenitor cells by placental stromal cells than BM stromal cells or AFT024. BM c-Kit+Sca-1+ cells cultured on PL stroma resulted in higher levels of CFU-GM and HPP-CFC and cytospins demonstrated a significantly higher number of blast-like cells compared to culture on BM stroma. Phenotypically, the PL1 stromal cells were similar to BM1 stromal cells expressing CD105 but not CD45; however, the PL1 stromal cells also expressed CD34 and CD49d.
Genes associated with endothelial differentiation were expressed at high levels in PL1 stroma, suggesting that it is indeed mainly composed of endothelial cells, a phenotype distinct from that previously described stromal cell lines from other fetal origins, like AGM or FL (45,55,57). This is consistent with the role of the placenta, which permits the exchange of oxygen and nutrients between the developing embryo and the mother, and is a highly vascularized tissue (42). During mammalian development, hematopoietic and endothelial cells are derived from a common progenitor of mesodermal origin: the hemogenic endothelial cells or hemangioblasts (10). In the mouse embryo, emergence of HSCs is closely associated with vascular endothelial cells. This associated development of the vascular and hematopoietic systems is a well-recognized feature shared by embryonic hematopoietic sites, including the AGM, yolk sac, and FL. Recently, Runx1 (runt-related transcription factor 1/acute myeloid leukemia 1 [AML1])-positive hemangiogenic endothelial cells have been shown to give rise to HSCs in the placenta labyrinth (19,38). By tracking developing HSCs by the expression of Runx1-lacZ and CD41, Rhodes et al. (41) also found that HSCs emerge in the mouse placental vasculature, independent of blood flow. Studies of human placenta by Barcena et al. (4) showed that cells coexpressing CD34 and CD45 reside either near placenta blood vessels or within the mesenchymal compartment of the villous cores, in close contact with endothelial CD34+CD45- cells or vimentin-positive mesenchymal cells. Because HSCs form clusters on endothelial cells during embryonic hematopoiesis, ligand–receptor signaling may occur between HSCs and endothelial cells (2).
Previously, endothelial cells from yolk sac (30,58) have been used for expansion of haematopoietic progenitors or stem cells. In addition, endothelial cells from human brain have been shown to expand the SCID-repopulating cells in human cord blood (11). There is no consensus as to what cell type represents the hematopoietic niche. The BM stromal cells have been identified as a heterogeneous population of cells of mesenchymal origin that include reticular endothelial cells, fibroblasts, chondrocytes, adipocytes, and osteogenic precursor cells, which provide growth factors, cell–cell interactions, and matrix proteins (53). Osteoblasts have been shown to play an important function in this niche, mainly keeping HSCs in a quiescent state (8,59,61).
Using the microarray technology, we also examine the gene expression profile of AFT024, a stroma cell line that has been extensively studied in its hematopoiesis-supportive property and its molecular profile. Our data were compared to the Stromal Cell Database (StroCDB; stromalcell.princeton.edu) (21) and showed very good agreement. Interestingly, we found the gene expression of AFT024 related more closely to BM1 than PL1 by hierarchical clustering. This confirmed that PL1 represent a unique component of the placenta microenvironment that provides favorable support for the most primitive HSCs.
In summary, our present study suggests that the stroma cell line PL1 from mouse midgestation placenta provides distinct support for ex vivo hematopoiesis compared to stroma from adult BM. PL1 provided superior support for the primitive population indicated by more CFU-GM and HPP-CFC colony formation. Genes associated with endothelial differentiation were expressed at high levels in PL1 stroma, suggesting that it is mainly composed of endothelial cells. These studies underscore our hypothesis that midgestation placenta provides a different microenvironment for hematopoiesis from adult BM, and vascular endothelial cells are major components of this supportive niche. Unlike the adult BM HSC niche, which may impose a restriction signal for HSC proliferation (2), the placenta niche seems to promote rapid expansion of the most primitive hematopoietic cells. Therefore, together with the AGM region, the midgestation placenta niche constitutes an important site for early fetal hematopoiesis (1,19). For practical purpose, midgestation placenta stroma could be used in the ex vivo strategy to expand HSCs, whereby the expansion would favor cell proliferation over cell differentiation (29).