
Abstract
Diabetes mellitus can be treated with islet transplantation, although there is a scarcity of donors. This study investigated whether human mesenchymal stem cells (MSCs) from umbilical cord stroma could be induced to differentiate into insulin-producing cells and the effects of retro-orbital injection of human insulin-producing cells for the treatment of nonobese diabetic (NOD) mice. MSCs were isolated from human umbilical cord stroma and induced to differentiate into insulin-producing cells using differentiation medium. Differentiated cells were evaluated by immunocytochemistry, RT-PCR, and real-time PCR. C-peptide release, both spontaneous and after glucose challenge, was measured by ELISA. Insulin-producing cells were then transplanted into NOD mice. Blood glucose levels and body weights were monitored weekly. Human nuclei and C-peptide were detected in mouse livers by immunohistochemistry. Pancreatic β-cell development-related genes were expressed in the differentiated insulin-producing cells. Differentiated cells' C-peptide release in vitro increased after glucose challenge. Further, in vivo glucose tolerance tests showed that blood sugar levels decreased after the cells' transplantation into NOD mice. After transplantation, insulin-producing cells containing human C-peptide and human nuclei were located in the liver. Thus, we demonstrated that differentiated insulin-producing cells from human umbilical cord stromal MSCs transplanted into NOD mice could alleviate hyperglycemia in diabetic mice.
Introduction
Mesenchymal stem cells (MSCs) were first isolated from bone marrow (8) and were found to have the potential to differentiate in culture into muscle cells, adipocytes, osteocytes, chondrocytes (21,30,35), cardiomyocytes (1,9,13,26), and pancreatic β-cells (15). Moreover, following systemic injection, MSCs have been shown to be incorporated into a variety of tissues, including bone (28,29), muscle (7), lung (28), and epithelium (38). Recently, we found that fibroblast-like cells from Wharton's jelly of human umbilical cord were similar to MSCs in the bone marrow and could be induced to differentiate into adipogenic cells, osteogenic cells, and cardiomyogenic cells (41). Because MSCs from the umbilical cord can be easily isolated and expanded in culture, these cells may prove to be a useful new source of cells for cellular therapies to improve type I diabetes mellitus (DM).
Type 1 DM is an autoimmune disease that results from T-cell-mediated destruction of the pancreatic β-cells in the islets of Langerhans (3,11), thereby inhibiting insulin production. Transplantation therapies for type 1 DM include whole organ transplantation (20,32), isolated islets transplantation (37), and regeneration therapy (43). Although both whole organ and isolated islets transplantation have been used clinically to treat type 1 DM and reduce blood sugar levels and improve survival rates, their use is limited due to the shortage of donors. The quality of donor pancreata is also an important criterion for islet isolation (24). Regeneration therapy, in which stem cells are stimulated to differentiate into insulin-producing cells to replace lost β-cells, would not have such supply limitations (19).
It has been shown that insulin-producing cells could be developed from bone marrow MSCs (17), adipose tissue-derived stem cells (4), human umbilical cord blood-derived mononuclear cells (27), which suggests their potential for use in autotransplantation. However, the number of MSCs that can be cost-effectively isolated and differentiated is a major limitation. Other groups have isolated MSCs from human umbilical cord Wharton's jelly and induced them to differentiate into islet-like cell clusters (5,10,16). MSCs derived from Wharton's jelly have been shown to be suitable for xenotransplantation, as they do not induce frank immune rejection responses (42).
The NOD mouse spontaneously develops insulin-dependent DM (18,23,25). In this study, we used NOD mice as a model of type 1 DM to test the possible curative effects of transplanting insulin-producing cells differentiated from human Wharton's jelly MSCs. We first characterized the insulin-producing cells derived from MSCs of Wharton's jelly, then treated NOD mice by transplanting the differentiated insulin-producing cells. Rather than using renal subcapsular space (40) or tail vein (2) transplantation, we used a retro-orbital injection method that has been used in cell transplantation and is apparently a less stressful procedure when using rodent models (39).
In the current study, we characterized the differentiated insulin-producing cells from MSCs of umbilical cord stroma. The curative effects of these differentiated cells when transplanted into the diabetic NOD mice were also evaluated by measuring their altered blood glucose levels.
Materials and Methods
Cell Culture
Institutional Review Board approval was obtained for all procedures. With the written informed consent of parents, fresh human umbilical cords were obtained after birth and stored in Hank's balanced salt solution (Biological Industries, Israel) for 1–24 h before tissue processing to obtain MSCs. The isolation of MSCs followed Wang et al. (41). Briefly, after removing blood vessels, the mesenchymal tissue was scraped off the Wharton's jelly with a scalpel and centrifuged at 250 × g for 5 min at room temperature The pellet was washed with serum-free Dulbecco's modified Eagle's medium (DMEM) (Gibco, Grand Island, NY), resuspended in 10 ml of DMEM, and centrifuged at 250 × g for 5 min at room temperature. This pellet was resuspended in 15 ml of DMEM containing 0.2 g/ml of collagenase and incubated for 16 h at 37°C. Cells were washed, resuspended in 10 ml of DMEM containing 2.5% trypsin, incubated for 30 min at 37°C with agitation, washed, and cultured in DMEM supplemented with 10% fetal bovine serum (FBS; Sigma St. Louis, MO) and glucose (4.5 g/L) in 5% CO2 in a 37°C incubator prior to use in experiments.
In Vitro Differentiation Cultures
At the fourth to sixth passage, Wharton's jelly MSCs at 70% confluence were induced to differentiate into insulin-producing cells. Cells were cultured for 7 days in CMRL1066 medium containing 10% FBS (Sigma), 1% penicillin/streptomycin/amphotericin B (Biological Industries, Israel), 100 ng/ml of β-nerve growth factor, 4 nM activin-A, 10 mM nicotinamide, and 25 ng/ml of epidermal growth factor (R&D Systems, Minneapolis, MN). The culture medium was changed to DMEM/F12 (Gibco) for 7–10 days. Finally, 10 mM nicotinamide, insulin/transferrin/selenium (Gibco), and 10 ng/ml of basic fibroblastic growth factor were added and incubation was continued for 17 days.
Immunocytochemical Staining for C-Peptide
Control cells (cells cultured without differentiation medium), and day 14 and day 17 differentiated cells were fixed on cover slips with 4% paraformaldehyde for 15 min at room temperature, then washed with phosphate-buffered saline (PBS). Cells were stained using a DakoCytomation EnVision+Dual system-HRP kit (DakoCytomation Inc., Carpenteria, CA) and mouse anti-human C-peptide antibody (Chemicon, Billerica, MA). Briefly, dual endogenous enzyme block solution was added to cover slips and incubated for 10 min at room temperature. Cells were washed with PBS and incubated for 1 h at 37°C with mouse anti-human C-peptide monoclonal antibody (1:100). After 3 × 5-min washes with PBS, the cover slips were incubated for 30 min at room temperature with labeled polymer-HRP. After 3 × 5-min washes with PBS, substrate chromogen was added for 5 min at room temperature, then the cover slips were washed with distilled water. Cell nuclei were visualized by staining with hematoxylin (Sigma).
Measurement of Spontaneous C-Peptide Secretion
After 17 days of differentiation, cells were washed twice with PBS and incubated for 3 h in DMEM-LG (5.5 mM glucose) (Gibco). The medium was collected and stored at −20°C until assayed. C-peptide contents were measured using a C-peptide ELISA kit (Mercodia, Uppsala, Sweden) according to the manufacturer's instructions. TMB substrate was used with absorbance read at 450 nm.
Glucose Challenge Test
After 17 days of differentiation, cells were washed twice with PBS and incubated for 1 h in DMEM-LG (5.5 mM glucose). The medium was collected and stored at −20°C. The cells were then washed twice with PBS, incubated for 1 h in DMEM-HG (25 mM glucose) (Gibco), and the medium collected and stored at −20°C. C-peptide concentrations were measured as above.
Reverse Transcriptase-Polymerase Chain Reaction (RT-PCR) and Real-Time PCR Analysis
RT-PCR
Total RNA was extracted from untreated (control) and treated cells using RNeasy Purification Reagent (Qiagen, Valencia, CA). A sample (4 μg) was reverse transcribed with Mmlv reverse transcriptase (Amersham Life Science, Uppsala, Sweden) for 30 min at 42°C in the presence of an oligo-dT primer. The PCR reaction mixture consisted of 38.5 μl of sterile distilled water, 5 μl of 10× PCR buffer, 1 μl of dNTP, 1.5 μl of each primer, 2 μl of cDNA (4 μg) and 0.5 μl of polymerase (5 U/μl) (Amersham Life Science). cDNA was amplified for 30 cycles (94°C for 45 s; annealing for 45 s; 72°C for 40 s) using the following primer sequences: glucose transporter 2 (Glut2), forward GCCTAGTTAT GCATGCAG and reverse GGTTTGTAACTTATGCC TAAG; insulin, forward GCTGGTAGAGGGAGCA GATG and reverse AGCCTTTGTGAACCAACACC; GAPDH, forward CACCATCTTCCAGGAGCGAG and reverse TCACGCCACAGTTTCCCGGA (Mission Biotech, Taiwan). PCR was performed for 30 cycles of denaturation at 95°C for 30 s, annealing at 55–63°C for 30 s, and elongation at 72°C for 1 min, with a final 10-min extension at 72°C. To exclude the possibility of contaminating genomic DNA, PCRs were also run without reverse transcriptase. The amplified cDNA was separated by electrophoresis on a 1% agarose gel, stained, and photographed under ultraviolet light.
Real-Time PCR
cDNA was prepared from 4 μg of total RNA as above and 200 ng RNA equivalents were used for PCR with specific primers in the presence of SYBR Green I (Light Cycler™-FastStart DNA Master SYBR Green I; Roche, Basel, Switzerland). The sequences of the primers were: Pdx1, forward GGAGCC GGAGGAGAACAAG and reverse CTCGGTCAAGTT CAACATGACAG; NKx2.2, forward ACAAGATGA AACGTGCCCG and reverse GCAGAGGCGTCACCT CCATA; Pax4 forward GGGTCTGGTTTTCCAACA GAAG and reverse CAGCGCTGCTGGACTT; MafA, forward GCTGGTATCCATGTCGTGC and reverse GT CGGATGACCTCCTCCTTG; NeuroD, forward AAG AACTACATCTGGGCTCTGTCG and reverse GCTG AGGGGTCCATCAAAGG; Isl-1, forward TGCCCGC TCCAAGGTGTA and reverse CCGAAGCGCAAATT CGTC; Glut2, forward GCCTAGTTATGCATGCAG and reverse GGTTTGTAACTTATGCCTAAG; insulin, forward ACCAGCATCTGCTCCCTCTA and reverse GGTTCAAGGGCTTTATTCCA; GAPDH, forward CA CCATCTTCCAGGAGCGAG and reverse TCACGCC ACAGTTTCCCGGA (Mission Biotech, Taiwan). A LightCycler® 480 (Roche, Indianapolis, IN) was used for real-time PCR.
Scanning Electron Microscopy
Cells were cultured in differentiation medium or control medium (DMEM containing 10% FBS plus 1% penicillin/streptomycin/amphotericin B) for 17 days, then trypsinized and reseeded on cover slips for 6 h. All subsequent steps were at room temperature. Cells attached to cover slips were fixed in 6% paraformaldehyde for 30 min, washed 5 times with 0.1 M phosphate buffer (PB), incubated for 2 h with 2% osmic acid/PB (1:1), and dehydrated using an increasing ethanol gradient (75–100%). They were then processed for critical point drying, coated with gold, and observed with a JEOL JSM-5300 scanning electron microscope.
Immunogold Labeling and Transmission Electron Microscopy
Differentiated cells were fixed in 6% paraformaldehyde for 4 h, centrifuged (5 min, 1000 × g, 25°C), washed 5 times with 0.1 M PB, then 5% agarose was added to the pellets. Agarose blocks were postfixed with 1% osmic acid, then dehydrated using an increasing ethanol gradient (50–100%). Following reaction with propylene oxide (PO) for 5 min, the blocks were embedded overnight in PO/resin (1:1). Ultrathin sections (70 nm) were stained with 1% osmic acid for 15 min, then with 1.5% lead citrate for 5 min. After washing with distilled water and drying, the sections were examined with a JEOL JEM 2000EXII transmission electron microscope. For toluidine blue staining, sections were stained with toluidine blue for 3 min, then washed with distilled water. For immunogold labeling, ultrathin sections were incubated with goat serum for 20 min to block nonspecific binding, then overnight with rabbit anti-human insulin (1:100) or rabbit anti-human C-peptide (1:100) antibodies, and washed with PBS. Primary antibodies were visualized using gold-labeled goat anti-rabbit IgG antibodies (15 nm gold particles). Sections were counterstained with osmic acid and lead citrate.
Transplantation Model
We used 14 male nonobese diabetic (NOD) mice, 20 week old and weighing 24–27 g (Laboratory Animal Center, National Yang-Ming University, Taipei, Taiwan, ROC). Mice were fed ad libitum and housed on a 12-h light and 12-h dark cycle. These experiments followed institutional animal welfare guidelines.
Transplantation and Physiological Monitoring
NOD mice were divided into two groups, 6–8 mice/group. After blood sugar spontaneously increased to 750–810 mg/dl, the mice were restrained and 5 × 10⁶ differentiated insulin-producing cells suspended in 0.1 ml of normal saline were injected through a retro-orbital vein (30). The control group underwent the same procedure, but was only injected with normal saline (sham group).
Body weight and blood sugar were recorded before and after cell transplantation. Blood was collected from a tail vein and blood sugar levels were measured with a blood glucose meter (Roche, Basel, Switzerland).
Immunohistochemistry
The mice were sacrificed 23 days after transplantation and perfused with 4% formaldehyde (Ferak, Berlin, Germany). The livers were dissected out and cut into 0.5–1.0-cm3 pieces. The samples were dehydrated and embedded in OCT (Sakura Finetek USA Inc, Torrance, CA) in liquid nitrogen. The cryosections (5 μm) were washed twice with PBS, then incubated overnight at 4°C with mouse anti-human nuclei monoclonal (1:400; Chemicon) and rabbit anti-human C-peptide antibodies (1:100; Santa Cruz, Santa Cruz, CA). After three washes in PBS, slides were incubated for 1 h at room temperature with Cy3-labeled goat anti-human IgG (1:200) and rhodamine-conjugated goat anti-rabbit IgG antibodies (1:500) (both from Chemicon). The sections were mounted with mounting medium (Vector Laboratories, Burlingame, CA) and viewed with a fluorescence microscope using appropriate filters.
Intraperitoneal Glucose Tolerance Test
NOD mice were fasted for 6–8 h, after which 10% glucose (2 g of glucose/kg of body weight) was administered intraperitoneally. Blood samples were obtained from the snipped tail and analyzed for glucose levels using a Roche ACCU-CHEK glucose meter (Roche Diagnostics, Indianapolis, IN).
Statistical Analysis
Group comparisons were made by one-way ANOVA followed by Dunnett's test. Survival was assessed using Kaplan-Meier survival curves. A value of p < 0.05 was considered statistically significant.
Results
Detection of C-Peptide in Differentiated Cells Derived From Umbilical Cord Mesenchymal Stem Cells
There is controversy regarding possible insulin uptake by cells from media supplements that may be difficult to distinguish from insulin produced by the cells (14,31). We used human C-peptide to characterize insulin production by our cells, as C-peptide is a marker of residual insulin production (12). Staining differentiated cells with anti-human C-peptide antibodies showed that C-peptide was expressed at days 14 and 17 of differentiation, with greater expression on day 17 (Fig. 1C, D). C-peptide was not expressed in control, nondifferentiated cells (Fig. 1B).

Immunocytochemical staining for C-peptide showing that mesenchymal stem cells from Wharton's jelly can differentiate into insulin-producing cells. (A) No primary antibody control, (B) pretreatment cells, (C) differentiated cells on day 14, (D) differentiated cells on day 17. Scale bars: 100 μm.
Gene Expressions in Differentiated Cells
To determine whether the MSCs had differentiated into insulin-producing cells, the expressions of genes involved with both pancreatic β-cell development and insulin production were examined by reverse transcriptase (RT)-PCR and real-time PCR. As shown in Figure 2A, by RT-PCR, expressions of the pancreatic β-cell development-related genes, insulin and Glut2, were not detected in control nondifferentiated cells, while, after culture for 14 and 17 days in differentiation medium, cells expressed both mRNAs. Real-time PCR was used to quantify gene expressions of differentiated cells compared to the control. mRNA levels for the insulin production and pancreatic β-cell development-related genes MafA, Pax4, NeuroD, Isl-1, Nkx2.2, Glut2, and insulin were significantly increased in differentiated cells on day 17 and, with the exception of Pax4 and MafA, on day 14 (Fig. 2B). Thus, MSCs had the capability to differentiate into β-cells and express genes associated with insulin production.
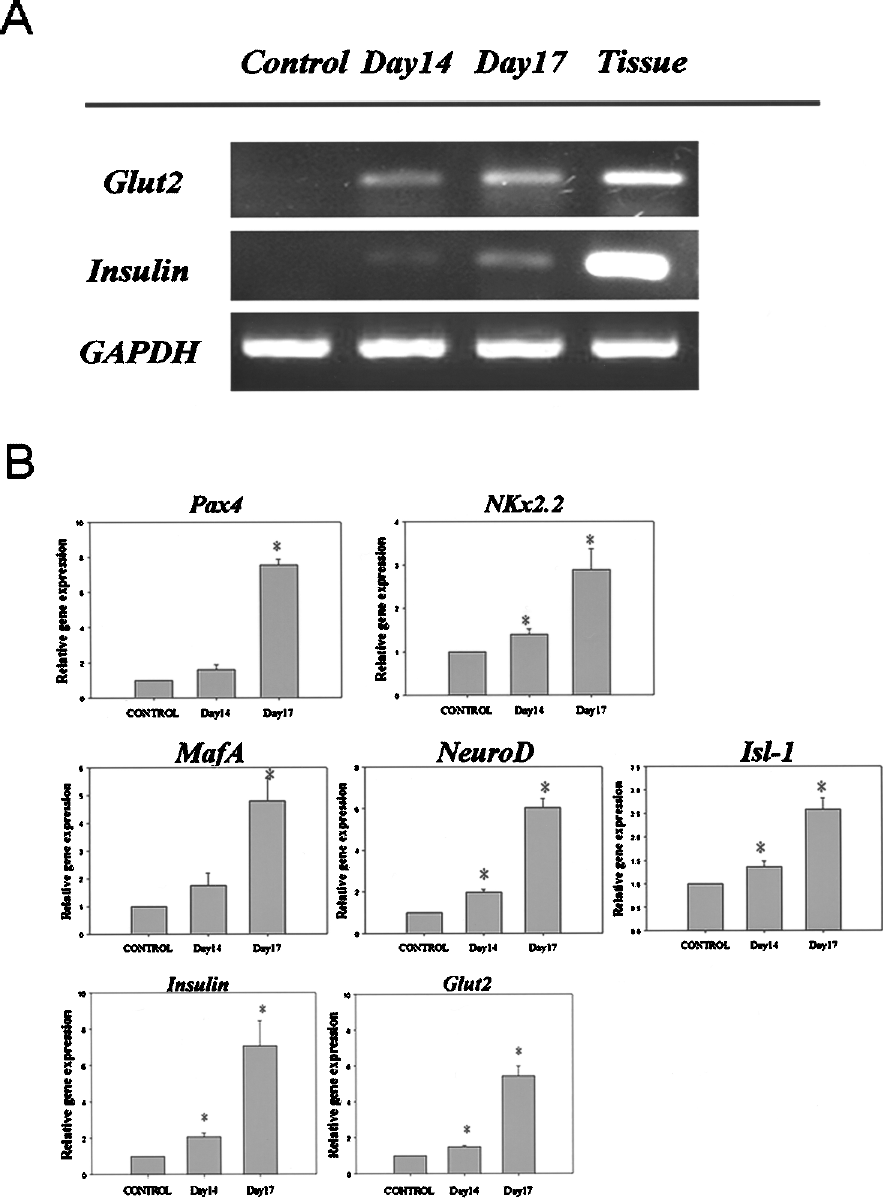
RT-PCR and real-time PCR analyses for the expressions of pancreatic β-cell development-related and insulin production-related genes. (A) RT-PCR results for nondifferentiated cells (lane 1), day 14 differentiated cells (lane 2), day 17 differentiated cells (lane 3), and human pancreas as a positive control (lane 4). (B) Real-time PCR analyses for the expressions of Pax4, Nkx2.2, MafA, NeuroD, Isl-1, insulin, and Glut2. Results are the means ± SEMs for 4 experiments. *p < 0.05 compared to nondifferentiated cells.
Ultrastructural Studies of Differentiated Cells
Ultrastructurally, the formation of microvilli is one characteristic of differentiated cells. Both scanning electron microscopy (Fig. 3A) and transmission electron microscopy (Fig. 3B) showed that microvilli, a characteristic of β-cells, were visible on the surfaces of differentiated cells. Scanning electron microscopy showed that no microvilli or granules were present in control cells (Fig. 3A, a) and some extracellular matrix was seen on the cell surface (Fig. 3A, b, c). For differentiated cells, microvilli were present (Fig. 3A, d–f) and secretory granules could be seen near the cell membrane (Fig. 3B, f). However, because microvilli formation is a common feature of many differentiated cells, immunogold electron microscopy also showed that both insulin (data not shown) and C-peptide (Fig. 3B) were present in the secretory vesicles of the differentiated cells. No specific immunogold labeling was seen in the control cells (data not shown). Toluidine blue staining also revealed secreted particles in the differentiated cells (data not shown). These ultrastructural features are typical of β-cells within insulin-producing clusters and suggest that these cells had differentiated into β-cells capable of producing insulin.

Scanning electron microscopy (A) and transmission microscopy (B) of control and day 14 differentiated cells. (A) (a–c) Control cells with extracellular matrix visible on the surface; (d–f) day 14 differentiated cells with microvilli visible on the cell membrane (e) and a secretory vesicle (f). Scale bars: 5 μm. (B) Anti-C-peptide immunogold staining of differentiated cells (a), with immunogold staining of secretory granules (arrows, b–d). Scale bar: 100 nm.
C-Peptide Secretion by Differentiated Cells in Response to Glucose Stimulation
C-peptide is a byproduct of new insulin formation (12). The concentrations of C-peptide in the media of differentiated cells on days 14 and 17, measured by ELISA, showed that these cells secreted higher levels of C-peptide than the pre-treatment cells (Fig. 4A). To determine if these insulin-producing cells were responsive to glucose challenge, C-peptide secretion was measured. As shown in Figure 4B, differentiated cells secreted C-peptide in a low glucose concentration (5.5 mM) medium and secreted approximately twice as much in a high glucose concentration (25 mM) medium. Thus, these differentiated MSCs could respond to changes in glucose concentration by altering their C-peptide production and, presumably, insulin production.
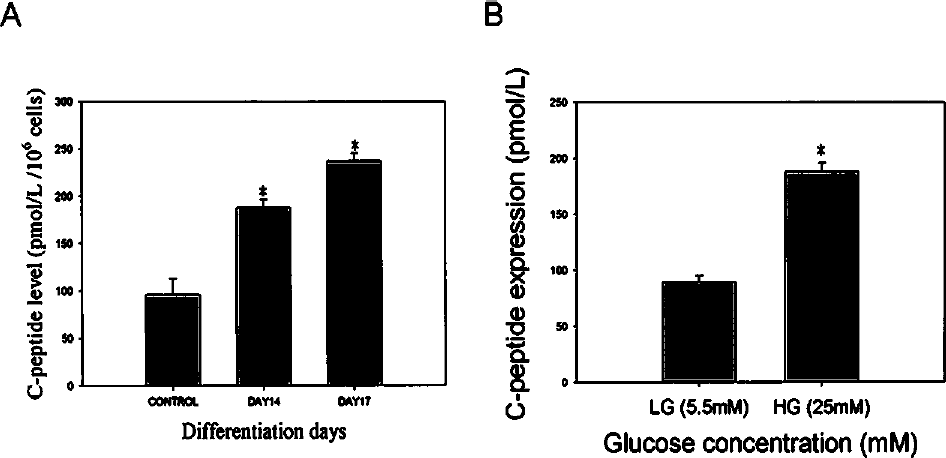
C-peptide secretion and stimulation by high glucose levels. (A) Spontaneous C-peptide secretion. The media for 106 cells were collected on days 14 and 17 and C-peptide concentrations were measured. (*p < 0.05 compared to nondifferentiated cells). (B) Glucose challenge test for C-peptide release in response to low (5.5 mM) or high (25 mM) glucose concentrations by day 17 differentiated cells. (*p < 0.05 compared to 5.5 mM glucose). Results are the means ± SEMs for 4 experiments.
Cell Transplantation Effects on NOD Mouse Blood Sugar and Body Weight Changes, and Human C-Peptide and Human Cell Nuclei in Mouse Livers
Finally, we sought to determine if these differentiated insulin-producing cells had any effects when transplanted into NOD mice. After mice began to exhibit hyperglycemia, in the cell transplantation group, body weights were significantly higher than in the sham group 7 days after transplantation (Fig. 5A) and blood sugar levels were significantly lower at 3 days after transplantation (Fig. 5B). Survival for the cell transplantation group was significantly longer than the control group (Fig. 5C). Because most of the control group NOD mice had died by 23 days, we only evaluated effects in the transplantation group for this period of time. At 23 days after transplantation, insulin-producing cell function was evident by the appearance of both human C-peptide and human cell nuclei at the same sites within the lobules of mouse livers, as shown by double staining (Fig. 5D). Neither of these was detected in the sham group (data not shown). This suggested that the insulin-secreting cells differentiated from human Wharton's jelly stem cells were able to function as islet-like structures following transplantation.
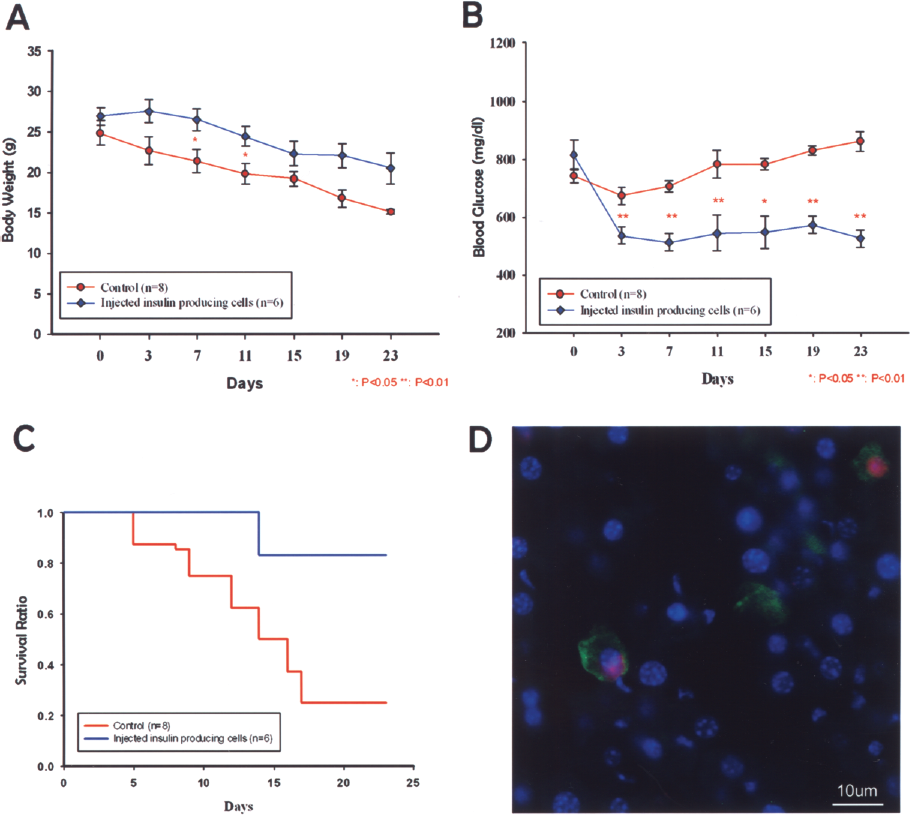
Blood sugar levels and body weight changes, survivals, and double-immunostaining for human C-peptide and human nuclei in NOD mice livers. (A) Body weight changes of sham-treated controls (n = 8) and mice that received cell transplantations (n = 6). Results are means ± SEMs. *p < 0.05 compared to controls. (B) Changes in blood glucose levels. Results are means ± SEMs. **p <0.01 compared to controls. (C) Kaplan-Meier survival curves for control and cell transplantation groups. (D) At 23 days after transplanting insulin-producing cells, double immunostaining was done for human C-peptide and human nuclei in the liver of a NOD mouse. Anti-human nuclei antibody (green); anti-human C-peptide antibody (red). Scale bar: 10 μm.
Transplantation of MSCs Improves Glucose Tolerance in Diabetic NOD Mice
To further define the function of the transplanted MSCs, glucose tolerance tests were done at day 14 posttransplantation. After intraperitoneal glucose injection, blood glucose values were significantly lower in mice that had been transplanted with MSCs compared to mice that received saline (Fig. 6). In contrast, blood glucose levels remained elevated in mice that received saline. Collectively, these results indicated that transplantation of MSCs lead to superior glucose control and tolerance as compared to controls.

Improvements in glucose tolerance in diabetic NOD mice transplanted with MSCs. At day 14 after transplantation, mice were fasted overnight and then injected intraperitoneally with glucose (2 g/kg of body weight). At the indicated time points, blood glucose levels were measured in samples from snipped tails using a glucometer. Results are means ± SDs (n = 6).
Discussion
Adult bone marrow-derived cells can be induced to differentiate into insulin-producing cells under defined conditions (15). Stem cell regeneration is an attractive insulin replacement therapy. Stem cells from the pancreas (6,33), bone marrow (2), umbilical cord blood (36), and embryo (31) have been used in research on regeneration therapies for DM. Recently, we found that Wharton's jelly from the human umbilical cord contains mucoid connective tissue and fibroblast-like cells, which are similar to MSCs (41). The aims of this study were to determine if these cells could be differentiated into insulin-producing cells and if these insulin-producing cells had any curative effects when transplanted into the livers of diabetic NOD mice by altering their blood glucose levels.
Many differentiation conditions have been used to induce stem cells to differentiate into islet-like cell aggregates (4,16,27). Islet-like cell clusters have also been observed in the gall bladder of a diabetic woman (34). Our results showed that human umbilical cord MSCs could be differentiated into insulin-producing cells, but did not form aggregates when incubated using these specific conditions. It could be that the differentiation conditions used in our study were different from other studies, which included serum-free medium (16), glass petri plates (4), tissue culture-treated plates (27), and ultra-low attachment plates (15).
Our results showed that human umbilical cord MSCs could be differentiated into insulin-producing cells by incubating them under specific conditions. Previous studies on inducing insulin-producing cells from umbilical cord MSCs showed limited success, as the islet-like clusters that developed did not show good insulin production after glucose challenge (5,10). However, there is controversy regarding insulin uptake by cells from media supplements that may make it difficult to distinguish from the insulin produced by the cells themselves (14,31). Instead, we used human C-peptide to characterize insulin production by our cells.
Proinsulin, the precursor of insulin, is an 84-amino acid peptide comprised of three segments: A-chain, B-chain, and C-peptide. C-peptide is released from proinsulin; however, unlike the A- and B-chains, it is not taken up by cells and, as a result, C-peptide levels can be used as a marker of insulin secretion (12). After exposing Wharton's jelly MSCs to differentiation conditions, the cells expressed both insulin and C-peptide. These changes were demonstrated by immunocytochemical staining (Fig. 1 and data not shown).
In our in vitro studies, expression of β-cell development-related genes was examined by RT-PCR and real-time PCR before and after induction of differentiation (Fig. 2). After differentiation for 17 days, the insulin-producing cells expressed the pancreatic β-cell development-related genes Pax4, Nkx2.2, MafA, NeuroD, Isl-1, Glut2, and insulin (Fig. 2). Real-time PCR showed that Glut2, which is expressed in pancreatic β-cells, showed an approximately sixfold increased expression after 17 days of differentiation. Moreover, the surface of the differentiated cells observed by scanning electron microscopy showed a secretory cell phenotype (Fig. 3A). The ultrastructures and immunogold labeling of the differentiated cells also showed that these cells contained C-peptide (Fig. 3B). To test whether the differentiated cells generated in vitro showed the functional characteristics of insulin-producing cells, we performed C-peptide secretion assays and found that they had increased C-peptide secretion in response to high glucose (Fig. 4).
In our in vivo study, the differentiated cells were transplanted into NOD mice and the therapeutic effects of transplantation were determined. Wharton's jelly tissue was used as opposed to pancreatic stem cells, as it contains many times more stem cells than the pancreatic duct. Specifically, each cubic centimeter of Wharton's jelly sample contains 1–1.5 × 10⁴ MSCs and the number of cells increases 300-fold after seven passages, providing a plentiful supply of cells for transplantation. In addition, Wharton's jelly stem cells are preferable to ES cells, as they avoid the risk of forming teratomas and the ethical issues inherent in using ES cells. It has been shown that MSCs derived from Wharton's jelly are suitable for xenotransplantation, as they do not induce frank immune rejection responses (42). Further, our study used NOD mice and not NOD/SCID, which are more prone to immune rejection phenomena.
The portal vein (22), renal subcapsular space (42), and tail vein (2) have been previously used as stem cell transplant locations for insulin regeneration therapies in the rat. In this study, cells were transplanted into the NOD mice via a retro-orbital vein, as this is an apparently less stressful administration route when using rodent models (39). We found that, after cell transplantation, blood sugar levels tended to decrease.
In order to test the function of the MSC-derived insulin-producing cells in vivo, we transplanted the differentiated cells into NOD mice. The NOD mouse may be a more appropriate model of type 1 DM than other models (2,18,25). In this study, after transplanting insulin-producing cells into diabetic mice, blood glucose levels decreased, and C-peptide could be identified in the transplanted cells in the liver, suggesting that the transplanted cells secreted functional insulin (Fig. 5). Thus, after transplantation, insulin-producing cell grafts could reduce hyperglycemia in NOD mice. However, the blood glucose levels of the NOD mice did not return to normal levels.
On the third day after transplantation, blood glucose levels decreased to approximately 520 mg/dl compared to 810 mg/dl in the control NOD mice. The body weights of the untreated diabetic rats decreased rapidly, whereas the body weights of the transplanted mice decreased slowly. In addition, survival curves showed significant differences between the control and cell transplantation groups (Fig. 5). In vivo glucose tolerance test results showed that blood glucose levels were decreased in the cell transplantation group (Fig. 6). We believe that transplantation may slow down the appearance of symptoms of DM rather than cure the disease. The transplanted cells were present in the liver and could be stained with anti-human nuclear and anti-human C-peptide antibodies (Fig. 5C).
In conclusion, our results show that human MSCs from the umbilical cord stroma can differentiate into pancreatic lineage cells in vitro and function as insulin-producing cells both in vitro and in vivo. These results suggest that these cells are a promising stem cell source for β-cell regeneration. Umbilical cord stromal MSCs are a ready source for inducing the differentiation of cells into a desired target cell type, and have minimal risks for both cell retrieval and rejection after transplantation. Further work is required to examine the curative effects on larger animal models and humans.
Footnotes
Acknowledgments
We thank Mr. Chih-Chang Yang for the statistical analysis. This research was partly supported by research grants from Taipei Veterans General Hospital (V98E1-010; V99E1-004) to T.-H. Chen, the National Science Council, Taiwan (NSC 95-2320-B-010-036-MY2; NSC 97-2320-B-010-019-MY3) to H.-S. Wang, and a grant from the Ministry of Education, Taiwan, Aim for the Top University Plan to H.-S. Wang and T.-H. Chen.