
Abstract
The cell line M213-2O CL-4 was derived from cell line M213-2O and further modified to express human glutamate decarboxylase (hGAD-67), the enzyme that synthesizes GABA. Brain transplants of this cell line in animal models of epilepsy have been shown to modulate seizures. However, the mechanisms that underlie such actions are unknown. The purpose of the present study was to characterize this cell line and its responsiveness to several depolarizing conditions, in order to better understand how these cells exert their effects. Intracellular GABA levels were 34-fold higher and GAD activity was 16-fold higher in clone M213-2O CL-4 than in M213-2O. Both cell lines could take up [3H]GABA in vitro, and this uptake was prevented by nipecotic acid. By combining GABA release measurements and calcium imaging in vitro, we found that high extracellular K+, zero Mg2+, or glutamate activated M213-2O CL-4 cells and resulted in GABA release. The response to glutamate appeared to be mediated by AMPA/NMDA-like receptors. High KCl-induced GABA release was prevented when a Ca2+-free Krebs solution was used, suggesting an exocytotic-like mechanism. These results indicate that the cell line M213-2O CL-4 synthesizes, releases, and takes up GABA in vitro, and can be activated by depolarizing stimuli.
Introduction
Ex vivo gene therapy in the central nervous system implies the use of cells as vehicle to deliver factors into the brain, and it has been proposed as an alternative therapeutic approach to treat refractory temporal lobe epilepsy, neuropathic pain, and neurodegenerative disorders such as Huntington's and Parkinson's diseases (1,5,14,29). In particular, increased gamma-amino butyric acid (GABA) neurotransmission could reduce epileptic discharges, have antiepileptogenic or anticonvulsive effects, or it may repair damaged areas (i.e., hippocampus) (22,38,39). Indeed, transplants of the GABAergic cell line M213-2O CL-4 have been shown to decrease the frequency and intensity of audiogenic seizures (36) and tonic-clonic seizures induced by kainic acid (10,11).
Cell line M213-2O CL-4 was derived from cell line M213-2O, originally obtained from the ganglionic eminence of Sprague-Dawley rats (E14–15) and immortalized using the A58 temperature-sensitive allele of SV40 large T antigen (20,21). By chromatographic methods it was shown that this cell line had GABA levels similar to those found in rat striatum (20). In order to enhance their GABAergic properties, M213-2O cells were transfected with a nonviral, Epstein-Barr-based episomal plasmid containing the human glutamate decarboxylase (hGAD-67) gene (12). One of the resulting clones, clone 4 (M213-2O CL-4), expressed high levels hGAD-67 as measured by Southern blot, produced higher amounts of GABA, and released more GABA after a depolarizing stimulus when compared to the parent cell line M213-2O (10).
Castillo et al. (11) found that this cell line has antiepileptogenic properties as evidenced by a reduction in generalized seizures induced by kainate (5 mg/kg) in the group of rats with M213-2O CL-4 cells transplanted into the substantia nigra reticulata (SNr). In a model of recurrent spontaneous seizures, Castillo et al. (10) showed that intranigral transplants of cell line M213-2O CL-4 resulted in reduced convulsions and increased GABA levels in the area of the transplant. Thus, a possible explanation for the effects described is that transplantation of M213-2O CL-4 cells results in the release of GABA in response to endogenous stimuli, with the consequent inhibition of the surrounding cells. Accordingly, Thompson (39) observed increased GABA levels in the hippocampus several days after transplantation of a mouse cortical cell line carrying the cDNA coding for GAD-65 under the control of a tetracycline-controlled plasmid. GABA levels in vivo and in vitro decreased when the cells were treated with doxycycline, as did the anticonvulsive effects. Thus, the available evidence suggests that the release of GABA at the site of the transplant could bring about the reduction of seizures (10,11,36,38,39).
GABAergic input coming from the striatum and a glutamatergic input arising from the subthalamic nucleus regulate SNr activity (11). The SNr, in turn, affects the activity of the superior colliculus, pedunculopontine nucleus, and thalamus. The SNr is considered a subcortical region capable of modulating seizure threshold, but it is not fully understood how it may modify cortical activity (28). As discussed above, it has already been shown that intranigral transplants of GABAergic cell lines have antiepileptogenic and anticonvulsive effects. These results suggest that the transplanted cells become integrated into the SNr and can reduce its activity; thus, the cells may be responding to glutamate and GABA present in this network.
In the present study, both the parent cell line M213-2O as well as clone M213-2O CL-4 were characterized and compared in terms of GAD activity, total GABA content, extent, and mechanism of GABA release in response to depolarizing stimuli, and GABA uptake in vitro. Using calcium imaging, we also characterized the activity of M213-2O CL-4 cells under the same depolarizing conditions. We found that M213-2O CL-4 cells are activated, and they release GABA upon glutamate activation of AMPA/NMDA-like receptors; furthermore, these cells synthesize, take up, and release GABA in a calcium-dependent manner.
Materials and Methods
Cell Cultures
Cell lines were cultured in DMEM-F12 medium (1: 1, Gibco, Invitrogen Life Technologies, Carlsbad, CA, USA) supplemented with 10% fetal bovine serum (FCS, Gibco) and 1% penicillin/streptomycin (Gibco) in 75-cm2 culture flasks at 33°C and 5% CO2. Only the cell line containing the hGAD-67 cDNA (M213-2O CL-4) was grown in selection medium containing Hygromycin B (200 μg/ml) (Sigma-Aldrich, St. Louis, MO, USA).
Proliferation Tests
M213-2O and M213-2O CL-4 cells were propagated in DMEM-F12 medium supplemented with 10% FCS (fetal bovine serum) and 1% penicillin/streptomycin in culture flasks at 33°C, 37°C, and 39.5°C with 5% CO2. Cells were plated at equal density in six-well plates and cultured for 6 days. Viable cell numbers at various times were determined for four independent wells with the trypan blue exclusion test. The average number of viable cells was used to calculate cell growth at each temperature.
GABA Uptake
To measure GABA uptake, M213-2O and M213-2O CL-4 cells were plated and washed once with Tris-Krebs buffer (pH 7.4) containing 144 mM NaCl, 5 mM KCl, 1.2 mM MgSO4, 1.2 mM CaCl2, 1.2 mM NaH2PO4, 15 mM Tris, and 10 mM glucose. The cells were incubated for 10 min in 200 μl of 100 nM 4-amino-n-[2,3-3H] butyric acid with a specific activity of 94 Ci/mmol (Radiochemical batch analysis, GE Healthcare, UK), and 0.1 mM nipecotic acid (Aldrich, USA) was added to some wells. The plates were then washed once with buffer and incubated for 10 min in 250 μl of 10% sodium dodecyl sulfate (SDS). Distilled water (750 μl) was added to each well at the end of the incubation, and cells were scraped from the wells and transferred into vials with 10 ml of scintillation cocktail. Radioactivity was counted using a scintillation counter (Beckman, Coulter LS 6500, Multi Purpose Scintillation Counter, USA).
Intracellular GABA and Glutamate
GABA and glutamate levels were measured by high-performance liquid chromatography (HPLC 1100 Series, Agilent Technologies, Waldbronn, Germany) using a reverse-phase, C18 column (ESA HR 80, 4.6 × 80 mm; 3 μm) and an electrochemical detection system (Coulochem III, USA), after precolumn derivatization with O-phthalaldehyde (10). The mobile phase was a 50 mM sodium phosphate buffer containing 25% methanol, pH 6.75, at a flow rate of 1.2 ml/min. The GABA and glutamate content were calculated based on external standards. Samples were run in duplicate, and the concentration of each sample was expressed in μmol/g of protein. To determine total GABA and glutamate content for each cell line, cells were cultured in 25-cm2 flasks. When they reached 90% confluence, 1 ml of 35% sulfosalicylic acid was added. After 20 min, cells were separated with a cell sorter, placed into tubes, and stored overnight at 4°C. After centrifugation at 1129 x g for 5 min at 3000 rpm (Sorvall MC-12V, Thermo Scientific, Waltham MA, USA) the supernatant was kept at −70°C until analyzed by HPLC. Protein concentration in the pellet was estimated by the Bradford method, using bovine serum albumin as standard.
GAD Activity Assay
Total GAD activity was measured with l-[1-14C] glutamic acid as the substrate using the 14CO2-trapping method described previously (13). Briefly, cells were homogenized in 50 mM Na2HPO4; the reaction mixture contained 65 μl of homogenate (~15 mg/ml protein), 87 μl of 0.5 mM pyridoxal-5′-phosphate, 40 μl of 1.13 mM dithiothreitol, 7 μl of 2 mM Glut, and 5 μl of 2 mM 1-[1-14C]Glut (0.05 μCi), in a total volume of 350 μl, pH 7.4. The samples were incubated in a shaking incubator bath at 37°C for 1 h to allow the released 14CO2 to be trapped in 50 μl of 4 mM hyamine hydroxide. The reaction was stopped by the addition of 83 μl of 2.5 N H2SO4, and the incubation continued for 45 min to ensure the total release of the CO2. The negative control (blank) contained no cells. Radioactivity retained by hyamine hydroxide was measured in 10 ml of scintillation cocktail using a scintillation counter after waiting 12 h to minimize quenching. GAD activity is expressed as nmol of 14CO2 release/mg of protein in 30 min, and the results are given as the mean ± SE from six samples. Protein was determined by the Bradford method.
Morphological Appearance and Protein Expression
Cell cultures were used to verify the expression of glutamate decarboxylase-67 (mouse anti-GAD-67, MAB5406, Chemicon, CA, USA; 1:3000), glial acidic fibrillary protein (anti-rabbit GFAP, H-50, Santa Cruz Biotechnology, CA, USA; 1:1000,), β-tubulin (mouse anti-β-tubulin E7, Developmental Studies Hybridoma Bank, University of Iowa; 1:1000), simian virus-40 (anti-mouse SV40 large T antigen, BD Pharmingen, CA, USA; 1:500, 1:1000), EBNA-1 (anti-mouse EBNA-1, MAB8173, Chemicon; 1:200), and neuronal nuclei (anti-mouse NeuN, MAB377, Chemicon; 1:1000); cell nuclei were stained for 30 min with 5 mM Hoechst 33342 (Molecular Probes, OR, USA). Briefly, culture medium was aspirated, cells were incubated in 4% paraformaldehyde for 10 min, washed (3 × 15 min) with 0.1 M phosphate buffered saline (PBS) pH 7.4, incubated with 0.3% Tween for 10 min at −20°C, washed (3 × 15 min) with PBS, incubated in PBS containing 10% horse serum for 10 min, incubated with the first antibody overnight, washed with PBS containing 10% horse serum (5 × 3 min), and incubated in the appropriate secondary antibody [anti-mouse IgG Fluor, Millipore CA, USA, 1: 200; anti-rabbit IgG (H+L), FITC conjugated, Zymed, CA, USA, 1:200; or biotinylated anti-mouse IgG, Vector laboratories, CA, USA, 1:600] for 120 min at room temperature, and then washed with PBS containing 10% horse serum (5 × 3 min). When appropriate, sections were incubated for 90 min with the ABC complex (Vectastain™ Elite ABC standard kit), exposed to 36 μM diaminobenzidine (Sigma) for 5–10 min, and the reaction was intensified with a 0.1% nickel solution (Sigma). The coverslips with cells attached were carefully retrieved and mounted onto glass slides using a Vectashield/DABCO mounting medium (Vector laboratories, CA, USA).
Electron Microscopy
Following cell confluence, the cells were separated from the petri dishes and fixed for 2 h at 4°C in a solution of 3% glutaraldehyde in 0.1 M cacodylic acid buffer and postfixed in 2% OsO4 in the same buffer. The cells were then dehydrated in ethanol and embedded in Epon. The blocks were thin sectioned (60 nm) in an ultramicrotome, mounted on 300-mesh cooper grids, and stained with uranyl acetate and lead citrate. They were observed in an electron microscope (JEOL JEM 1010) at 20,000x.
Calcium Imaging in M213-2O CL-4
M213-2O CL-4 cells were incubated in the dark with 10 μM fluo 4-AM (Invitrogen, CA, USA) dissolved in artificial cerebrospinal fluid (aCSF) containing 0.3% pluronic acid for 20 min at 31°C (9,32). The aCSF contained 119 mM NaCl, 3 mM KCl, 1.5 mM CaCl2, 1 mM MgCl2, 25 mM NaHCO3, and 30 mM d-glucose, pH 7.4, and had been bubbled with carbogen (95% O2 and 5% CO2). Loaded cells were transferred into a chamber, continuously perfused with aCSF, on a microscope adapted to an epifluorescence system (Eclipse E600FN; Nikon, Melville, NY, USA). Excitation at 488 nm was performed with a Lambda LS illuminator (Sutter Instruments, Novato, CA). Imaging software was RS Image (Photometrics; Roper Scientific, Tucson, AZ, USA). The image field was 800 × 600 mm in size. Short movies (185 s, 40-ms exposure, 4 images per second) were taken at 15-min intervals over a period of 1 h. Cells active during the experiment were analyzed.
Image Analysis
Image processing was carried out with Image J (v.1.36, National Institutes of Health) and custom-made programs written in IDL (9). All active cells in a field were semiautomatically identified, and their mean fluorescence was measured as a function of time. Single pixel noise was removed using a 5 pixel ratio mean filter. Calcium-dependent fluorescence signals were computed as (Fi - Fo)/Fo, where Fi is fluorescence intensity at any frame and Fo is resting fluorescence (i.e., average fluorescence of the first 4 frames of the movie). Calcium signals were detected based on a threshold value given by their first time derivative (2.5 times the standard deviation of the noise value). Thus, we obtained a C x F binary matrix where C represents the number of active cells, and F is the number of frames for each movie. Recordings were inspected manually to remove artifacts and slow calcium transients that probably correspond to cell activity (9,24–26). After defining calcium transients, we quantified both the number of active neurons and the number of calcium transients per cell.
GABA and Glutamate Release In Vitro
GABA and glutamate levels were measured by HPLC as described above. Cells were cultured in six-well plates until they reached 90% confluence. The medium was then aspirated, and cells were washed with sterile saline solution (0.9% NaCl); 500 μl of a Ringer solution (4 mM KCl, 1.0 mM MgCl2, 1.8 mM CaCl2, 3.0 mM NaH2PO4, 140 mM NaCl, 10 mM HEPES, 5 mM glucose, pH 7.4) was added and retrieved after 5 min in order to obtain basal GABA and glutamate levels; then a buffered solution containing 50 mM KCl and 94 mM NaCl was added and retrieved after 15 min. The collected supernatant was frozen at −70°C until HPLC analysis was done. For protein determination the cells were detached from the culture plates, and protein was quantified by the Bradford method.
Mechanism of GABA Release
Cells were incubated for 5 min with a low KCl (4 mM) buffer solution to obtain basal levels, then cells were incubated in a Ringer solution containing high KCl (50 mM) either with 1.8 mM Ca2+ or with 1 mM EGTA and without Ca2+ (substituted by MgCl2). The conditioned medium was collected 4 times at 5-min intervals, and GABA levels were quantified. The samples were stored at −70°C until chromatographic analysis. Cells from each well were resuspended in saline, and an aliquot was used to obtain protein levels by the Bradford method.
Glutamate Stimulation
GABA release and calcium transients were also evaluated after stimulation with 100 and 500 μM glutamate, 400 nM kainic acid (Sigma), 30 mM NMDA (Sigma) in low Mg2+ Ringer (0.5 mM MgCl2), and after incubation in a Ringer solution without MgCl2. In addition, the glutamate NMDA antagonist 3-(2-carboxypiperazine-4-yl) propyl-1-phosphonic acid (CPP) (10 μM) (Sigma) and the AMPA/kainate glutamate antagonist 6-cyano-7-nitroquinoxaline-2,3-dione (CNQX, 10 μM) were added to the medium; the calcium channel blocker cadmium was tested at 200 μM in separate experiments. For GABA release, conditioned medium was collected after 10 min and stored at −70°C until chromatographic analysis. Cells from each well were resuspended in saline, and an aliquot was used to measure protein levels by the Bradford method. For calcium imaging, short movies (185 s, 40-ms exposure, 4 images per second) were taken at time intervals of 15 min over the course of 1 h.
Statistical Analysis of Data
One- or two-way analyses of variance (ANOVA) followed by Fisher's PLSD tests, as well as t-tests, were used to evaluate the results. Effects were considered to be statistically significant at the 0.05 probability level. If the data did not meet the requirements for parametric analysis, Friedman followed by Wilcoxon tests were used. For some experiments, the analyses were carried out with data normalized to baseline levels.
Results
Cell Proliferation Test
The M213-2O cell line was immortalized with the SV40 large T temperature-sensitive allele tsA58 (20,21). This retrovirus allows the expansion of cells under permissive conditions (33°C), whereas proliferation is reduced at the nonpermissive temperature (39.5°C) (37). As expected, cell proliferation is significantly reduced when the temperature increases from 33°C to 37°C and 39.5°C in cell line M213-2O as well as in cell line M213-2O CL-4 [F(2, 18) = 7.13, p < 0.005, followed by Fisher's PLSD tests] (Fig. 1a). There were no significant differences between cell lines in their response to temperature, and there was no significant interaction.

(a) Percent increase in cell number for clones M213-2O and M213-2O CL-4 after 6 days in vitro, at different incubation temperatures. Cells were plated (900 cells/cm2) and kept at the permissive temperature (33°C), at 37°C, or at the nonpermissive temperature (39.5°C). Forty-eight hours later they were trypsinized and counted to obtain a baseline, then plated again and kept in vitro for four additional days. For both clones there was a significant difference between the permissive and higher temperatures according to Fisher's PLSD test, p < 0.005 (n = 4). *Significantly different from 37°C and 39.5°C. **Significantly different from 37°C and 39.5°C. (b) Uptake of 100 nM [3H]GABA uptake by the M213-2O and M213-2O CL-4 cell lines in basal conditions (black bars) and with 100 μM nipecotic acid (gray bars). [3H]GABA uptake decreased when nipecotic acid was added. *Significantly different from basal levels, p < 0.05 [n = 6]. (c) GAD activity in M213-2O and M213-2O CL-4. *Significantly different from M213-2O [n = 6]. (d) Intracellular GABA content in cell lines M213-2O and M213-2O CL-4, p < 0.05 [n = 3]. *Significantly different from M213-2O, p < 0.05.
At the nonpermissive temperature, the number of viable cells present after the first 48 h in vitro was not statistically different from the number of viable cells present after 144 h in vitro for cell line M213-2O CL-4. In contrast, the number of viable cells for cell line M213-2O showed a significant increase between 48 and 144 h at the nonpermissive temperature [t(6) = 3.07, p < 0.05]. It must be noted that cell line M213 2O showed a threefold increase in cell numbers, at the nonpermissive temperature, whereas at the permissive temperature this cell line showed a sixfold increase in cell number and this difference was statistically different (Fig. 1a).
GABA Uptake
Both cell lines M213-2O and M213-2O CL-4 showed nipecotic acid-sensitive GABA uptake. After being incubated with 100 nM [3H]GABA in the presence or absence of the GABA transporter inhibitor nipecotic acid (100 μM), both cell lines show GABA uptake in control conditions, and nipecotic acid reduced this uptake by 71% in M213-2O [t(10) = 5.02, p < 0.005] and by 41% in M213-2O CL-4 [t(10) = 2.33, p < 0.05] (Fig. 1b). There were no differences between cell lines either in control uptake or in the inhibition by nipecotic acid.
GAD Activity and Intracellular GABA
M213-2O CL-4 also had significantly higher GAD activity; it was more than 15 times (2.17 ± 0.85 nmol 14CO2/h/mg protein) greater than M213-2O {0.13 ± 0.03 nmol 14CO2/h/mg protein [t(10) = 2.39, p < 0.05]} (Fig. 1c). Intracellular GABA was quantified by means of HPLC, which confirmed that M213-2O CL-4 had significantly higher intracellular GABA levels (more than 33 times) (239.68 ± 33.84 μmol/g protein) than M213-2O (7.11 ± 1.05 μmol/g protein) [t(4) = 6.86, p < 0.002] (Fig. 1d).
Morphological Appearance and Protein Expression
Phase contrast examination of cell line M213-2O CL-4 (Fig. 2a) showed multipolar morphology and extended processes. In vitro immunofluorescence revealed that M213-2O CL-4 cells expressed β-tubulin (green) (Fig. 2b), a cytoskeletal protein, and were negative for GFAP and NeuN (data not shown). Immunofluorescence for GAD-67 was evident in M213-2O CL-4 cells (Fig. 2c). Similarly, M213-2O cells showed a multipolar morphology and extended processes (Fig. 2d), and expressed β-tubulin (Fig. 2e), but GAD was not detected in this cell line (Fig. 2f).

M213-2O and M213-2O CL-4 morphology and protein expression at permissive temperature (33°C). Phase contrast that shows M213-2O CL-4 (a) and M213-2O (d) multipolar morphology and extended processes. Scale bars: 50 μm. Indirect immunofluorescence for β-tubulin (green), a cytoskeletal protein, and for Hoechst (blue nuclei) staining in M213-2O (e) and M213-2O CL-4 (b) cells. Indirect immunofluorescence for GAD-67 showing its overexpression in M213-2O CL-4 (c) compared to M213-2O (f) cells. Scale bar: 50 μM. Micrographs of clone M213-2O CL-4 loaded with the flourescent dye Fluo-4, obtained from an epifluorescence video (g–h). Three cells (pink, orange, and blue circles) with epifluorescence activity at two different times, 71.6 s (g) and 101.6 s (h), are shown. Epifluorescence transients (i) from the three cells depicted in (g) and (h). Scale bar: 20 μm.
When loaded with Fluo-4, M213-2O CL-4 cells showed spontaneous calcium transients measured by epifluorescence that can be followed with unicellular resolution. The epifluorescent activity for three cells (pink, orange, and blue circles) is shown at 71.6 s (Fig. 2g) and 101.6 s (Fig. 2h), and their epifluorescence transients are presented in Figure 2i.
Immunocytochemical analysis showed no positive reaction in M213-2O CL-4 cells that were not incubated with the primary antibody (PA-) (Fig. 3a); in contrast, cells that were incubated with the primary antibody against SV40 showed strongly labeled nuclei at 33°C (Fig. 3b), but no positive staining was observed when cells were incubated at 39.5°C (Fig. 3c). Immunocytochemical analysis showed no positive reaction in M213-2O CL-4 cells that were not incubated with EBNA-1, the primary antibody (PA-) (Fig. 3d). EBNA-1-positive staining was observed in cells at the permissive temperature; staining was present both in the cytoplasm, and in the nucleus (Fig. 3e). Electron microscopy showed the presence of a large nucleus, nucleolus, rough endoplasmic reticulum, mitochondria, and intercellular unions in both cell lines (Figs. 3f, g).

Protein expression and electron microscopy of M213-2O and M213-2O CL-4 at permissive temperature (33°C). Immunocytochemistry for SV40 large T antigen used to immortalize both cell lines; M213-2O CL-4 cells without primary antibody (PA-) (a), SV40-positive nuclei at 33°C (b), and negative staining at 39.5°C (c). Scale bar: 100 μm. Indirect immunofluorescence for EBNA-1 when M213-2O CL-4 cells are incubated without (PA-) (d) or with (e) the primary antibody. Scale bar: 100 μm. Electron microscopy of M213-2O (f) and M213-2O CL-4 (g) showing the nuclei (1), nucleolus (2), mitochondria (3), and cisternae of the endoplasmic reticulum (4). Scale bar: 0.5 μm.
M213-2O CL-4 Cells Release GABA in Response to a Depolarizing Stimulus
M213-2O CL-4 cells released GABA in response to several depolarizing conditions, some of which these cells could encounter once transplanted into the brain. For instance, in contrast to its parent clone, M213-2O CL-4 cells released GABA in response to an increase in extracellular K+ concentration. The extracellular GABA concentration increased from 1.35 ± 0.35 μmol/g protein to 4.12 ± 0.37 μmol/g after 15 min of high KCl (50 mM). In contrast, despite the fact that both cell lines have GAD activity and intracellular GABA, the M213-2O cell line did not release GABA in response to high KCl (Fig. 4a). Based on these findings, and on the fact that the antiepileptic properties of transplated M213-2O CL-4 cells are not shared by the parent clone (10,11), we continued working only with M213-2O CL-4. The two-way ANOVA showed a significant effect of interaction (cell line x condition) [F(1, 16) = 22.17, p < 0.01], a significant effect for cell line (parent cell line, and M213-2O CL-4) M213-2O [F(1, 16) = 22.30, p < 0.0001], and a significant effect of condition (baseline, 15 min after KCl) [F(1, 16) = 9.94, p = 0.05]. High K+ activates M213-2O CL-4 cells, as evidenced by an increase in calcium transients produced by individual cells, and leads, in turn, to GABA release (Fig. 4b). In contrast, although basal levels of extracellular glutamate were detected for cell line M213-2O CL-4 (5.66 ± 0.88 μmol/g protein), high K+ stimulation did not increase extracellular levels of glutamate (2.8 ± 0.28 μmol/g protein).
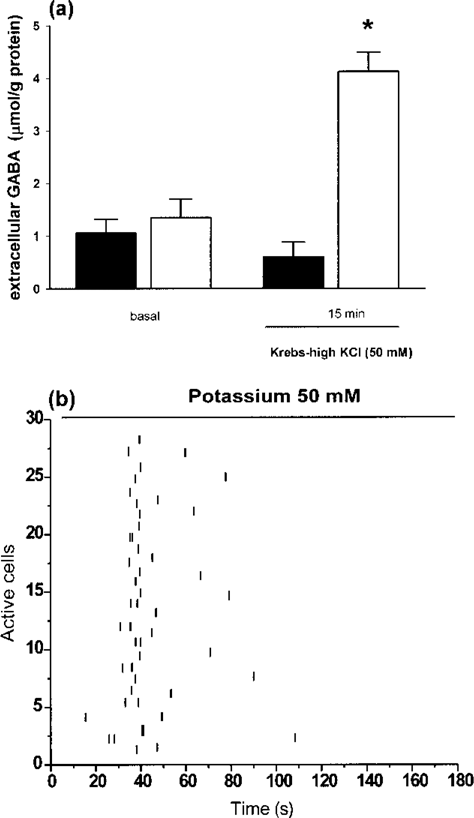
Extracellular GABA levels (mean ± SEM) in cell lines M213-2O and M213-2O CL-4 in response to Krebs-high KCl (50 mM) as percent of basal medium (Krebs-low KCl 4 mM). M213-2O cells were cultured with DMEM/F12 containing 1% penicillin-streptomycin and grown to near confluence in 25-cm2 flasks at 33°C (n = 5). Clone M213-2O CL-4 was cultured with DMEM/F12, 1% penicillin-streptomycin, 200 μl/ml Hygromycin B, and grown to near confluence in 25-cm2 flasks at 33°C. (a) Clone M213-2O (black bars) maintained GABA levels similar to basal levels after exposure to Krebs-high KCl for 15 min. Clone M213-2O CL-4 (white bars) showed significantly higher than basal extracellular GABA levels after 15-min exposure to Krebs-high KCl. *Significantly different from basal condition (Fisher's PLSD test, p < 0.001; n = 5). (b) Transitory cell activation after a Krebs-high KCl (50 mM) pulse. Representative raster plot from clone M213-2O CL-4; each line represents a calcium event.
M213-2O CL-4 Cells Release GABA in a Calcium-Dependent Manner
Spontaneous calcium transients as well as GABA release require calcium influx. As exemplified in Figure 5A, spontaneous calcium transients are completely abolished after calcium channel blockade with 200 μM Cd2+ in all experiments. Figure 5b shows the quantification of all experiments (n = 11) with and without the calcium channel blocker, indicating a clear effect of calcium channel blockade. Thus, GABA release from M213-2O CL-4 cells seems to depend on extracellular calcium.

Clone M213-2O CL-4 has calcium channels that promote calcium influx and induce GABA release. (a) Representative raster plots of clone M213-2O CL-4 showing a decrease in epifluorescence of Fluo-4 after 200 μM cadmium (right panel) was added to the medium compared to the control condition (left panel). (b) Quantification of active cells during the control condition and after cadmium addition showing a statistically significant decrease in the number of active cells (bars represent mean number ± SEM of active cells) [t(10) = 4.23, p < 0.05, n = 11]. (c) GABA release from cell line M213-2O CL-4 after exposure to Krebs-high KCl (50 mM) with or without Ca2+; data were normalized to their respective baseline (Krebs-low KCl, 4 mM). Clone M213-2O CL-4 showed significantly higher extracellular GABA levels at 5–20 min after exposure to Ca2+ Krebs-high KCl, with a peak at 5 min followed by a gradual decrease, compared to Ca2+-free Krebs-high KCl (see text for statistical results). * Significantly different from other time points (Fisher's PLSD test, p < 0.005; n = 6).
M213-2O CL-4 showed significantly higher extracellular GABA levels at 5–20 min after exposure to Ca2+ Krebs-high KCl, with a peak at 5 min (21.03 ± 4.12 μmol/g protein) and a gradual decrease from min 10 onward (10.98 ± 2.80 μmol/g protein; min 15, 8.96 ± 1.90 μmol/g protein; and min 20, 8.17 ± 1.70 μmol/g protein). In contrast, no change in extracellular GABA levels was observed, at any time, upon exposure to Ca2+-free Krebs-high KCl. The two-way ANOVA showed a significant interaction effect [F(3, 30) = 14.51, p < 0.005], a significant effect of Ca2+ Krebs-high KCl versus Ca2+-free Krebs-high KCl solution [F(1, 10) = 19.42, p = 0.05], and a significant effect of time [F(3, 30) = 17.20, p < 0.001]. Figure 5c shows extracellular GABA levels as a percent of baseline, in both conditions: Ca2+ Krebs-high KCl and Ca2+-free Krebs-high KCl.
Glutamate Excites M213-2O CL-4 Cells and Induces GABA Release
For calcium imaging, cells were incubated with 10 μM fluo 4-AM, and short movies (185 s, 40-ms exposure, 4 images per second) were taken at 15-min intervals (Fig. 6a). Most cells responded immediately (15–20 s) after bath application of 100 μM glutamate; in terms of the number of cells that responded, we observed an increase from 2.57 ± 1.28 cells at the moment of application to 8.28 ± 3.13 active cells after 15 min. The greatest number of cells activated by glutamate was observed at 60 min (24.85 ± 13.32 active cells) and came back to basal levels around 120 min after glutamate application (1.71 ± 0.61 active cells). It must be noted that there was a significant effect of time after bath application of glutamate on the number of active cells [Friedman χ2(8) = 20.60, p < 0.01] (Fig. 5b). The inset in Figure 6b shows that glutamate activation of M213-2O CL-4 cells induced GABA release, and this effect was statistically significant (8.53 ± 0.94 μmol GABA/g protein compared to basal levels of 3.56 ± 0.31 μmol GABA/g protein). Similarly, the number of transients per cell (Fig. 6c) increased from 9.8 ± 5.2 at the moment of glutamate application, to 12.80 ± 6.65 transients per cell after 15 min, to 17 ± 7.46 transients per cell after 45 min. After 60 min there was a decrease to 13 ± 3.78 transients per cell, and after 120 min the values returned to control levels (3.8 ± 1.07 transients per cell) (Fig. 6c). Statistically, there was a trend for a significant effect for number of transients per cell [Friedman χ2(9) = 22.33, p = 0.01].

Glutamate induces calcium epifluorescence activity and GABA release in clone M213-2O CL-4. (a) Representative raster plots showing calcium epifluorescence activity of Fluo-4. Basal condition (Krebs-low KCl, 4 mM) (left panel) shows low epifluorescence activity that increases in response to addition of 100 μM glutamate (Glut). Sixty minutes after glutamate addition, cell activity showed the highest response (central panel); activity decreased with time and reached basal levels 120 min after adding glutamate (right panel). (b) Quantification of the number of active cells that showed at least one calcium transient during basal conditions and after adding glutamate. Cell activity increased significantly beginning 15 min after glutamate addition; it reached the highest levels at 60 min, then decreased to basal levels 120 min after glutamate addition. *Significantly different from the moment glutamate was added (min 0) [Wilcoxon z(7) = 2.03, 1.95, p < 0.05, n = 7]. Inset shows extracellular GABA levels for M213-2O CL-4 cells after a 15-min incubation with glutamate. *Significantly different from basal levels [t(10) = 4.67, p < 0.001; n = 11]. (c) Calcium transients per cell during activation induced by glutamate; cellular activity was low during the basal condition and increased after glutamate was added to the medium.
In order to determine which type of glutamate receptors might be involved in cell activation and GABA release, we tested if these effects were blocked by CNQX and CPP, antagonists of the ionotropic glutamate receptors AMPA and NMDA, respectively. The two antagonists were co-applied for 10 min before glutamate, as shown in the raster plots (Fig. 7a). In the presence of CPP and CNQX, glutamate did not induce M213-2O CL-4 cell activation (1 ± 0.65 and 3.22 ± 1.58, before and after glutamate), nor did it increase the number of transients per cell (4 ± 2.40 and 5.56 ± 3.76 before and after glutamate) (Fig. 7b, c). Accordingly, in the presence of CPP and CNQX, glutamate did not induce GABA release (5.74 ± 0.44 and 4.12 ± 0.70 μmol GABA/g protein before and after glutamate) (Fig. 7d).

Pretreatment with glutamate antagonists prevents epifluorescence activity of Fluo-4 and GABA release. (a) Representative raster plots showing calcium epifluorescence activity of Fluo-4. In the presence of 10 μM CPP/CNQX, clone M213-2O CL-4 shows low epifluorescence activity (left panel) that did not increase after glutamate addition (central panel). In order to test for cell viability, high KCl (100 mM) was added to the medium (right panel). (b) The number of active cells in the presence of CPP/CNQX (10 μM) did not increase with glutamate (100 μM), whereas high KCl significantly increased the number of active cells (Fisher's PLSD test; *p < 0.05; n = 9). (c) Calcium transients per cell in the presence of 10 μM CPP/CNQX. There are few transients per cell in the presence of CPP/CNQX and they did not increase when glutamate was added; when potassium was added to the medium at a final concentration of 100 mM, there was a nonsignificant increase in the number of transients per cell. (d) Glutamate did not induce GABA release when CPP/CNQX had been added previously. Bars represent mean ± SEM percent change from basal condition (n = 5).
Because both NMDA and non-NMDA receptors seem to be involved in glutamate-induced M213-2O CL-4 cell activation as well as glutamate-induced GABA release, we activated NMDA receptors independently. NMDA (30 μM) added to the aCSF with 0.5 mM MgCl2 induced significant activation in the cells [t(4) = 3.57, p < 0.05]. Activation of NMDA by eliminating extracellular magnesium (0 Mg2+) significantly increased the number of active cells (18.67 ± 4.56 active cells vs. 1.00 ± 0.26 active cells in control) (Fig. 8a, b) as well as the number of transients per cell (33.00 ± 8.75 transients per cell vs. 2.83 ± 0.83 transients per cell in control) (Fig. 8c). Likewise, GABA release was significantly increased, from 9.90 ± 1.51 to 21.42 ± 1.23 μmol/g protein, by excluding Mg2+ from the solution (Fig. 8d), suggesting the participation of NMDA-like receptors. On the other hand, activation of kainate receptors with kainic acid (400 nM) slightly, but significantly, increased the number of active cells (3.37 ± 1.28 active cells vs. 1.00 ± 0.37 active cells in control) (Fig. 9a, b) but not the number of transients per cell (8.00 ± 3.14 transients per cell vs. 4.85 ± 1.69 transients per cell in control) (Fig. 9c). This small kainate-induced excitation did not result in a significant increase in GABA release (Fig. 9d).

Mg2+-free Krebs solution induces epifluorescence activity of Fluo-4 and GABA release in clone M213-2O CL-4. (a) Representative raster plots of epifluorescent activity of clone M213-2O CL-4 in basal conditions (left panel) and activity induced by eliminating Mg2+ from the medium (right panel). (b) Quantification of the number of active cells in basal conditions and when Mg2+ is absent from the medium. In basal conditions there were few active cells, and this activity increased significantly when Mg2+ was removed from the medium [t(5) = 3.87, p < 0.05, n = 6]. (c) Transients per cell increased significantly when Mg2+ was absent from the medium in comparison with basal levels [t(10) = 3.65, p < 0.05, n = 6]. (d) GABA release increased significantly when incubated with Mg2+-free Krebs solution [t(10) = 5.89, p < 0.001, n = 11]. *Significantly different from basal condition. Bars represent mean ± SEM percent change from basal condition.

Kainic acid induces an increase in epifluorescence activity of Fluo-4, but not in GABA release. (a) Representative raster plots show basal epifluorescence activity (left panel) that increases after 400 nM kainic acid was added to the medium (right panel). (b) There was a significant increase in the number of active cells after kainic acid was added to the medium [t(7) = 3.8, p < 0.05, n = 6]. (c) There were few transients per cell in basal conditions, and there was no significant change after kainic acid was added. (d) Extracellular GABA levels before (basal condition) and 15 min after kainic acid was added to the Krebs solution were not significantly different. Bars represent mean ± SEM percent change from basal condition (n = 6).
Discussion
Transplanted cells can be used for delivery of molecules that prevent the progression of pathologies of the CNS (3,16), or for delivery of neurotransmitters such as dopamine or GABA (12,23), or for neurotrophic factors like GDNF (glial derived-neurotrophic factor) (15). Therefore, it is important to develop transplantable cell lines with properties such as prolonged survival times after grafting, high probability of integration into the circuits of the host brain, and nontumorigenicity. The beneficial effects of transplanted cells are directly related to their capacity to reliably express the proteins of interest and to become integrated with the host brain. As mentioned before, cell line M213-2O CL-4 has been successfully used to prevent seizures in some epilepsy models (10,11). Interestingly, in these models its parent clone produced no beneficial effect (10,11), which suggests that the antiepileptogenic and anticonvulsant effects of cell line M213-2O CL-4 require the expression of glutamate decarboxylase 67, the consequent increase in GABA levels, and possibly its interaction with host circuits (10,11). The functional characterization of this cell line in vitro reported here provides further evidence that this is the case, because cell line M213-2O CL-4 overproduces and releases GABA, and it is activated in response to physiologically relevant stimuli. Additionally, previous studies found no evidence of tumors at 2, 8, and 12 weeks after transplantation of cell line M213-2O CL-4 (10,11,36). In contrast, embryonic stem cells have been shown to develop malignant tumors 3 weeks after transplantation (17).
After a thorough phenotypical characterization of cell lines M213-2O and M213-2O CL-4, we found that M213-2O CL-4 cells, the cell line with antiepileptic properties, can take up GABA, efficiently express GAD activity, and therefore overproduce GABA. Giordano et al. (20) had already demonstrated that cell line M213-2O showed GABA uptake, and now we confirm that the genetically modified M213-2O CL-4 also has this property. As expected, our results indicate that cell line M213-2O CL-4 expresses higher levels of GAD protein and exhibits 16-fold more GAD activity and a 34-fold greater intracellular GABA content than M213-2O. Because cell line M213-2O CL-4 was derived from M213-2O and the only difference is the transfection with a nonviral Epstein-Barr-based episomal plasmid with the hGAD-67 cDNA, these findings strongly indicate that the increased capacity for GABA synthesis is due to the presence of the transgene.
Clone M213-2O CL-4 is one of the higher GABA-producing cell lines reported in the literature; Thompson and Suchomelova (40) described a mouse cortical cell line CN 1.4 that carries the cDNA coding for GAD-65 on a tetracycline-controlled plasmid and synthesizes 4.5 pmol GABA/mg protein. In another study, Thompson found that cell line CN 1.4 releases 30% of its total GABA content after a high K+ stimulus (38). Wang et al. (41) reported on another GABA-producing cell line, RMNE6, established from E13 rat ventral mesencephalon cells, that has 4.13 ± 0.31 μmol/l GABA in the cytoplasm. Cell line M213-2O CL-4 has 239.68 μmol/g protein of intracellular GABA, and after high potassium stimulation it releases 1.7% (4.12 μmol/g protein) of this GABA. In comparison, primary cultures of striatal cells have 37.9 μmol/g protein of intracellular GABA and upon stimulation they release 3% of GABA (1.16 μmol/g protein) (35); this corresponds to 3.5-fold less GABA released than from M213-2O CL-4. These results suggest that, even though M213-2O CL-4 cells release only a minor portion of their GABA content, they still release more GABA than striatal cells. Because M213-2O CL-4 cells express human glutamate decarboxylase (hGAD-67), which can be found in the soma, dendrites, and nerve endings of cells (18), it is possible that some of the synthetized GABA is stored in a nonreleasable pool.
The proliferation of cell lines M213 2O CL-4 and M213-2O is temperature dependent; the percent of viable cells after 6 days in vitro is 700% and 600% above baseline at the permissive temperature, and 200% and 300% above baseline at the nonpermissive temperature, respectively. At the nonpermissive temperature there is no net increase in cell number between 48 h in vitro (baseline) and 6 days in vitro for cell line M213-2O CL-4. Cell line M213-20 does show a threefold increase in cell number between baseline and 6 days in vitro at the nonpermissive temperature. However, as shown in Figure 1a, at the permissive temperature this cell line showed a sixfold increase in cell number. The increase from baseline is significantly greater at the permissive than at the nonpermissive temperature. Thus, it is likely that after a longer period in vitro, the rate of proliferation will slow down, because this cell line has not been reported to result in tumor formation (10,11). Cell line RMNE6 was also immortalized using the temperature-sensitive mutant of the SV40 large antigen, and it shows a fourfold decrease in cell proliferation (raw data) between 33°C and 39.5°C after 6 days in vitro (41), comparable to what we observed with cell line M213-2O CL-4.
Beyond its characterization as a GABAergic cell, it is very important to determine whether or not M213-2O CL-4 cells can be excited and consequently can release GABA in response to external stimuli. In this study we found that M213-2O CL-4 cells were activated and released GABA in response to high potassium stimulation, whereas M213-2O cells did not, perhaps due to their low intracellular GABA content. We also determined that M213-2O CL-4 cells show calcium-dependent GABA release. GABA can be released by an exocytotic, Ca2+-dependent mechanism or through the Na+/GABA cotransporter functioning in reverse, a Na2+-dependent mechanism (35). Based on the fact that high K+-induced GABA release depends on extracellular calcium, we suggest that GABA release from M213-2O CL-4 cells is exocytotic. We also found that calcium transients of M213-2O CL-4 cells require calcium influx through membrane channels, because Cd2+ abolished such activity.
Application of a more physiologically significant stimulus, 100 μM glutamate, resulted in GABA release, and activation of M213-2O CL-4 cells through ionotropic-like glutamate receptors. This activation was maintained throughout 120 min of constant perfusion with glutamate, which may be relevant in the context of cell transplantation in the CNS, and especially in epilepsy. Our findings suggest that, once transplanted, M213-2O CL-4 cells can respond to glutamatergic inputs and, as a consequence, release GABA. It is well known that glutamate is released during epileptic seizures (33,34); usually, this increase in extracellular glutamate has been related to excitotoxicity (33,34). However, in transplanted tissue it is likely that elevated extracellular glutamate would activate M213-2O CL-4 cells and induce GABA release that may contribute to a reduction in seizure activity within the SNr. As stated earlier, the SNr is considered a subcortical region capable of modulating seizure threshold, but it is not fully understood how it may modify cortical activity (28). Our results also show that in spite of a lengthy exposure to high levels of glutamate, these cells are able to regulate calcium levels in the cytosol, possibly through calcium extrusion pathways and mitochondrial sequestration (30).
The activation of M213-2O CL-4 cells upon application of either NMDA in combination with a lower concentration of Mg2+ (0.5 mM) or of a Mg2+-free Krebs solution indicates that these cells express NMDA-like receptors and, furthermore, that activation of such receptors is enough to induce GABA release. This does not seem to be the case for kainate receptors. We found that kainate slightly activates M213-2O CL-4 cells but, in contrast to the other experiments, this activation was not accompanied by an increase in GABA release. Preincubation with AMPA and NMDA antagonists prevented both cell activation and GABA release after glutamate stimulation, further supporting the notion that these cells express AMPA/NMDA-like receptors.
Brain transplants of GABAergic cell lines in different animal models of epilepsy have been shown to decrease the frequency and intensity of seizures (10,11,30,36,37). Taken together, these studies indicate that transplants of GABAergic cells into the nigra may have antiepileptogenic and anticonvulsant effects, as defined by Löscher et al. (29). However, so far it has not been proven, for instance by microdyalysis, that GABA release at the site of the graft is responsible for the functional effects. The results obtained by Thompson (39) using a cell line that produces GABA under the control of doxycycline constitute the strongest evidence yet that changes in GABA levels do underlie the behavioral effects.
Further support for this idea comes from studies using GABA-releasing polymers implanted in the substantia nigra (27). These authors showed that localized, non-synaptic release of GABA in the brain can suppress seizures, at least during the period of high-level GABA release (27). Thus, the functional effects observed after transplants of M213-2O CL-4 cells could very well be explained by the mere release of GABA; however, the present results indicate that GABA release by these cells can be regulated by a physiologically relevant stimulus (i.e., glutamate). Furthermore, these cells are able to show calcium transients that can be evoked in neurons by action potentials, but are also present in glial cells (32). Thus, the kinetics of calcium transients needs to be analyzed in order to determine if M213-2O CL-4 has neuronal characteristics. Further electrophysiological studies would be required to determine if these cells can generate action potentials and thereby contribute to a functional neuronal network in the host brain. The present study is the first systematic characterization of the GABAergic M213-2O CL-4 cell line showing that it responds to an endogenous stimulus and providing a basis to understand the mechanisms underlying functional effects of GABAergic cell transplants.
Lastly, it must be noted that transplants of M213-2O CL-4 cells do not have anticonvulsive effects in all animal models. For instance, when transplanted into Wistar rats, there was a strong immune response around the transplant when the rats were kindled, suggesting that the particular properties of M213-2O CL-4 cells favored rejection, resulting in a lack of functional effect (31). Additionally, in our laboratory, when M213-2O CL-4 cells were transplanted into Genetic Absence Epilepsy Rats from Strasbourg (GAERS), no reduction in absence seizures was observed (11a).
It has been suggested that both the condition of the host and the graft itself may contribute to the immune reaction induced by the transplant (31). With regard to the use of genetically modified tissue for transplantation into the nervous system, it has been proposed that transfection itself may alter the immunogenicity of the tissue such that rejection occurs, requiring continuous immunosuppression (4). If antigens find their way to the surface and can be picked up by the host antigen-presenting cells, an effective immune response can be mounted (4). In the case of M213-2O CL-4 cells, they express at least three proteins that cannot be found in the host tissue, hGAD-67, EBNA-1, and the hygromycin selection marker (31). Although GAD-65 is the isoform considered a major autoantigen in type 1 diabetes, latent autoimmune diabetes of adults, and stiff-person syndrome (SPS) (19), GAD-67 itself is an autoantigen in a fraction of some patients with SPS (7,8). Currently, several groups are studying the structure of GAD in relation to its enzymatic activity and what determines its antigenicity (2). It must be noted that human and rat GAD-67 are 97% identical at the amino acid level (6), making it unlikely that the expression of hGAD-67 is fully responsible for the immune response.
In conclusion the development of transplantable cell lines with desirable properties must take into account several phenotypical characteristics of the cells, including their capacity to respond to external stimuli, to regulate the release of the molecule of interest, to become integrated into a functional circuitry, and to modify brain function; also, they must not be tumorigenic or induce a strong immunogenic response.
Footnotes
Acknowledgments
This work was supported by grants from DGAPA (IN211709) and CONACYT (40161-M, 599187) and a CONACYT fellowship (182421) to J.M. The authors gratefully acknowledge Adriana Gonzalez for HPLC samples analysis, Dorothy Pless, Claudia Castillo, Veronica Rodríguez, Nydia Hernández Rios, Lourdes Palma Tirado, Alfonso Cárabez Trejo, Soledad Mendoza-Trejo, Martín García-Servín, and Anaid Antaramian for technical support and other contributions to this study.