
Abstract
Transplantation of olfactory ensheathing cells (OECs) is a potential treatment for spinal cord injury (SCI). However, this process lacks extracellular matrix guiding cell growth, tissue morphogenesis, and remodeling. In order to solve this problem, we fabricated silk fibroin scaffolds (SFS) with different fiber diameters by electrospinning. The behaviors of OECs on 300 and 1800 nm SFS were studied by analyzing cell morphological feature, distribution, and proliferation. The results showed the 300 nm SFS with good potential to guide OECs growth. Subsequently, the properties of 300 nm SFS were further investigated along with PLL. With 300 nm SFS, the preservation of cell phenotype was confirmed by the presence of cell-specific markers, including nerve growth factor receptor p75 and glial fibrillary acidic protein. And the migration behaviors of OECs were also observed by Leica AF6000. In addition, migration tracks, turning behavior, migration distances, migration speeds, and forward migration indices were calculated. Furthermore, the expression of neurotrophic factors was assayed at transcription and protein levels using RT-PCR and ELISA. All these results indicated the diameter of the fiber played an important role in guiding cell adhesion, growth, and migration in vitro and the 300 nm SFS could be suitable to construct tissue-engineered scaffolds for SCI repair.
Keywords
Introduction
Three major approaches have been used to repair spinal cord injury (SCI), including (a) cell transplantation such as Schwann cells, olfactory ensheathing cells (OECs), and bone marrow stromal stem cells, (b) addition of neurotrophic factors and drugs, and (c) bioscaffolds: biodegradable materials and nonbiodegradable materials. Recently, more attention has been paid to OECs transplantation, which promoted regeneration of the severed nerve fibers and partial functional recovery in animal models (5,11,12). OECs have exceptional plasticity, and can support neurogenesis and enhance axonal regeneration throughout life, which are contributed by the unique aligned neuroglia pathways and, most importantly, the varied molecular signals, including (a) neurotrophic factors such as nerve growth factor (NGF), brain-derived neurotrophic factor (BDNF), glial cell line-derived neurotrophic factor (GDNF), and NT-4/5 (28), (b) extracellular matrix (ECM) molecules such as neural cell adhesion molecule (N-CAM), and (c) other growth factors.
However, lack of cell growth guided by ECM is one of the major mechanisms hampering SCI repair. Biomaterial scaffolds combined with cellular treatment strategies are promising therapy for SCI. Therefore, the development of suitable biocompatible materials is critical. A biodegradable material has good biocompatibility, mechanical strength, and flexibility for spinal cord tissue-engineering demands. In the previously reported biomaterials used for SCI repair, biodegradable natural materials such as plasma (22), collagen (30), fibrin (7), fibronectin (9), alginate/agarose (8,20), chitosan (31), dextran (10), and hyaluronic acid, and synthetic materials such as poly-β-hydroxybutyrate (17), poly(glycolic acid)/poly (lactic acid) (PGA/PLA) (4,15), poly(ethylene glycol)/poly (ethylene oxide)(PEG/PEO) (13), and poly(glycerol sebacate) (PGS) (21) were shown to have more advantages than nonbiodegradable ones such as poly(2-hydroxyethyl methacrylate) or poly(2-hydroxyethyl methacrylate-co-methyl methacrylate) (PHEMA/PHEMA-MMA) (2), and poly[N-(2-hydroxypropyl)methacrylamide] (PHPMA) (27).
In our current study, we selected natural silk fibroin material, which offers unique mechanical properties, excellent biocompatibility, controlled degradability (26), good flexibility, and versatile processability. These properties overcame weakness of other natural products.
In our previous study (19), the biocompatibility of silk fibroin scaffolds (SFS) with OECs had been studied. It was found that the SFS showed good compatibility with OECs. The aim of the present study was to fabricate biodegradable fiber with proper diameter to mimic the structure and biological function of ECM for tissue engineering. Hence, the scaffolds should maintain cell phenotype, support cell growth, and guide cell migration during the culture periods. In addition, the expression of neurotrophic factors on SFS was also studied. The results from this study clearly showed that 300 nm SFS had a high potential to support cell growth, distribution, and migration.
Materials and Methods
Preparation of Spinning Solution
Bombyx mori silk fibroin films were prepared as previously described (36). Briefly, Bombyx mori silk was degummed by 0.5% (w/w) boiled Na2CO3 solution, in order to remove the sericins. Degummed silk was thoroughly washed in deionized water and air dried at room temperature. The fiber was dissolved in LiBr/C2H5OH (40:60, w/w) solutions by heating to 80°C for 60 min. The solution was dialyzed in a cellulose tube (molecular weight cutoff: 8,000–14,000) against deionized water, and aqueous silk fibroin solution was obtained. The solution was poured into a polyethylene dish and dried at room temperature; after this step a dry film was obtained. The film was dissolved in HFIP solutions and then 10% (w/w) spinning solution was obtained.
Electrospinning and Posttreatment
The electrospinning method was performed as in our previous report (32). The electrospun fibers were collected on a collection plate covered with cover slips. The appropriate electric potential, solution flow rate, and the justified distance between the needle tip and the collecting plate were applied. Once the solvent was completely evaporated, the SFS with different fiber diameters formed. The fibers were immersed into 75% (v/v) ethanol/water for 30 min to induce β-sheet conformational transformation and then dried at room temperature. All electrospinning experiments were performed with the same processing conditions.
Scanning Electron Microscopy (SEM)
The morphology and diameters of the electrospun fibers were observed using SEM (Hitachi S-520, Japan); randomly oriented fibers were chosen. The samples were mounted on copperplate and sputter coated with gold layer before observing. The diameters were acquired by selecting 100 measurements randomly from SEM images.
Cell Primary Culture
Primary cultures of OECs were prepared from 120–150 g Sprague-Dawley rats, which were obtained from the experimental animal center at Soochow University. All experimental procedures were carried out in accordance with the regulations for the administration of affairs concerning experimental animals of Soochow University. The method was performed as previously described (16). Briefly, rats were anesthetized and decapitated. Olfactory bulbs were detached and placed in 10 ml of chilled calcium and magnesium-free Hank's balanced salt solution (HBSS). The meninges and blood vessels were removed and the outer two layers of the olfactory bulb were dissected away using dura forceps (Dumon, Switzerland). The tissue was placed in 2 ml of chilled serum-free DMEM/F-12 (Gibco, Grand Island, NY) medium, then dissected, minced, triturated, and trypsinized [0.125% w/v trypsin (Sigma, St. Louis, MO), 8 min, 37°C, 5% CO2]. Trypsinization was stopped using a complete culture medium consisting of DMEM/F-12, with 10% fetal bovine serum (Gibco), 1% glutamine (Sigma), and 2% penicillin-streptomycin (Hayao, China). The tissue was centrifuged at 1,000 rpm for 6 min. After removal of the supernatant, the cells were suspended in culture medium and calculated using the hemocytometer, then by the method of simple modified differential adherence (34): monoplast suspension at 1 × 10⁶/ml was incubated in uncoated 25-cm2 flask (Corning, USA) for 12 h, then the cell suspension was incubated in another uncoated 25-cm2 flask for 24 h. After this step, the cell suspension was cultured on a flask coated with poly-l-lysine (PLL, Sigma) and maintained in a humidified incubator at 37°C and 5% CO2. The medium was replaced every 3 days during the culture.
Cell Seeding and Culture
After 10 days in culture, OECs were used to evaluate the capability of SFS for supporting cell growth. The OECs were trypsinized (0.125% trypsin), centrifuged, and resuspended. Then the OECs were seeded at a density of 1.0 × 10⁵ cells on the prewetted 300 nm, 1800 nm SFS and PLL-coated cover slips in 35-mm petri dishes, respectively. The scaffolds were each incubated in 1 ml of complete culture medium at 37°C, 30 min before cell culture. One milliliter of cell suspension was placed in each dish (only on the scaffolds) and 1 ml culture medium was added after 4 h in culture; afterward the culture medium was changed every 3 days over 14 days for OECs. At the same time, cells were observed using inverted phase contrast microscope every day.
Cell Proliferation Assay
The proliferation (96 wells) of OECs on 300 and 1800 nm SFS and PLL was examined by MTT at days 1, 4, 7, 10, and 14. Seeding density at 1 × 10⁴ cells/well on 96-well microtiter plates was used. During the same period, a volume of 20 μl MTT (Sigma) dissolved in PBS at 5 mg/ml was added to each well to continue incubation at 37°C for 4 h. And then 200 μl DMSO (Sigma) was added to each well to dissolve the dark blue crystals. The absorbance was measured at 490 nm with a reference wavelength of 570 nm in a microplate reader (Bio-Rad, USA). Cell number was correlated to optical density (OD).
Cell Immunostaining
After 4 days in culture, the OECs on 300 nm and PLL were confirmed by cell immunostaining. Cells were fixed for 30 min at room temperature with 4% paraformaldehyde and blocked for 30 min in PBS containing 3% BSA, 0.2% Triton X-100, and 0.02% NaN3 (v/v). Cells were incubated with rabbit polyclonal antibody NGFR p75 (Boster, China) diluted 1:200 in PBS at 4°C overnight. After three washes with PBS, cells were incubated with FITC-conjugated goat anti-rabbit IgG (Boster) secondary antibodies diluted 1:70 in PBS for 1 h at room temperature. After another washing with PBS three times, cells were incubated with mouse monoclonal antibody GFAP (Chemicon, USA) diluted 1:1000 in PBS for 2 h at room temperature. Finally, cells were washed three times with PBS and incubated with Cy3-conjugated goat anti-mouse IgG (Boster) secondary antibodies diluted 1:50 in PBS for 1 h at room temperature. Then cell nuclei were stained with Hoechst 33258 (Sigma) diluted 1:100 in PBS. Cover slips were washed and mounted with 50% glycerin in PBS before imaging (fluorescence microscope AF6000, Leica, Germany).
Cell Migration Analysis
The migration of OECs on 300 nm and PLL was observed using Leica AF6000. The method was followed as previously described (33). Briefly, a period of 400 min was chosen to assess cell migration. The migration regions were chosen randomly and images were recorded every 5 min. Then the cell migration behaviors, including migration tracks, turning behavior, migration distances, migration speeds, and forward migration index (FMI = net distance of the cell migration/the total path length) were calculated during the observing period.
RT-PCR Analysis
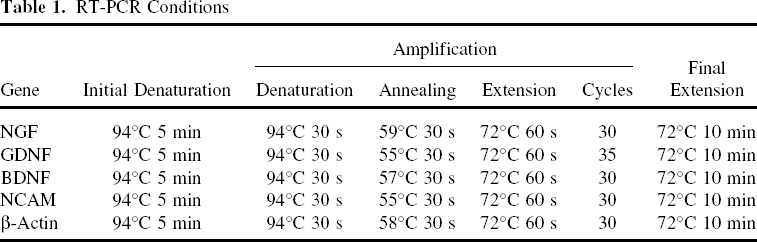
Total RNA was isolated from cells using a total RNA kit (OMEGA, biotek, USA) following the supplier's instructions. Briefly, OECs cultured on 300 nm SFS and PLL for 4 days were washed twice by PBS and harvested by trypsinization, then transferred into 2-ml Eppendorf tubes. The tubes were centrifuged at 15,000 x g for 5 min. The supernatants were removed before the pellets were lysed in 350 μl TRK Lysis Buffer with 2% β-mercaptoethanol (β-ME). The supernatants of lysates after centrifugation were collected with a 2-ml Eppendorf tubes and 350 μl of 70% ethanol (v/v) was added to the supernatants. Then a Hibind RNA minicolumn was applied to centrifuge, digest (DNase I), wash (RNA Wash Buffer I and II, respectively), and elute RNA. cDNA synthesis and PCR amplification were performed as the following procedures. For reverse transcription, 4 μl of total cellular RNA was used as templates in a 10-μl reaction containing 0.5 μl dNTP (10 mM), 1 μl Oligo dT (50 μM), and 0.25 μl RTase M-MLV (200 U/μl) (TaKaRa, China). The reaction was performed at 42°C for 1 h, 72°C for 15 min. PCR amplification, 2 μl cDNA was used as a template with the appropriate primers, and PCR conditions were as follow: 94°C for 5 min; 30–35 cycles of 94°C for 30 s, 55–59°C (depending on primers used) for 30 s, and 72°C for 60 s; 72°C for 10 min (Table 1). β-Actin mRNA served as an internal control. PCR products were visualized on 1% agarose gels stained with ethidium bromide. The primers were synthesized at Sangon Company (Shanghai, China) (Table 2).
RT-PCR Conditions
Sequences of Primers Designed and Used for RT-PCR Experiments

ELISA Analysis
OEC culture mediums were collected for analysis of neurotrophic factors. NGF-β, GDNF, and BDNF levels in culture mediums secreted by OECs on 300 nm SFS and PLL were determined using ELISA Kits (Boster). The assays were performed following the manufacturer's instructions. Briefly, standard and test samples (4-days culture medium) were incubated for 90 min at 37°C in 96-well plates. The detection systems included biotinylated anti-NGF-β, BDNF monoclonal antibodies, and GDNF polyclonal antibody detected with streptavidin-HRP conjugate solutions (ABC). The chromogenic substrate solutions of tetramethyl benzidine (TMB chromogenic buffer) were added to the plates and the reaction stopped by adding TMB stop buffer. The colors were measured at 450 nm in a microplate reader (BioRad). Standard curves were generated using known amounts of the growth factors and samples diluents were used as a control. The standard curves for NGF-β, GDNF, and BDNF provided linear plots of absorbance versus concentration. The linear plots were used to determine the concentration of NGF-β, GDNF, and BDNF in the test samples. All experiments were performed in triplicate.
Statistical Analysis
All the values (proliferation, migration, gene and protein quantification) were expressed as mean ± SD. One-way ANOVA followed by Student-Newman-Keuls test was used to analyze the data. A value of p < 0.05 was considered as significant difference.
Results
Morphology of SFS
The morphology and diameters of SFS were shown in Figure 1. The SEM micrographs showed that the fibers had a smooth surface with voids among the fibers, interconnecting a porous network, and constituted a fibriform three-dimensional structure (Fig. 1A, B). As shown in Figure 1C, the fibrous scaffolds consisted of randomly oriented fibers with diameters ranging from 140 to 560 nm and the average fiber diameter was about 287 ± 7 nm. Figure 1D showed that the average fiber diameter was about 1,799 ± 308 nm with the diameters ranging from 1,556 to 3,337 nm.

SEM images of silk fibroin scaffolds (A, B). Scale bar: 5 μm. Histograms of silk fibroin scaffolds' fiber diameters (C, D).
Cell Morphology
The morphology of primary OECs was described in our previous report (3). Significant changes of cell morphology in culture were observed on PLL. OECs displayed random orientation with various shape after 24 h in culture. On day 4, with the elongation and spreading of OECs, the cells started to cluster and change to bipolar or tripolar shape, and spindle-shaped cell bodies were evident (Fig. 2A). On day 7, cell protrusions became long and thin, and formed a complex network. The morphology of passage OECs on SFS was more complicated than that on PLL. On 300 nm SFS, cells mainly displayed bipolar shape which aligned along the fibers after 4 days in culture (Fig. 2B), while on 1800 nm SFS cells showed random orientation with varies shapes after 4 days in culture (Fig. 2C). On day 7, more cell protrusions formed and partly contacted to the fibers. After day 14, no cell aging phenomenon was observed on SFS.

Phase-contrast images of OECs after 4-day culture on PLL (A), 300 nm silk fibroin scaffolds (C), and 1800 nm silk fibroin scaffolds (E). Hoechst 33258 staining of OECs after 4-day culture on PLL (B), 300 nm silk fibroin scaffolds (D), and 1800 nm silk fibroin scaffolds (F). Scale bars: 250 μm.
Cell Proliferation
Proliferation activity of OECs at day 1, 4, 7, 10, and 14 was examined by MTT. A significant increase in cell proliferation was observed in 7 days and steady growth was observed after day 7. Maximum proliferation was reached over 14 days and more than a twofold increase was observed on day 14 compared to day 1. The differences of OD values between cells cultured on 1800 nm SFS and on PLL were significant at day 4, 7, and 10 (p < 0.01). However, similar proliferation activities of OECs were maintained on 300 nm SFS and PLL at day 1, 7, 10, and 14 (Fig. 3).

Results of proliferation activity by MTT assay. The OD values on PLL were significantly higher than that on 1800 nm SFS at day 4, 7, and 10 (**p < 0.01). The OD values between 300 nm SFS and PLL were significantly different at day 4 (*p < 0.05).
Cell Phenotypes
In order to determine if OECs still retain their phenotypes when cultured on 300 nm SFS, characteristic protein markers for OECs (NGFR p75/GFAP) were studied by immunocytochemistry. Fluorescence microscopy showed that OECs on 300 nm SFS still stained positively for NGFR p75/GFAP (Fig. 4D–G) compared to that on PLL (Fig. 4A–C), indicating that cells on 300 nm SFS maintained the OECs characteristic phenotype.

Immunocytochemistry staining of OECs with anti-NGFR p75 (green), GFAP (red), and Hoechst 33258 (blue) after 4 days in culture. A typical area of OECs cultured on PLL stained with NGFR p75 (A), GFAP (B), or merged NGFR p75 and GFAP staining (C), counterstained with Hoechst 33258. OECs cultured on 300 nm SFS stained with NGFR p75 (D) and GFAP (E) or merged NGFR p75 and GFAP staining (F, G), counterstained with Hoechst 33258. Scale bars: 50 μm.
Cell Migration
In order to observe the migration of OECs, cells in 6–24-h culture periods were chosen because the early migration of OECs played an important role in the cell distribution. Cell locomotion was monitored directly by Leica AF6000. These observations were confirmed by the examination of individual cell tracks. Each point represents the final positions of the cells at the recording points where the starting point of migration is fixed at the intersection of the x and y axes. OECs on PLL made random turns during migration (Fig. 5A, B), while cells migrated along the fibers on 300 nm SFS (Fig. 5C, D). The graphs showed that the migration tracks of OECs on 300 nm SFS were straighter than that on PLL. To measure the efficiency of cell movement, cell migration distance was calculated for each time-lapse interval and the total path length was derived for a period of 400 min. Then the net distance, speed, and FMI values were also calculated. These quantitative analyses revealed that there were no significant difference on the distance, speed, and FMI values of OECs between cells cultured on 300 nm SFS and those normally cultured on PLL (Fig. 5E).
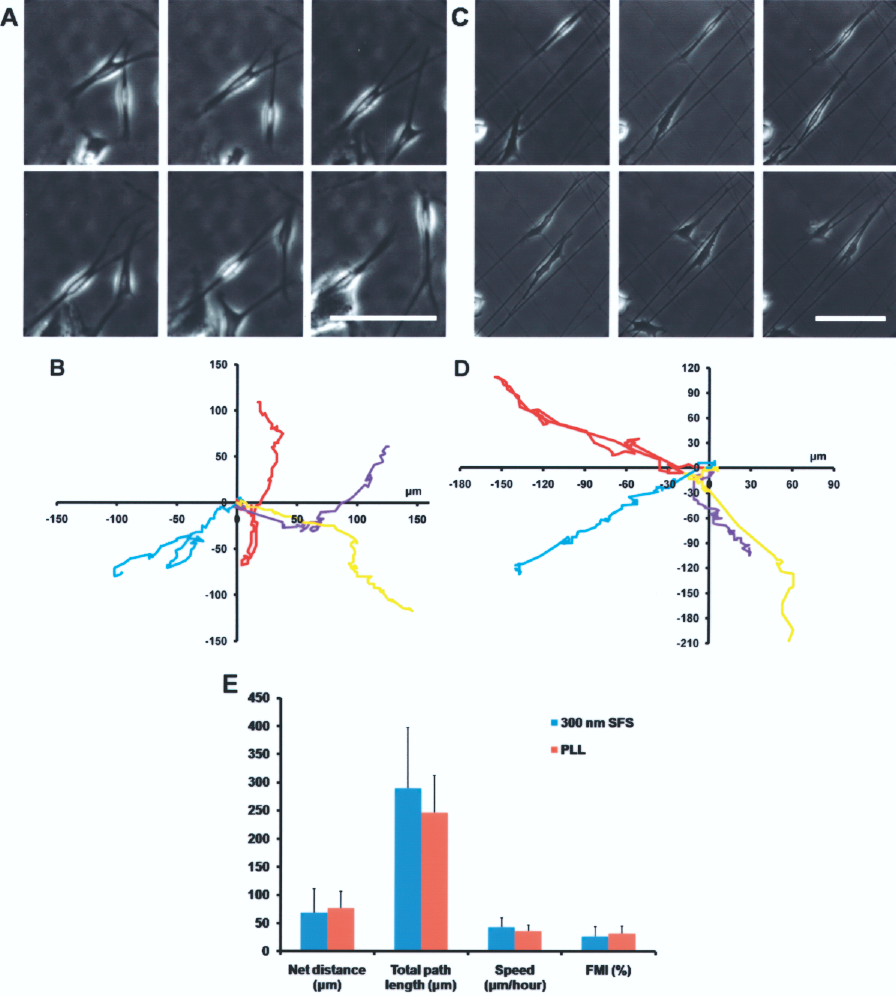
Migration tracks of OECs. Phase-contrast images showing two representative cells migrating on PLL (A). Migration tracks of four representative cells on PLL (B). Phase-contrast images showing two representative cells on 300 nm SFS (C). Migration tracks of four representative cells on 300 nm SFS (D). Scale bars: 100 μm. Histograms of cell net distance, total path length, speed, and FMI values on PLL and 300 nm SFS (E).
Cell Gene Expression
The expressions of neurotrophic factors (NGF, GDNF, and BDNF) and extracellular matrix molecules (N-CAM) at the mRNA level were examined using RT-PCR. The semiquantitative RT-PCR analysis indicated that transcript expressions of BDNF and N-CAM on 300 nm SFS did not change significantly compared to that on PLL after 4 days in culture. The expressions of NGF and GDNF were significant higher in OECs cultured on 300 nm SFS than on PLL. The results indicated that the 300 nm SFS promoted the expressions of NGF and GDNF genes (Fig. 6B).

Semiquantitative RT-PCR and densitometric analysis. Transcript levels of NGF, GDNF, BDNF, and N-CAM for OECs cultured on PLL and 300 nm SFS at day 4 were analyzed by RT-RCR and normalized by β-actin. RT-PCR gel images (A). Band density measurement results of the gene and β-actin gene used for a control (B). Expressions of NGF and GDNF mRNA of OECs cultured on 300 nm SFS were significantly increased compared to those on PLL (**p < 0.01).
Cell Protein Expression
The levels of neurotrophic factors in the culture mediums secreted by OECs were analyzed by ELISA. The results of the quantification showed that NGF-β, GDNF, and BDNF secreted by OECs in the culture mediums were in close range between 300 nm SFS and PLL, respectively. The amount of GDNF was at a lower level, in accordance with the mRNA expression results. The statistical analyses indicated that there was no significant difference at the levels of neurotrophic factors in the culture mediums secreted by OECs between cells cultured on 300 nm SFS and on PLL (Fig. 7).

Quantification of neurotrophic factors using ELISA analysis. Histograms of NGF, GDNF, and BDNF levels in culture mediums secreted by OECs after 4 days in culture. There was no significance difference at NGF, GDNF, and BDNF levers between 300 nm SFS and PLL.
Discussion
In this study, we fabricated SFS using electrospinning technique, which significantly improved the properties of the silk fibroin, providing fibers with narrow range in diameter (either nano- or micrometer) and 3D puffy structures (Fig. 1A, B). As also demonstrated in this study, these unique features facilitated OECs growth that could not be accomplished by other materials. The fibers with small diameter (300 nm, in our current study) are relatively close to the native fibrils of the ECM. In addition, natural silk fibroin proteins, composed of 18 natural amino acids, are biodegradable and biocompatible with ECM. Hence, natural silk fibroin clearly possesses greater advantages over other well-studied nonbiodegradable materials in SCI repair. On the other hand, the silk fibroin was reported to be suitable for fibroblasts (14), human bone marrow stromal cells (6), Schwann cells (29), hippocampal neurons (23), chondrocytes (25), osteoblast, epithelia,l and endothelial cells (1,24) adhesion, growth, and proliferation. Our earlier results also proved that these fibers were biocompatible with other cells (unpublished data). Based on these reasons, we fabricated electrospun nanofibers (300 nm in diameter) of silk fibroin to mimic the structure and biological function of the ECM.
Results from our current study clearly demonstrated that there were strong interactions between fibers and OECs. Cells were found to be aligned very well on 300 nm SFS, while they were randomly distributed on 1800 nm SFS. This finding indicated that the thin fibers (300 nm in diameter) played an important role in cell alignment, while fat fibers (1800 nm in diameter) might have less control in cell alignment. Many studies have shown cell alignment occurring on only aligned nanofibers (18). However, in our study, a surprisingly good alignment of OECs was observed on the randomly oriented 300 nm SFS (Fig. 2C, D). This characteristic distribution of OECs on 300 nm SFS could be contributed to the “hill and valley” phenomenon discovered by others (35). By far, we have not been able to pinpoint the specific guidance mechanisms and biochemical interactions between 300 nm SFS and OECs.
On the other hand, another intriguing observation was that the migration of OECs on 300 nm SFS was guided by the nanofibers. The migration tracks of OECs on 300 nm SFS were along the nanofibers, rather than the original alignment direction as we would have expected. Hence, if the direction of nanofibers could be precisely controlled (i.e., the alignment of OECs and the migration tracks could be in the similar or even same direction) that would be truly valuable for SCI repair, because one key factor in the failure of axonal regeneration is the loss of the aligned neuroglia pathways guiding cell growth and migration. Thus, we have planned to fabricate SFS with appropriate diameters integrated with OECs to construct aligned neuroglia pathways for the regeneration of severed axons. It is reasonable to expect that engineered silk fibroin nanofiber 3D scaffolds could have good application in SCI repair.
In summary, the electrospun SFS have shown good biocompatibility with OECs. The 300 nm SFS could be suitable for OECs adhesion, growth, proliferation, and migration. On the other hand, this material did not have any negative influence on expression of neurotrophic factors at gene and protein level. Therefore, the 300 nm SFS integrated with OECs have good potential for nerve tissue regeneration, and it may provide a better approach for SCI treatment. Further study is under way. We will report those results in due course.
Footnotes
Acknowledgments
This work was funded by health department scientific research projects of Jiangsu Province (H200920), and Science & Research Innovation Plan of Post-graduates in Colleges and Universities of Jiangsu Province (ZY320717), and supported by Jiangsu Province Key Laboratory of Stem Cell Research. We thank Dan Wang, Dan Wu, and Junke Zhang for help in discussions. We also thank Dr. Guoxia Han for proofreading the manuscript and providing his insights.