
Abstract
The subtle effects of transplanted bone marrow cells (BMC) on regional myocardial behavior in patients with ischemic heart disease are difficult to assess. Novel echocardiographic techniques can quantify regional myocardial deformation (strain) and distinguish between passive and active wall motion. We hypothesized that this technique may help delineate cell therapy-induced changes in regional LV contractility that escape clinical routine studies. Twelve patients with coronary artery disease and impaired LV function (LVEF &<35%) underwent CABG surgery plus intramyocardial injection of autologous bone marrow mononuclear cells. Between two and five predefined segments of ischemic myocardium per patient received BMCs, and untreated ischemic segments served as internal controls. Segmental echocardiographic analysis of peak systolic strain by speckle tracking was performed before and 1 year after surgery and compared with standard wall motion analysis. Two patients died during the follow-up period. In the remaining 10 patients, mean LVEF increased from 24.5 ± 10% to 32.1 ± 11% (p = 0.02). A moderate improvement of systolic function was noted in ischemic control segments by both wall motion score (WMS) and 2D strain echocardiography (2DSE). In BMC-treated segments, WMS improved slightly, but the data failed to reach statistical significance. As assessed by 2DSE, however, systolic function of BMC-treated segments improved by nearly 100%. 2DSE proved to detect BMC-induced change with 30-fold higher sensitivity than WMS, and the Receiver Operating Characteristic curve (ROC) confirmed the diagnostic precision of 2DSE (area-under-the-ROC = 0.87). We conclude that echocardiographic speckle tracking two-dimensional strain analysis can detect cell therapy-induced changes in regional contractile function that may escape detection by standard wall motion assessment. Thus, 2DSE may be a useful tool for the further development of clinical cardiac cell therapy.
Introduction
Clinical cell therapy for treatment of heart disease is currently viewed with reluctance, because its effect on standard parameters of left ventricular contractility is moderate or even undetectable. The opponents of cardiac cell therapy in its present form (mainly relying on marrow-derived adult progenitor cells) may argue that the concept is not worthwhile pursuing if a striking impact on global heart function cannot be achieved. On the other hand, it may well be that cell therapy has beneficial effects on local myocardial structure and function that escape the routinely used outcome measurements. Magnetic resonance imaging (MRI) and echocardiography are predominantly morphologic measurements of wall motion and thickening, and cannot distinguish between active and passive inward motion of the myocardium. MRI, especially in combination with tissue tagging, is considered the gold standard for assessment of global and regional left ventricular contractility (9), but it is difficult if not impossible in patients who have implants such as pacemakers or implantable defibrillators (ICDs). Here, Doppler-based echocardiographic myocardial velocity and strain analyses have been suggested to give more detailed quantitative information on regional myocardial function (14). Compared to myocardial velocity measurements, major advantages of strain analysis are the possibility of differentiating between motion (movement of an object) and deformation (shape change of an object) and the uniformity of measurements throughout the normal LV myocardium (4). However, an important limitation of Doppler-derived strain is the considerable angle dependency. A newer method for strain calculation utilizes high-quality 2D images and analyzes the movement of stable acoustic markers (speckles) between frames, thus rendering determination of strain independent of the Doppler technique (5). Therefore, we have performed a clinical pilot study to test the hypothesis that echocardiographic strain analysis with speckle tracking helps delineate cell therapy-induced changes in regional LV contractility that may otherwise be overlooked.
Materials and Methods
The study was approved by the local ethics committee and conforms to the principles outlined in the Declaration of Helsinki. All patients gave informed consent.
Twelve patients with chronic ischemic heart disease and impaired left ventricular function [left ventricular ejection fraction (LVEF) <35%] who were scheduled for elective coronary artery bypass (CABG) surgery were enrolled in the study. All patients had a history of myocardial infarction and suffered from dyspnoea and/or angina. Care was taken not to include patients with more recent (<weeks) myocardial infarction, because those are known to undergo significant spontaneous remodeling processes. All but one patient were male and the average patient age was 64 ± 9 years.
Cell Preparation
Bone marrow aspiration was performed in local anesthesia several hours prior to the operation, either in the morning when surgery was scheduled for the afternoon, or on the previous day when surgery was scheduled for the next morning. On average, 70 ml of marrow was collected in heparinized syringes (range 60–100 ml). The marrow was taken to the hematology clean room facility on campus, where a mononuclear cell product was prepared by Ficoll density centrifugation. Cells were resuspended in 8 ml autologous serum and filled in standard insulin syringes. When overnight storage was necessary, this was done at 4°C. Cells were not labeled for detection in vivo or on histology. Quality control measurements included sterility and viability testing as well as FACS analysis with labeling of CD45 and CD34.
Surgery
The heart was accessed via a median sternotomy and the left internal thoracic artery (ITA) and greater saphenous vein were harvested. All patients were placed on cardiopulmonary bypass. After cross-clamping of the ascending aorta cardiac arrest was initiated with warm blood cardioplegia. Saphenous vein grafts were implanted to the right and/or circumflex artery system, and the ITA was anastomosed to the left anterior descending artery (LAD) in all patients. Prior to release of the aortic cross-clamp, 24 intramyocardial injections of cell suspension were performed in the ischemic area of interest that had previously been defined based on the echocardiography data. The goal was to create three groups of myocardial segments per patient: i) noninfarcted segments with normal wall thickness, with or without impaired wall motion; ii) segments of infarcted myocardium (proximal coronary artery stenosis or occlusion, thinned wall, impaired wall motion) that received no cell injection; iii) segments of infarcted myocardium that were treated with bone marrow cells. A minimum of two segments and a maximum of five segments per patient were treated by cell injection (mean 3.1 ± 1.1 segments), and between 8 and 15 segments per patients were defined as ischemic control segments (mean 12.3 ± 2.2 segments). Once the CABG operation was completed, patients were transferred to the ICU. When hemodynamics had stabilized and catecholamine support was weaned, patients were transferred to the normal ward.
Echocardiography
Echocardiography was performed using a Vivid Seven digital ultrasound system (General Electrics, Horton, Norway). LV end-systolic and end-diastolic volume was determined by manual tracing of end-systolic and end-diastolic endocardial borders using apical four chamber (4C) and apical two chamber (2C) views, employing the biplane Simpson method. Ejection fraction (EF) was calculated as follows: EF(%)= (EDV – ESV)/EDV × 100, where EDV is the end-diastolic volume and ESV is end-systolic volume.
End-diastole was defined by the ECG R-wave. End-systole was defined as aortic valve closure in the apical long axis view (Lax). The time difference between the ECG QRS complex and aortic valve closure was measured by the software and used as marker for systole. Subsequently, this time interval was used to denote the duration of systole in other echo views (4C and 2C) that did not show the aortic valve. The 2D sector image was optimized to allow visibility of the walls during the whole cardiac cycle. Strain analysis of the 2D echocardiography images was performed off-line on a personal computer with the aid of a customized software package (EchoPAC, General Electrics, Horton, Norway) using two consecutive cardiac cycles of acquired loops. This system allows analysis of peak systolic longitudinal strain based on detection of natural acoustic markers within the myocardium and an algorithm, which follows the acoustic markers accurately during several consecutive frames (2). It is assumed that the natural acoustic markers change their position from frame to frame in accordance with the surrounding tissue motion. The geometric shift of each speckle represents local tissue movement. To assess regional LV strain, a region of interest was drawn manually at the endocardial–cavity boundary on a single frame at end-systole. The speckle tracking software then automatically created a second larger region at the epicardial level, so that the region of interest spans the LV myocardium. The system calculates the average of many individual strain values within each region of interest, resulting in instantaneous strain curves for whole predefined LV segments. The maximum of strain during systole was used to denote peak systolic strain.
Peak systolic longitudinal strain, a parameter of longitudinal shortening (from basal to apical segments), relates to longitudinal LV function and depends on function of longitudinal myocardial fibers. The LV walls in the 4C, 2C, and Lax views were divided into lateral, septal, anterior, inferior, anteroseptal, and posterior walls, which were additionally subdivided into basal, mid, and apical segments to obtain regional quantitative function parameters from a total of 18 distinct segments in each patient. Strain is dimensionless and is expressed as the percent change from the original dimension, calculated using the following equation: S(%) = (L – L0)/L0 × 100, where L is the instantaneous segment length measured at end-systole and L0 is the segment length at time t0 (i.e., at end-diastole). In normal myocardium, longitudinal shortening results in a negative strain value of approximately –18%. In ischemic and infarcted segments the baseline strain values vary considerably, so that we chose to express the data as the percent change in strain over the follow-up period.
Prior to strain calculation, the 18 myocardial wall segments as defined above were analyzed visually and scored on the basis of their inward motion and systolic thickening. Segmental LV systolic function was evaluated using a scoring system as follows: 1 = normal (>30% thickening in systole), 2 = hypokinetic (<30% thickening), 3 = akinetic (absence of wall thickening), 4 = dyskinetic (outward motion of the segment in systole).
Statistics
Data are expressed as mean ± SD or as median and interquartile range (IQR). Strain data are expressed as the percent change in strain (∊) between preoperatively and 1 year postoperatively in a given myocardial segment. Normal distribution of individual datasets was tested by the Shapiro-Wilk test (Analyze-it® for MS Excel). For further analysis, the SPSS® 10.1 software package was used. LV dimension data (LVEF, LVEDV, LVESV) fitted a normal distribution, and pre- and post- operative values were compared using paired Student's t-test (two-tailed). Longitudinal strain data did not fit a normal distribution, and data were compared using nonparametric tests (Mann-Whitney U-test for independent samples, and Wilcoxon's signed rank test for related data such as pre- and postoperative LS). To demonstrate the relationship between wall motion score (WMS) and 2D strain echocardiography (2DSE), strain change data were grouped according to the observed change in WMS in a given segment. Here, both ANOVA (parametric) and the Kruskal-Wallis test (nonparametric) were applied to test the overall significance. To test the precision of 2DSE for detection of BMC-induced changes in contractility, a Receiver Operating Characteristic curve (ROC) was constructed using SPSS® and the area-under-the ROC (AUROC) was computed.
Results
Cell Product
All cell products met the release criteria in terms of bacterial contamination, viability, and stem cell content. Serologic studies indicated previous Ebstein Barr virus infection in three patients. These were not considered exclusion criteria and had no impact on patient survival. The median total nucleated cell count in the crude marrow preparation was 177 × 107 (range 89–291 × 107), and the median mononuclear cell count in the final product was 28 × 107 (range 12.5–70 × 107). Of those, 5.4 × 10⁶ (range 2.1–10 × 106) cells were CD34+ by FACS analysis. There was no evident association between the total or CD34+ cell count and the patients' age or severity of disease.
Surgery
An average of three bypass grafts (range two to four grafts) per patient were implanted. Complete revascularization was achieved in all patients (i.e., all three major coronary artery branches were bypassed provided they had a >50% stenosis). In one patient with grade III mitral incompetence, mitral valve repair was required; in another patient with grade III tricuspid incompetence and persistent foramen ovale, concomitant tricuspid valve repair and closure of the oval foramen was performed. Cell suspension was injected into the anteriorlateral segments of the LV free wall in five patients, and into the posterior/inferior ventricular wall in seven patients. Segments within the interventricular septum were not treated with BMC. All patients received inotrope infusion for up to 5 days (median 1 day). Intra-aortic balloon pump support was necessary in two patients for 1 and 3 days, respectively. Patients were weaned off mechanical ventilation after an average of 1 day (range 0–14), and the average ICU stay was 1.5 days (1–18 days).
In seven patients, no major complication occurred during the 1-year follow-up period. One patient developed a deep sternal wound infection, and was treated using a vacuum-assisted closure system and subsequent pectoral muscle plasty. Two patients had an episode of ventricular tachycardia that was terminated by electro-conversion and antiarrhythmic medication. In one of these patients, thromboembolic occlusion of the right radial artery occurred and was treated surgically, the other patient developed chronic renal failure requiring dialysis beginning 6 months postoperatively. Two other patients developed recurrent heart failure and died during follow-up; one patient on postoperative day 48, and the other patient 5 months after the operation.
Echocardiography Data
All surviving patients underwent echocardiographic follow-up examination. Over the 1-year follow-up period, LVEF rose from 24 ± 9% to 32 ± 10% (p = 0.02) as determined by the biplane Simpson method. Preoperatively, median LVEDV was 170 ± 63 ml, and LVESV was 121 ± 61 ml, and were not significantly different at follow-up (Fig. 1).

Left ventricular (LV) dimensions preoperatively (pre) and 1 year after (post) CABG surgery and intramyocardial bone marrow cell implantation. (A) Left ventricular ejection fraction (LVEF) improved significantly, while (B) end-diastolic (LVEDV) and (C) end-systolic volume (LVESV) remained essentially unchanged. The box plots show median (solid bar), mean (white dot), first and third quartile (box), and range (whiskers).
Overall, WMS improved by approximately 0.5 score points (Fig. 2). The improvement in WMS effect was slightly less pronounced but still statistically significant in ischemic control segments that underwent revascularization but no BMC implantation. In BMC-treated segments, however, the median WMS improved by >1 score point, but due to the higher variability of the data, the statistical significance level was not reached.

Wall motion score (WMS) before (pre) and 1 year after (post) CABG surgery and intramyocardial BMC injection. When all segments are taken together (all segments), median WMS improved significantly by approximately 0.5 score points. The improvement in WMS was less pronounced but still statistically significant in infarcted control segments that underwent revascularization but no BMC implantation. In BMC-treated segments, median WMS improved by >1 score point, but due to the higher variability of the data, the statistical significance level was not reached. The box plots show median (solid bar), mean (white dot), first and third quartile (box), and range (whiskers).
Representative images depicting segmental longitudinal strain data in one of our patients before and 1 year after surgery are shown in Figure 3. Overall, speckle tracking strain analysis produced similar qualitative results as WMS with respect to the change in contractile function when all segments are taken together. The median longitudinal strain change was approximately 45% (IQR 21–94%) (Fig. 4). In infarcted control segments that underwent revascularization but no BMC implantation, strain change was 40% (IQR 19–80%). In BMC-treated segments, however, the change in longitudinal strain was much more pronounced, with a median of 93% (IQR 48–243%, p = 0.002 compared with control segments).

Bulls-eye image of peak systolic longitudinal strain in a patient before (A) and 1 year after (B) CABG and intramyocardial bone marrow cell implantation in anterolateral segments. Note that normal values of longitudinal strain are negative because of systolic shortening in long axis. Normal values for longitudinal strain are −18 ± 6 % (4).
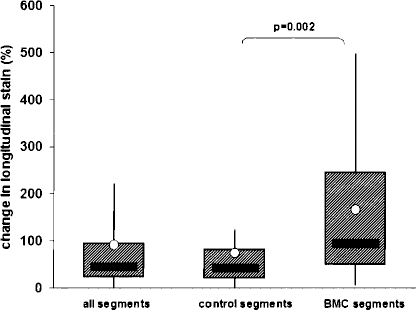
Change in segmental longitudinal strain 1 year after CABG surgery and intramyocardial BMC injection, compared to the preoperative studies and expressed in percent. When all segments are taken together (all segments), median strain change is approximately 40%, and the data are similar for infarcted control segments that underwent revascularization but no BMC implantation (control segments). In BMC-treated segments, however, the change in longitudinal strain was much more pronounced, and proved to be statistically significant. The box plots show median (solid bar), mean (white dot), first and third quartile (box), and range (whiskers).
We then examined the correlation between the change in WMS (ΔWMS) and the change in longitudinal strain rate in cell-treated myocardial segments. Here, a direct correlation analysis with linear regression would not be meaningful, because WMS is a semicategorical scoring system, while 2DSE produces continuous data and needs to be normalized for each patient. Instead, the segmental strain data were grouped in those with ΔWMS < 0 (worsening of wall motion),ΔWMS = 0 (unchanged wall motion), and ΔWMS > 0 (improved wall motion), and the strain change data of the respective segments were summarized (Fig. 5). In segments with a negative change in WMS, indicating decreased contractile function, the median strain change was also negative. In segments with no change in WMS, indicating unchanged contractile function, the strain change was slightly positive. In segments with improved wall motion, however, longitudinal strain rate improved by a median of approximately 200%. Overall, the difference between the WMS-stratified 2DSE data was not statistically significant (p = 0.6 by ANOVA and p = 0.8 by Kruskal-Wallis test). We also performed a direct comparison of the change in wall motion and in longitudinal strain analysis (2DSE) in BMC-treated segments before and 1 year after the operation (Fig. 6). As assessed by conventional wall motion measurement, segmental myocardial contractility increased by a mean of 5% (median 0%). Based on 2DSE, however, regional myocardial contractility increased by a mean of 159% (median 72%, p = 0.0001).

Correlation between the change in wall motion score (ΔWMS) and the change in longitudinal strain rate in cell-treated myocardial segments. The change in strain rate is expressed in percent. The segmental strain data have been grouped in those with ΔWMS < 0 (worsening of wall motion), ΔWMS = 0 (unchanged wall motion), and ΔWMS > 0 (improved wall motion). In segments with improved wall motion, the longitudinal strain rate improved by a median of approximately 200%. Although this stratification helps illustrate the diagnostic power of 2DSE, neither analysis of variance (p = 0.6) nor the Kruskal-Wallis test (p = 0.8) reached the statistical significance level. The box plots show median (solid bar), mean (white dot), first and third quartile (box), and range (whiskers).

Comparison of the change in wall motion (WM) and in longitudinal strain analysis (2DSE) in BMC-treated segmnts before and 1 year after CABG surgery and intramyocardial BMC injection. As assessed by 2DSE, segmental myocardial contractility increased by a mean of 5% (median 0%). Based on 2DSE, however, regional myocardial contractility increased by a mean of 159% (median 72%). The box plots show median (solid bar), mean (white dot), first and third quartile (box), and range (whiskers).
To quantify the diagnostic precision of the longitudinal strain analysis, we constructed a ROC curve and computed the AUROC (Fig. 7). Based on the assumption that contractile function in BMC-treated segments with a >1 change in wall motion score did indeed improve, 2DSE detected these changes with high reliability (AUROC = 0.87).
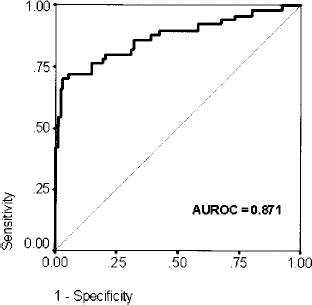
Receiver Operating Characteristic (ROC) curve indicating the relationship of test sensitivity and specificity of longitudinal strain analysis. The Area-under-the-ROC (AUROC) is 0.871 (95% confidence interval 0.8–0.94). The ROC indicates that longitudinal strain detects BMC-induced changes in segmental systolic function with high reliability.
Discussion
In this pilot study, we tested the hypothesis that speckle tracking strain analysis can identify cell therapy-induced regional changes of left ventricular contractility. Both traditional wall motion analysis and 2DSE produced a similar picture with respect to the change in contractile function in control segments without cell injection, indicating a heterogenous but overall mild improvement of contractility that is readily explained by the effects of CABG revascularization. In cell-treated segments, however, 2DSE indicated a much more pronounced and consistent improvement of systolic function, and we will therefore include 2DSE in all future studies that involve localized manipulation of myocardial biology.
Myocardial cell therapy has initially caused tremendous excitement, and hopes were high that infarcted myocardium can be regenerated by using relatively simple autologous bone marrow-derived cell products. Today, it has become clear that the cell-based induction of myocardial regeneration in man requires a much more detailed understanding of the underlying biology and pathophysiology (13). Therefore, sensitive methods to follow the fate of cell-treated myocardium are needed. Magnetic resonance imaging (MRI) is considered the gold standard for measurement of global and regional LV contractility, but has several limitations that call for additional diagnostic means: MRI in patients with implanted electrical devices (ICD, pacemakers), although not impossible, is technically demanding; claustrophobic patients may refuse MRI studies; the availability of cardiac MRI, especially in combination with 3D tissue tagging, is still limited to specialized centers; and the costs of MRI can be substantial. Moreover, conventional cardiac MRI as well as routine echocardiography are essentially morphologic studies that visualize the gross morphology of the myocardium but give no insight in its internal physical dynamics.
Wall motion score analysis of 2D echocardiograms relies on a subjective visual graduation of radial inward thickening, it requires extensive training and remains highly subjective. Unidimensional M-mode measurement of wall thickening and its velocity is influenced by the insonation angle and gives no information on longitudinal or circumferential myocardial function. In contrast, echocardiographic tissue deformation imaging allows for an objective measurement of regional myocardial deformation. As Teske et al. have summarized, the additional value of 2DSE tissue deformation imaging is the unmasking of subtle pathology, the quantification of myocardial function, and the detection of subtle changes over time (15). Especially the latter point may be helpful in the context of cardiac cell therapy studies. Moreover, 2DSE data are highly reproducible and have a small intra- and interobserver variability of approximately 4% and 7%, respectively (2). 2DSE data have been shown to correlate well with sonomicrometry measurements in experimental models as well as with cardiac MRI data, including MRI tagging for 3D myocardial deformation measurement.
In patients undergoing catheter-based intracoronary bone marrow cell infusion in acute myocardial infarction or in chronic ischemia, several controlled clinical trials have shown a modest but reproducible benefit in terms of an improvement in global LV function (1,10). In this situation, with cells being more or less evenly distributed in a large portion of the coronary vasculature, analysis of regional myocardial function is of secondary importance. In our series, global LV function did not improve more than expected after routine CABG surgery, and this is in line with several other studies of localized injection of bone marrow mononuclear cells in postinfarction myocardium. Soon after the advent of clinical cardiac cell therapy, there were a number of reports on improved segmental wall motion and/or thickening (3,16), but no larger phase II or III analogous trials have confirmed a substantial benefit in terms of global LV function or other clinically relevant outcome parameters. Similarly, localized intramyocardial implantation of autologous skeletal myoblasts was first shown to improve regional echocardiographic wall motion parameters (7), but a subsequent multicenter study showed no difference between myoblast-treated and control patients in terms of global LV function (6). Our data demonstrate that intramyocardial bone marrow cell therapy clearly changes the functional behavior of infarcted myocardium, but the effect is still too small to translate into measurably improved global LV function parameters. The reasons for this are probably manifold and include the characteristics of the cell product, cell dose, timing, and the “responsiveness” of the target myocardium. Other, more potent, cell products for clinical use are currently being evaluated and may hold greater promise (8,12). From the clinician's point of view, the impact on global LV contractility and dimensions is clearly most important, and needs to be interpreted in conjunction with functional data in terms of exercise capacity, heart failure symptoms, and ultimately survival (11). From the scientist's point of view, however, a better understanding of the subtle effects of cell therapy on regional myocardial behavior in humans is needed to aid the development of more efficient cell therapy strategies.
The aim of this study was not to collect collateral evidence supporting the concept of using bone marrow mononuclear cells for myocardial regeneration. We are well aware that this strategy is currently not able to significantly change the outlook of heart failure patients undergoing cardiac surgery. Instead, we sought to investigate if 2DSE technology can produce additional information in patients undergoing cell therapy, and we feel that we have provided sufficient evidence supporting this notion. Therefore, we will employ 2DSE in our ongoing and future studies of myocardial cell therapy.