
Abstract
BACKGROUND:
DNA methylation is a molecular modification of DNA that is vital and occurs in gene expression. In cancer tissues, the 5’–C–phosphate–G–3’(CpG) rich regions are abnormally hypermethylated or hypomethylated. Therefore, it is useful to find out the diseased CpG sites by employing specific methods. CpG sites are highly correlated with each other within the same gene or the same CpG island.
OBJECTIVE:
Based on this group effect, we proposed an efficient and accurate method for selecting pathogenic CpG sites.
METHODS:
Our method aimed to combine a
RESULTS:
Extensive simulation studies were used to compare our proposed approach with existing mainstream regularization in respect of classification accuracy and stability. The simulation results show that a greater predictive accuracy was attained in comparison to previous methods. Furthermore, our method was applied to over 20000 CpG sites and verified using the ovarian cancer data generated from Illumina Infinium HumanMethylation 27K Beadchip. In the result of the real dataset, not only the indicators of predictive accuracy are higher than the previous methods, but also more CpG sites containing genes are confirmed pathogenic. Additionally, the total number of CpG sites chosen is less than other methods and the results show higher accuracy rates in comparison to other methods in simulation and DNA methylation data.
CONCLUSION:
The proposed method offers an advanced tool to researchers in DNA methylation and can be a powerful tool for recognizing pathogenic CpG sites.
Keywords
Introduction
DNA methylations occur at cytosine which might affect the modifications of DNA molecules. In this process, the gene expressions can be regulated without changing the DNA sequences. In particular, the related gene silencing of DNA methylations is a well-accepted epigenetic mechanism that often occurs at tumor suppressor genes loci in human cancers [1, 2, 3, 4, 5]. Recently, some high-throughput DNA methylation platforms have generated amounts of DNA methylation data and mostly based on genotyping bisulfite converted DNA. In this paper, one of the popular platforms, Illumina Infinium HumanMethylation 27K array, was used. Additionally, the
To date, researchers have selected methylated sites by statistical classification approaches [7, 8, 9]. Even though most of the CpG sites display various degrees of methylation, only a few gene expressions change. The statistical approaches therefore are difficult to find relevant CpG sites from high-dimensional data, making the statistical approaches not suitable for methylation data. In order to select CpG sites, different parameter models were utilized by researchers to represent diverse status of the samples [10]. Methylation data expresses different features from gene expression data. Firstly, the DNA methylation data has a group effect feature among CpG sites based on gene groups and CpG island groups. Secondly, the DNA methylation data values range between 0 and 1. Based on these features, Sun [11] has proposed a procedure that merged the
With the Illumina HumanMethylation 27K array, each gene has about 1–25 correlated CpG sites and each CpG island has about 2–11 CpG sites. Based on these aspects of DNA methylation data, a
Methods
Network-regularization
In this research,
where
where
Lasso (
Some methods have been provided in order to tackle highly correlated variables. Elastic net penalty (
The methylation data displays a strong group effect and thus previous research used a fully connected network (Fc.net) to describe the correlated CpG sites group patterns within a gene. In methylation data, the group effect of CpG sites is not only present within one gene and present within one CpG island. There are overlapping parts between groups and these overlapping parts correlate with both parts respectively. With the different previous network, we set the overlapping part as the central node and connect it with other correlated parts (Fig. 1). The network not only has the genome information or CpG island information, but also the two aspects of information integrated into the network. It can better reflect the relevance of CpG site.
a. Previous fully connected network. b. Central node fully connected network.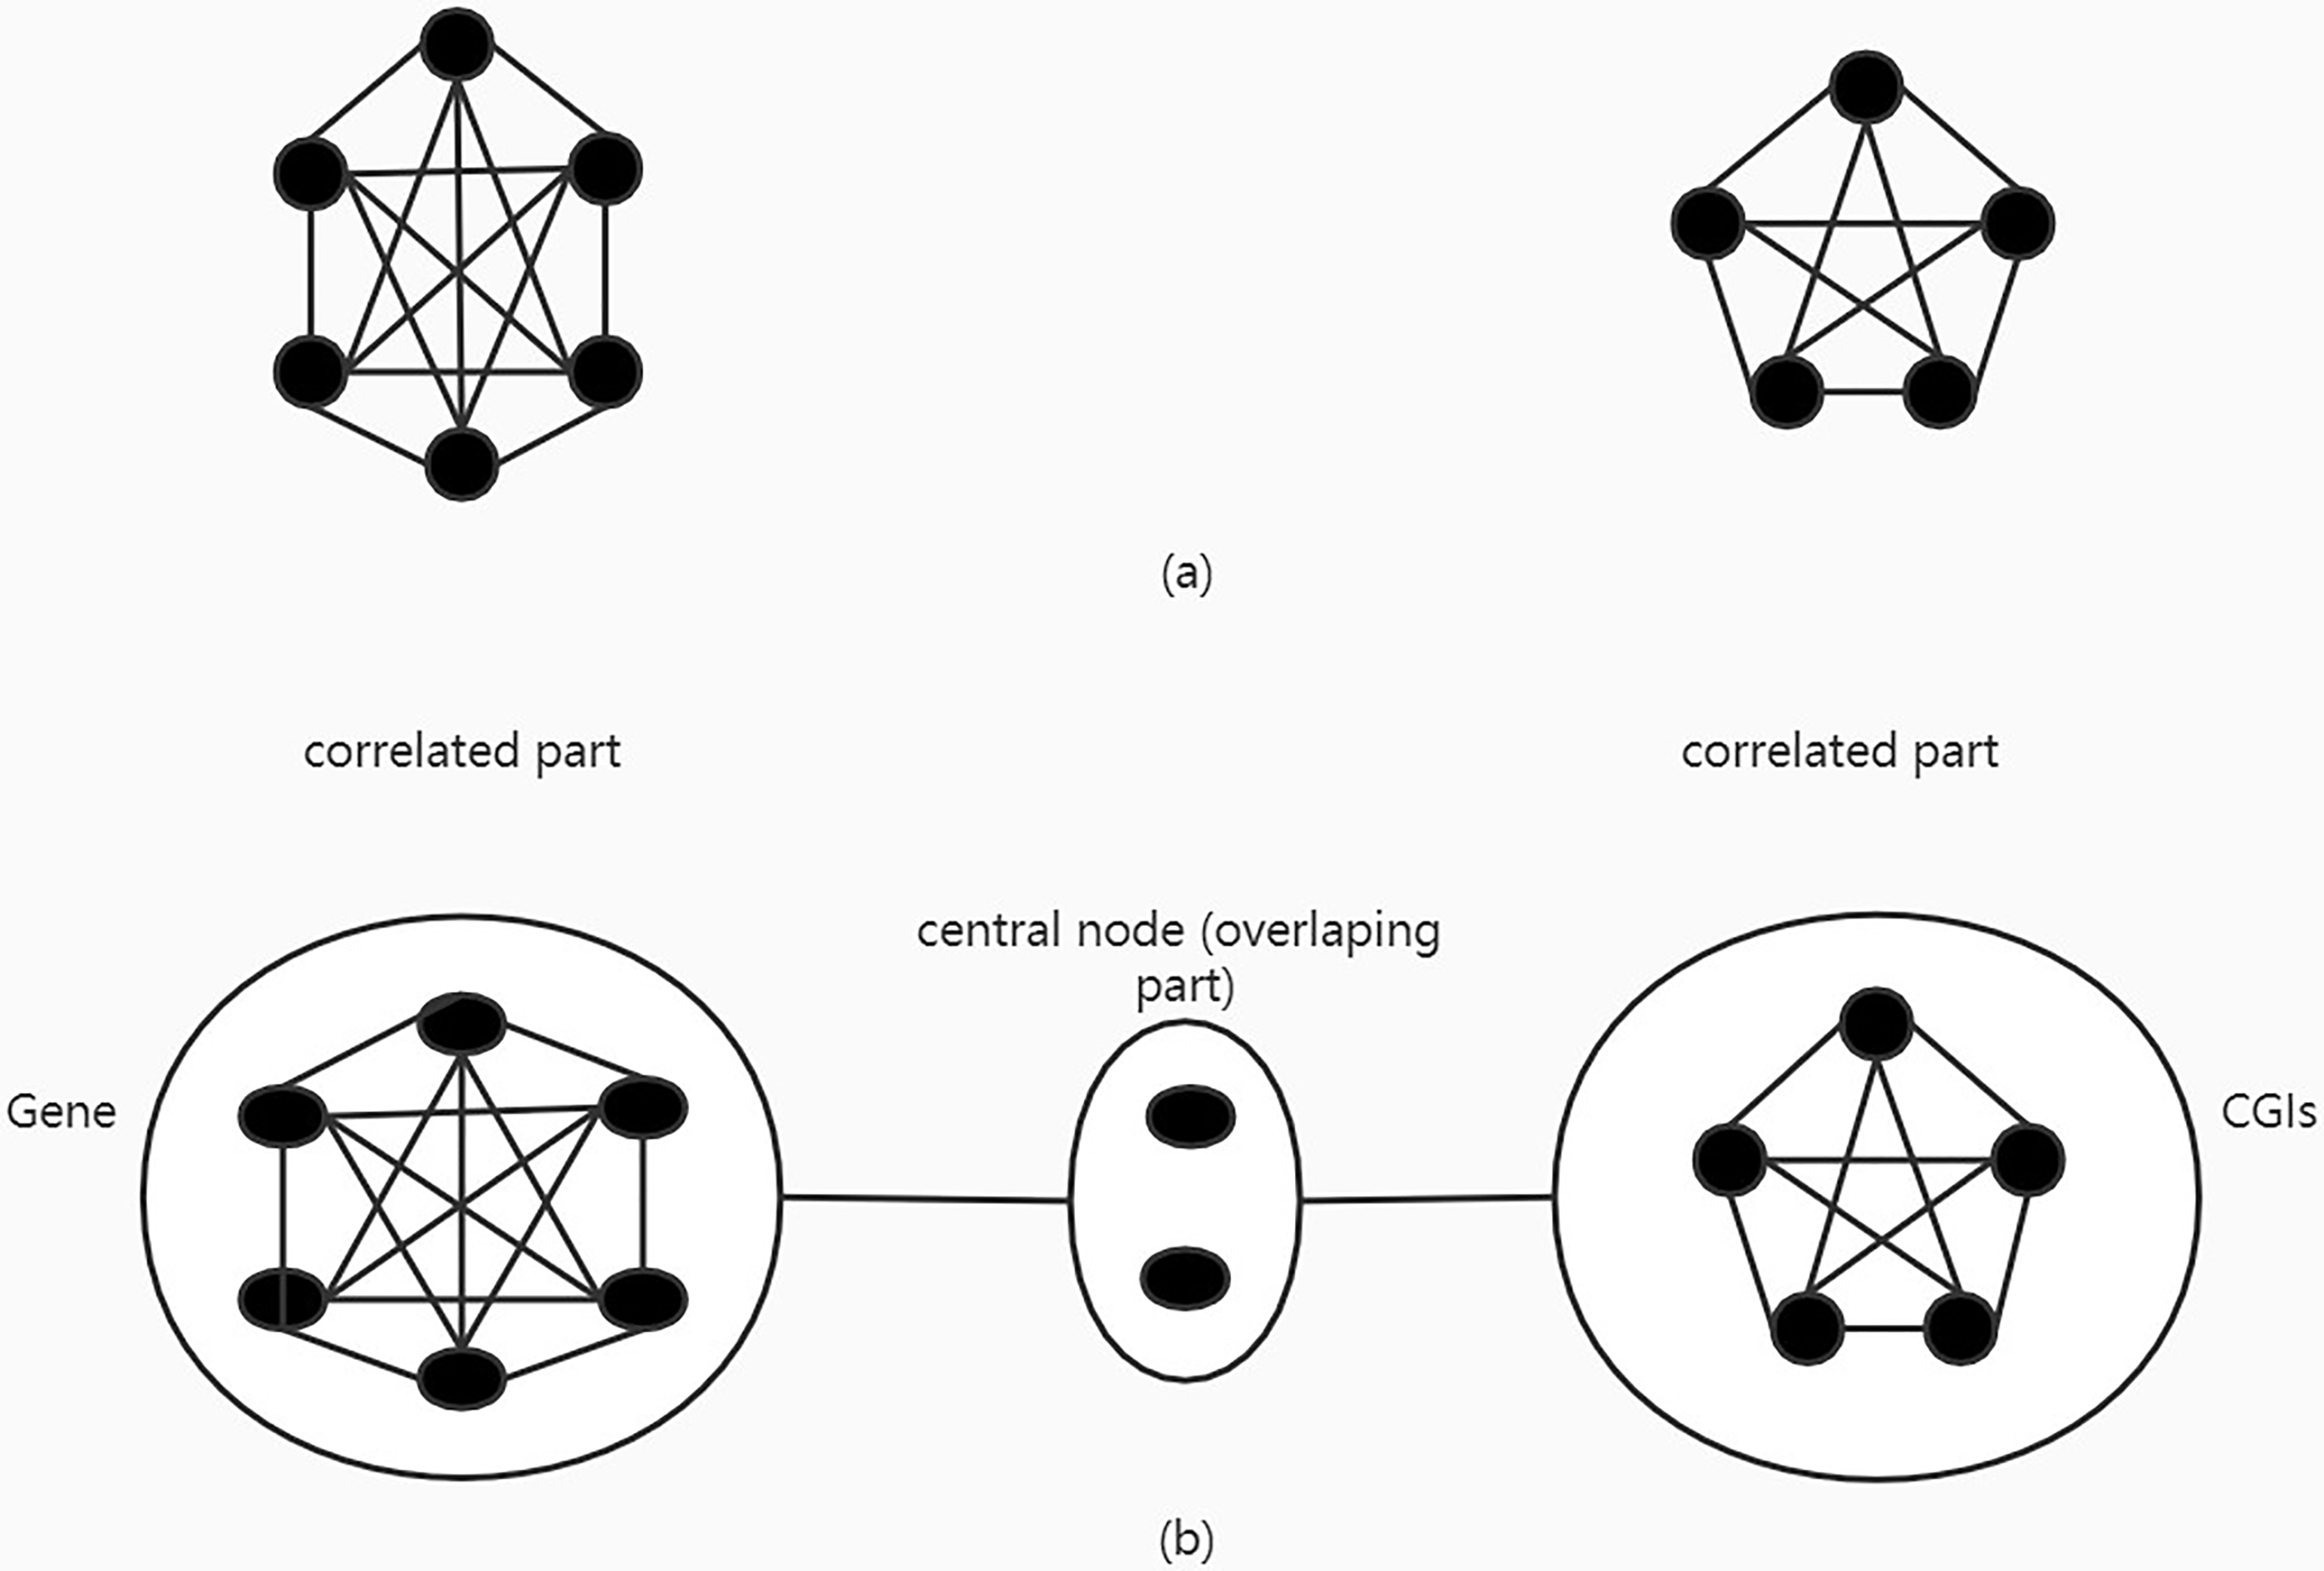
The network information is represented in a graphed structure with p-dimensional Laplacian matrix
where
The penalty function in Eq. (3) is:
where
The effectiveness of the penalty function reduced significantly when two negatively correlated predictors are interacted; the signs of coefficients are thus predicted and added to the Laplacian matrix to overcome problem:
The adaptive net function can be written as:
Based on
To solve regularization models, the coordinate descent algorithm adopted as a competent tool. Regarding the coordinate descent algorithm, we referred to previous research [15, 16, 11] and Eq. (2) can be linearized by Taylor series expansion at current estimates
where
Next, the estimator:
where
where
Analyses of simulated data
The performance of the proposed simulation study quoting the simulation from Teschendorff et al. [17] and Su and Wang [11] was analyzed and evaluated. There were 600 groups, which were divided into 100 groups, 150 groups and 7 sets of 50 groups in accordance to their number of CpG sites. Each group comprised of at least 1 CpG site up to 9 CpG sites reciprocally. In total, there were 2500 CpG sites.
First, we simulated variables with the group effect ranging between 0 and 1. So we performed an inverse logit transformation on a multivariate normal distribution variable to represent the
where
The first condition is autoregressive (AR) model, and the second condition is compound symmetric correlation model. We set three different correlation coefficients
Second, given the regression coefficients
when
In the simulation models, there were 45 pathogenic CpG sites in a total of 2500 CpG sites. Lastly, the
The total area under the averaged ROC curves (AUC) and MSE for all models
The ROC curve of every model.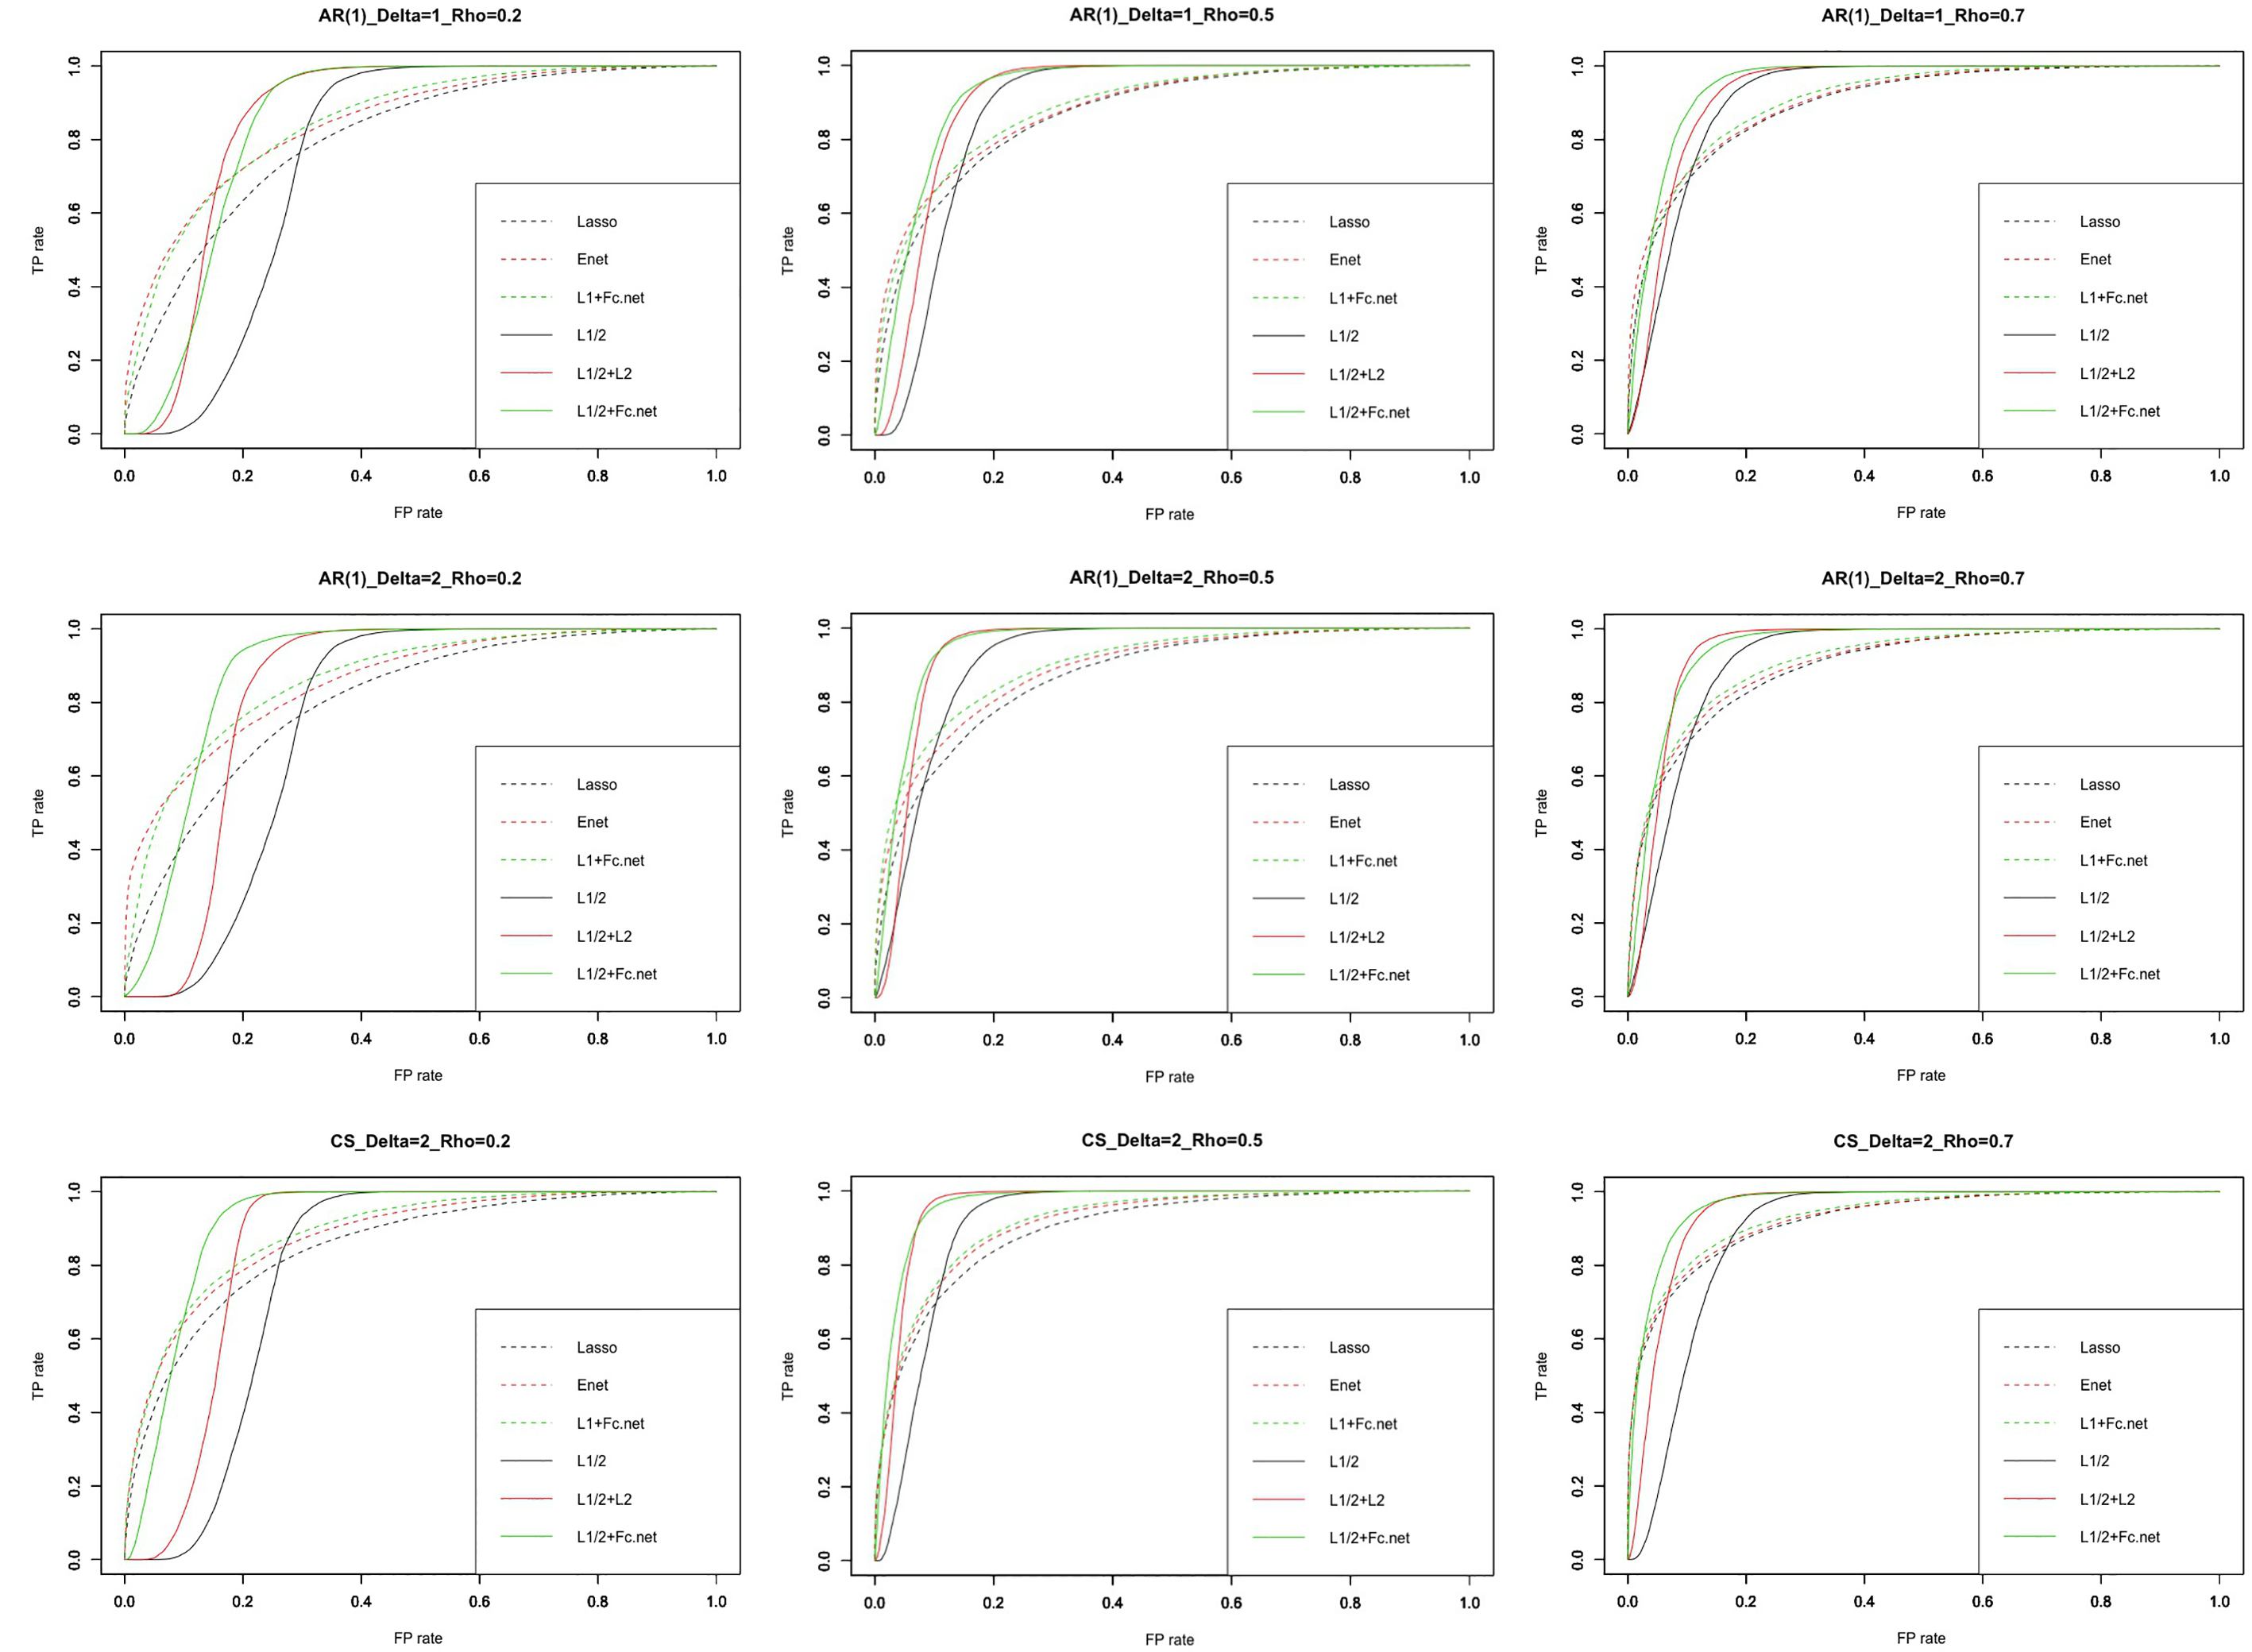
We repeated simulations 100 times for each condition. We then used the 10-fold cross-validation (CV) approach in the training set in order to tune the optimal regularization parameters of the Lasso, Elastic-Net (Enet),
The AUC of real data for each method
The histogram of correlation between CpG sites.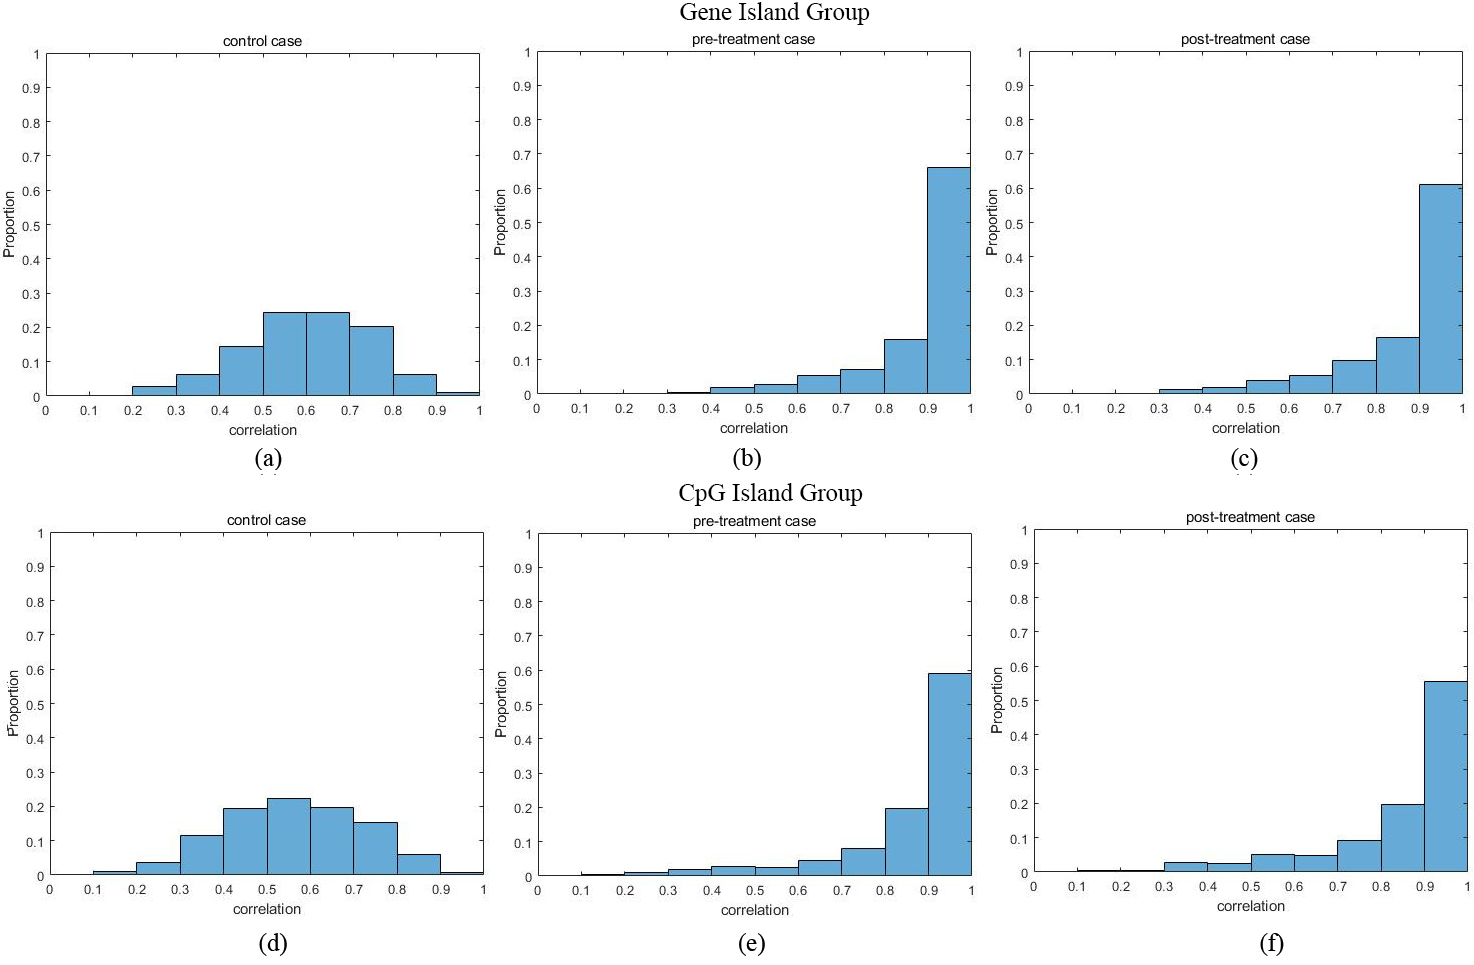
Figure 2 shows the receiver operating characteristic curve (ROC curve) for every model. The green solid line (
The top 20 CpG sites and the corresponding genes selected from the comparison between pre-treatment and normal control cases
The boxplot of correlation between CpG sites.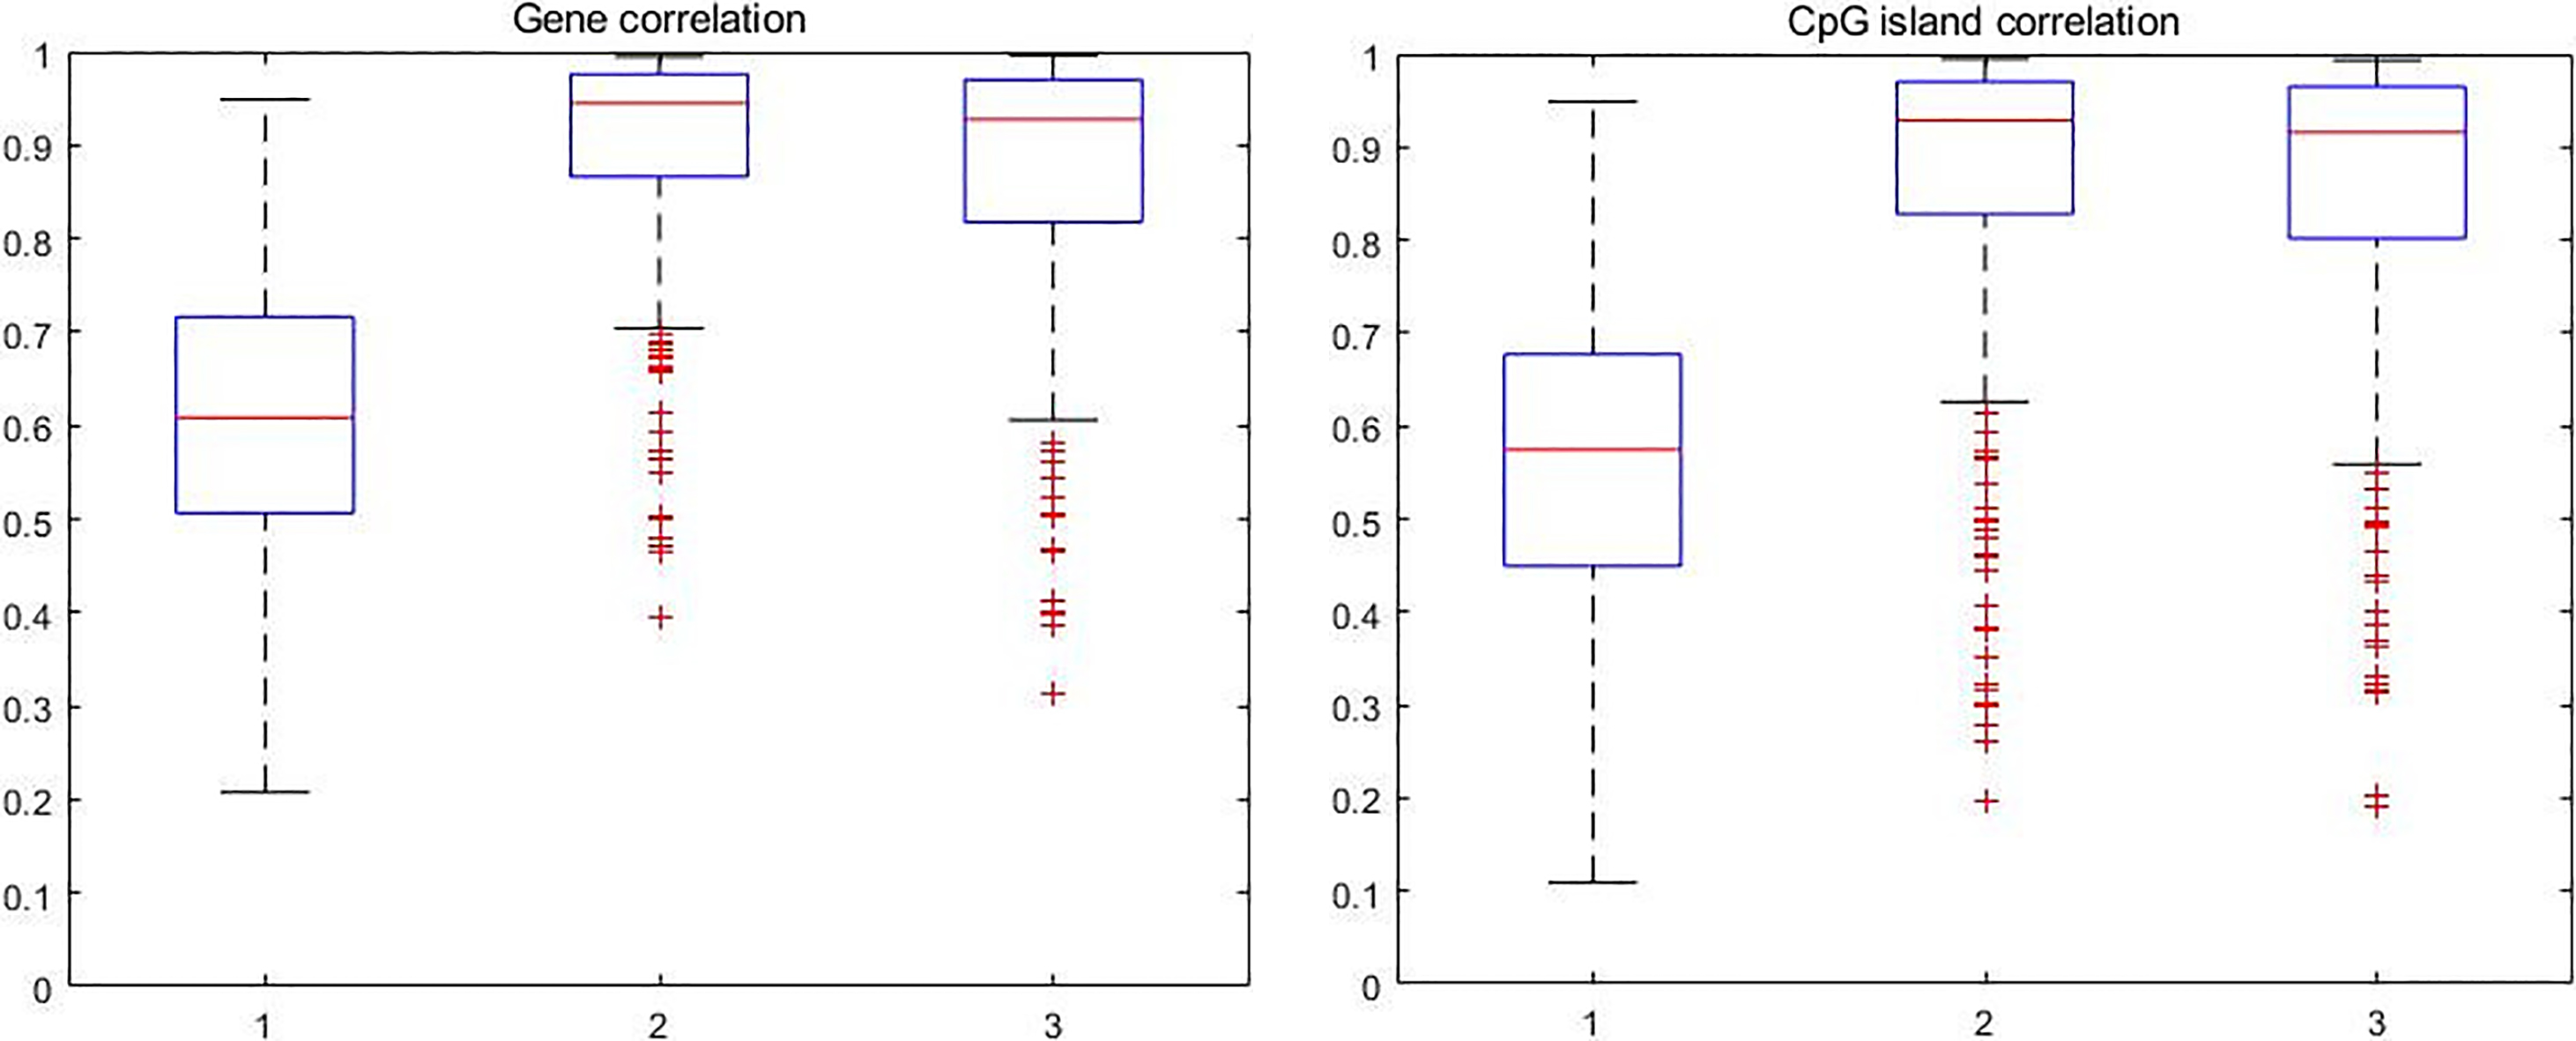
To further evaluate the effectiveness of our proposed method, in this section, we examined the DNA methylation (ovarian cancer) data generated from Illumina Infiniumm HumanMethylation 27K Beadchip [20]. The data is accessible from NCBI (
The data was generated by llumina Infiniumm HumanMethylation 27K Beadchip that contains 22727 CpG sites. We first removed samples which were low in BS conversion efficiency or low in CpG coverage. After that, a total of 207 genes contained more than 3 CpG sites and 295 CpG islands contained more than 3 CpG sites in the data; samples with error were removed. Lastly, there were 156 controls case samples (Healthy sample), 120 pre-treatment case samples and 122 post-treatment case samples. For these three cases, we calculated the maximum correlation of CpG sites in each group (gene and CpG island).
Figure 3a–c shows the histogram of maximum sample correlation between CpG sites within genes in control, pre-treatment and post-treatment case where Fig. 3d–f shows the histogram of maximum sample correlation between CpG sites within CpG islands in control, pre-treatment and post-treatment cases. Figure 4 shows the boxplot of maximum sample correlation between CpG sites in gene or CpG islands. Based on Figs 3 and 4, the results show that most CpG sites within the same group have high correlation in pre-treatment case samples and post-treatment case samples whereas the control case samples only show a significant correlation.
The top 20 CpG sites and the corresponding genes selected from the comparison between post-treatment and normal control cases
The top 20 CpG sites and the corresponding genes selected from the comparison between post-treatment and normal control cases
Table 2 shows the AUC for each method from real data analysis. In real data, the enhanced
In biological molecular research, the analysis of DNA methylation may be a new practice for cancer research. In this paper, we used the enhanced
Footnotes
Acknowledgments
The Macau Science and Technology Develop Funds (grant no. 0158/2019/A3) of Macau SAR of China supported this work.
Conflict of interest
None to report.