
Abstract
The Maurer's clefts (MCs) are very important for the survival of Plasmodium falciparum within an infected cell as they are induced by the parasite itself in the erythrocyte for protein trafficking. The MCs form an interesting part of the parasite's biology as they shed more light on how the parasite remodels the erythrocyte leading to host pathogenesis and death. Here, we predicted and analyzed the genetic regulatory network of genes identified to belong to the MCs using regularized graphical Gaussian model. Our network shows four major activators, their corresponding target genes, and predicted binding sites. One of these master activators is the serine repeat antigen 5 (SERA5), predominantly expressed among the SERA multigene family of P. falciparum, which is one of the blood-stage malaria vaccine candidates. Our results provide more details about functional interactions and the regulation of the genes in the MCs’ pathway of P. falciparum.
Introduction
The existence of multiple-stained structures known to be Maurer's clefts (MCs) in the cytosol of erythrocytes derived from patients with Plasmodium falciparum malaria using light microscopy was first detected by George Maurer.1–3 For over a century, the functions of the MCs remained obscure. 4 In the last decade, scientists have been interested in the mediatory role the MCs play in protein transportation from the cytoplasm of P. falciparum to the surface of the erythrocyte of the host, which they consider an unconventional and intriguing biological procedure.5,6
Upon evasion, P. falciparum totally recasts the infected human red blood cells to access nutrients and to elude the immune system. 7 The erythrocytes have no secretory systems that the parasite can subvert. As such, it evolves trafficking pathways for the export of macromolecules. 8 More than 10% of all the parasite's proteins (>400 proteins) are smuggled to the cytosol of its host.7,9 The transported proteins induce extreme structural adjustment to the red blood cell, such as increasing the toughness of the cell of its host and the development of lumps. This in turn makes the affected cells adhere to the endothelium, hence leading to the development of malaria.8,10,11 Reports also show that MCs are created at various portions in the life cycle of the parasite, and this affirms their relevance to parasite development and survival. 4
Computationally, only about one-third of the transcription factors (TFs) expected of the genome of the size of P. falciparum are known, while the knowledge of the corresponding binding sites is lacking. A few works have experimentally validated motifs in the parasite, but their binding proteins are unknown. Others have identified some transcription-associated proteins, but very little is known about their binding sites.12–15 This study is an attempt to identify novel transcriptional regulators (master activators/inhibitors) of the MC pathway in P. falciparum by predicting its gene regulatory network (GRN) from gene expression data.
Gene regulatory networks
Gene networks depict transcriptional regulation, ie, how genes respond to signals. 16 GRNs simply show how and when genes in a cell interact with each other. GRNs expressly depict the causality of developmental processes. 17 Several methods exist for the modeling and simulation of GRNs from high throughput experimental data, such as expression profiles, genomic sequences, and TF-binding site assays. These include, but are not limited to, Boolean models,18,19 Petri net models,20,21 neural network models,22,23 ordinary differential equation models,24,25 Bayesian network (BN) models, 24 relevance/association networks, 26 and graphical Gaussian models (GGMs).27–29
A commonly used computational method in modeling GRNs is to compute the Pearson correlation coefficients (r) between all possible combinations of the genes of interest. Any of such combinations having Pearson correlation coefficients above a predefined threshold is considered to be significant, ie, exhibit useful relationships, influence, or dependence. 27 Such networks are referred to as relevance/association networks. It is important to note that they may lead to vague results, particularly if it is a dense system of connections. 30
BNs are classified as probabilistic graphical models. 31 BNs are also a type of directed acyclic graphs that are other types of graphical model structures. BNs and its extensions have been used extensively to predict regulatory networks.32–38 However, there are drawbacks with using BNs for modeling GRNs. Some drawbacks include the difficulty in dealing with time series data, ie, higher number of genes compared to sample size, and inability to capture feedback regulation/loops that are normal in real-life gene networks and are nondeterministic polynomial-time hard learning problems.39–41 The implementation of dynamic BNs also has some drawbacks, including excessive computing time, result precision largely dependent on quantity of genes, and requirement of more prior information of the transcription regulation.5,41–43
GGM is a preferred alternative. It uses partial correlation (pcor) to ensure a rich appraisal of a direct relationship between any combinations of genes.44,45 Unlike Pearson correlation, pcor of two genes calculates the amount of correlation left after eliminating the influence of other genes. Previous works have established that GGMs are very effective in inferring conditional dependency and modeling interactions among genes.27,45–49 Earlier, predicting network interactions using GGM had been limited to data sets with fewer genes due to the fact that gene expression experiments had few samples (n), which are usually very less compared to the amount of genes (P).45,46 This scenario is referred to as small sampling problem, ie, P ≫ n cannot be accommodated by standard GGM.49,50 One possibility of resolving this problem is by using the regularized GGM approach proposed by Schäfer and Strimmer. 48 This approach is referred to as the shrinkage approach that is suited to cases where the number of genes is slightly larger than the number of samples.51,52 In order to introduce directionality into the network, as GGMs are essentially undirected networks displaying only direct linear relationships, Opgen-Rhein and Strimmer 53 introduced an extension of the shrinkage approach to graphical Gaussian modeling, which they referred to as causation networks. We have used this regularized directed GGM, as implemented in the GeneNet R package, to build a gene network for MC pathway of P. falciparum based on gene expression profiles.
Materials and Methods
Microarray data
Gene expression data with accession number GSE24416 were downloaded from the Gene Expression Omnibus (GEO) database (www.ncbi.nlm.nih.gov/geo/, accessed 11/02/2015). The experiment was done by Foth et al. 54 The 24 time point samples were harvested from a tightly synchronous 6.5-L biofermenter culture of P. falciparum (Dd2) at two-hour intervals during one entire (48 hours) intraerythrocytic developmental cycle and compared against a 3D7 RNA reference pool.
MC pathway proteins of P. falciparum.
Genes that belong to the MCs’ pathway were downloaded from PlasmoDB version 13.0 (http://plasmodb.org, accessed 11/02/2015). Nine pathways concerned with the MCs, based on the classification from Hagai Ginsburg's Malaria Parasite Metabolic Pathways database (at http://mpmp.huji.ac.il/), were used for this study. They include “Biogenesis of Maurer's clefts” – 3 genes, “Characteristics of Plasmodium falciparum export proteins that remodel infected erythrocytes” – 41 genes, “Established and putative Maurer's clefts proteins” – 134 genes, “Exported parasite proteins associated with Maurer's clefts” – 11 genes, “Genes coding for protein traffic related proteins” – 61 genes, “Maurer's clefts” – 7 genes, “Properties of proteins exported to erythrocyte” – 39 genes, “Subcellular location of exported proteins” – 43 genes, and “Subcellular localization of proteins involved in invasion” – 81 genes. Expression values were found for 319 of them from the gene expression data set used. The list of genes used for this study with their gene IDs is provided in Supplementary File S01.
Network construction
All analyses were done in R version 3.1.1 (www.R-project.org), Bioconductor version 2.14, 55 and RStudio version 0.98.978. 56 The following R packages were used for the network modeling: GEOquery version 2.30.1 to load the gene expression data from GEO database directly into R 57 ; GeneNet version 1.2.12 to model the GRN 58 ; Graphviz version 2.38, 59 dnet version 1.0.7, 60 venerable version 3.0, 61 and igraph version 0.7.1 62 for network visualization; and BCRANK version 1.26.0. 63 The detailed computational pipeline used for the analyses is presented in Supplementary File S02. The R source code for the analyses is provided in Supplementary File S03.
Results
The dynamic shrinkage approach as implemented in the GeneNet 58 R package was used to estimate the pcor matrix of all possible edges. The resulting pcor network had 50,721 edges connecting 319 nodes with pcor values ranging from −0.20 to +0.213. The density function, distribution function, and local false discovery rate (FDR) values are shown in Figure 1.

Plot of the density function, distribution function, and local FDR values. The null distribution is depicted by the dashed line; it follows a normal distribution with 0 mean and a standard deviation of 0.05. The solid line signifies the alternative distribution. The empirical distribution (indicated by the histogram) is composed of the null distribution and the alternative distribution.
Our approach favored the edges with lower pcor values. This is because pcors having the lowest absolute values mean they have the largest amount of effects after other genes have been removed. We extracted edges whose |pcor| is ≥0.04. This resulted in 1160 edges out of 50,721 edges. The Pearson correlation coefficient (r) was estimated for these edges and used to further prune the network by eliminating edges with −0.60 ≤ r ≤ 0.60 as any r close to 0 indicates independence. This left us with 178 edges. We then selected the top 100 edges (sorted according to the absolute strength of the correlation from the strongest to the weakest), representing ~0.2% of all possible edges as significant edges. The resulting GRN of the MCs’ pathway is shown in Figure 2. The complete significant edge list with their pcor coefficients, Pearson correlation coefficients, P-values, q-values, and FDR values is presented in Supplementary File S04.

The resulting GRN of the MCs’ pathway in P. falciparum. The straight lines represent activation relationship (positive correlation), while the dotted lines represent inhibitory relationship (negative correlation). The intensity of the lines represents the amount of regulation. The red nodes are the hubs – master activators/repressors – while the yellow nodes are their predicted target genes.
From this network, we estimated the out-degree of the participating nodes to identify hubs. The hubs are major players in the network (master activation/master inhibitors). Our hypothesis here is that these genes are possibly playing a key role in the regulation of the pathway, ie, the protein trafficking activities of the parasite, and should be further investigated. From our analysis, four genes had the highest number of direct connections in the network: PFL0780w, PFB 0340c, MAL7P1.92, and PF08_0002. We extracted the subnetworks of the genes. Our hypothesis is that these genes are the possible target genes of the respective hub genes. The subnetworks are shown in Figure 3A–D.
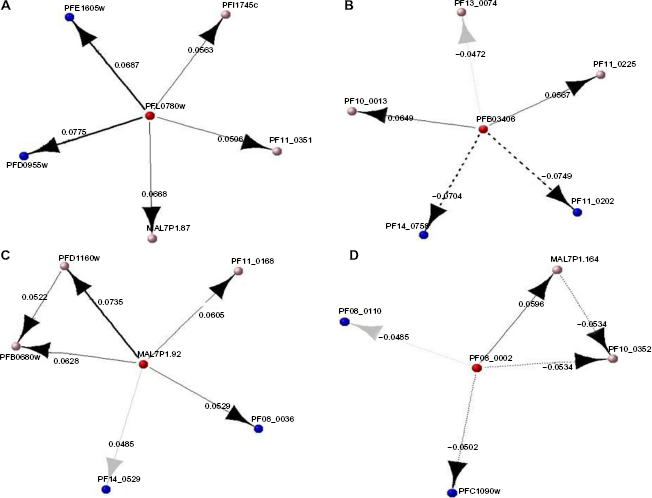
Subnet for the master activators/repressors with their target genes. The red nodes are the predicted TFs, while the blue nodes are the predicted target genes that share an overrepresented motif in their promoter region (predicted binding site) and the pink nodes are predicted target genes that do not share the motif but have a direct interaction from the predicted regulatory network in Figure 2: (A) subnetwork for PFL0780w, (B) subnetwork for PFB0340c, (C) subnetwork for MAL7P1.92, and (D) subnetwork for PF08_0002.
Predicting binding sites
We extracted 1000 bp upstream of transcription start site for the target genes identified for each master activator from PlasmoDB in FASTA format. The sequences in each group were ranked (arranged) according to the strength of correlation with their master activator. We then used the methods implemented in the R package BCRANK to find the overrepresented motifs in the upstream sequences. BCRANK is useful for predicting binding site consensus for ranked DNA sequences. See the package manual for more details on the BCRANK algorithm. 52 A number of predictions resulted from the running of this algorithm, and the first motif was selected as the candidate motif as it is the most statistically significant motif. Details on the resulting motifs for each set are provided in Supplementary File S05.
Discussion
Our results show four major players that we hypothesized to play important roles in the regulation of activities in the MCs. The first is PFL0780w; from our network, we predicted the following target genes: PFD0955w, PFE1605w, MAL7P1.87, PFI1745c, and PF11_0351. The first two have the motif ACATGTAA overrepresented in their upstream sequence that we predicted to be the binding site of the TF. PFL0780w was reported by the ontology-based pattern identification database to be involved in translational regulator activity and tRNA metabolic process, which is in line with our predictions. From life cycle expression data (combined from several microarray experiments available in PlasmoDB version 13.0), its expression pattern is increasing from the early ring to early trophozoite stage (ie, from 0 to ~25 hpi) and then it reduces; this explains the fact that it is truly an important protein in the survival strategy mechanisms of the parasite. Apart from the MCs, PFL0780w participates in other pathways, such as glycolysis, fatty acid synthesis, and mitochondria electron flow. The second is PFB0340c with the following predicted target genes: PF11_0202, PF14_0758, PF10_0013, PF11_0225, and PF13_0074. The first two genes have the motif TCTTATTTT as the predicted binding site. PFB0340c also known as SERA5 is involved in the regulation of immune response, proteolysis, and immunoglobulin production. SERA5 is predominantly expressed among the SERA multigene family of P. falciparum (which is one of the blood stage malaria vaccine candidates), and the acquired antibody titers correlate with the serum inhibition of the parasite growth. 64 Life cycle expression data show that PFB0340c is expressed late in the erythrocytic cycle, ie, from late trophozoite to early schizont stage (~30–35 hpi). The third is MAL7P1.92, and we predicted PFD1160w, PFB0680w, PF11_0168, PF08_0036, and PF14_0529 as its target genes. The last two genes have the motif ATGCCTTTTT overrepresented in their upstream sequence. MAL7P1.92 also known as cysteine repeat modular protein 2 (CRMP2) is localized in parasite plasma membrane during schizont stage and in MC during early trophozoite stage. The fourth is PF08_0002; MAL7P1.164, PF10_0352, PFC1090w, and PF08_0110 are its predicted target genes. The last two genes have the motif TAATAATTTA as their predicted binding site. PF08_0002 is surface-associated interspersed protein 8.2 (SURFIN 8.2). It is upregulated in the early trophozoite stage. Apart from the MC pathway, PF08_0002 is also involved in the interactions between modified host cell membrane and endothelial cell pathway. Table 1 presents more details about each of the four predicted TFs. For each predicted TF, its predicted target genes are listed with their gene names, product description, annotated gene ontology (GO) function term, and annotated GO process term. The enrichment analysis map65,66 for these predicted TFs and their target genes is presented in Figure 4. The following GO categories were found to be significantly overrepresented: protein transport, membrane coat, protein localization, coated membrane, and establishment of protein localization.
Full details of the predicted TFs and their target genes.


Enrichment analysis map of all predicted TFs and their target genes for the MCs’ pathway at a significant level of P = 0.001 and q = 0.05. The enrichment map gives a graphical representation of the GO terms that were found to be significantly overrepresented in the context of the GO hierarchy.
Conclusion
We have successfully predicted the GRN of a very important pathway in the deadly malaria parasite P. falciparum. A number of predictions have been made from our analyses that should be further validated experimentally. Our results have also confirmed findings from previous studies and yielded new information, which shed more light and help improve our understanding of the genetic regulation activities of P. falciparum in our quest to fully overcome the malaria endemic. The knowledge of the predicted TFs, their target genes, and their predicted binding sites will indeed increase our understanding of the mechanism that underlay the tight transcriptional control of P. falciparum and also help in the rational design of promoters to ease the study of essential genes of the parasite.
Author Contributions
All authors contributed to this work. Original idea and conception: II, JO, BB, EA. Implementation of research methods: II. Writing and revision of the manuscript: II, JO. All authors reviewed and approved the final manuscript.
Supplementary Material
Supplementary File S01
Gene_list.txt.
Supplementary File S02
Computational pipeline.pdf.
Supplementary File S03
MC-GRN_sourcecode.R.
Supplementary File S04
Filtered_network.xlsx.
Supplementary File S05
Motifs.txt.
Footnotes
Acknowledgments
The authors would like to acknowledge the contribution of the reviewers in improving the quality of this article.