Abstract
BACKGROUND:
Chronic obstructive pulmonary disease (COPD) is a complex disorder with a high mortality. The pathophysiology of COPD has not been characterized till date.
OBJECTIVE:
To identify COPD-related biomarkers by a bioinformatics analysis.
METHODS:
Here, we conducted the canonical correlation analysis to extract the potential COPD-related miRNAs and mRNAs based on the miRNA-mRNA dual expression profiling data. After identifying miRNAs and mRNAs related to COPD, we constructed an interaction network by integrating three validated miRNA-target sources. Then we expanded the network by adding miRNA-mRNA pairs, which were identified by Spearman rank correlation test. For miRNAs involved in the network, we further performed the Gene Ontology (GO) functional enrichment analysis of their targets. To validate COPD-related mRNAs involved in the network, we performed receiver operating characteristic (ROC) curve analysis and Support Vector Machine (SVM) classification on only those mRNAs that overlapped with COPD-related mRNAs of Online Mendelian Inheritance in Man (OMIM) database.
RESULTS:
The results indicate that some identified miRNAs and their targets in the constructed network might be potential biomarkers of COPD.
CONCLUSIONS:
Our study helps us to predict the potential risk biomarkers of COPD, and it can certainly help in further elucidating the genetic etiology of COPD.
Introduction
Chronic obstructive pulmonary disease (COPD) is caused by excessive exposure to highly polluted air containing high concentration of metallic oxidants. It is a chronically progressive disease that causes obstruction of airflow in patients [1]. The pathophysiology of COPD has not been understood completely till date; however, cigarette smoking is considered as an important risk factor. Previous studies have reported that oxidative stress plays a pivotal role in the pathogenesis of COPD by initiating and mediating various redox-sensitive signal transduction pathways and gene expression [2]. The pathogenesis of COPD includes multiple risk factors, including environmental [3], genetic and epigenetic components and a combination of these components. Therefore, it is important to investigate COPD-related biomarkers to comprehensively elucidate the pathogenesis of COPD.
MicroRNAs (miRNAs) are small (
To address this issue, we conducted canonical correlation analysis on miRNA-mRNA dual expression profile data in this study. The results of canonical correlation analysis were used to identify the potential miRNAs and mRNAs associated with COPD. After identifying miRNAs and mRNAs, we constructed their interaction network by integrating the three validated miRNA-target sources. Then, we expanded this network by combining miRNA-mRNA pairs based on Spearman rank correlation test. For miRNAs involved in the network, we further performed the GO functional enrichment analysis of their targets. In particular, we manually searched COPD-related genes from Online Mendelian Inheritance in Man (OMIM) database. Furthermore, we extracted genes that overlapped with target genes of miRNAs involved in the network. On these extracted genes, we performed ROC curve analysis and SVM classification to explore their potential association with COPD. The results indicate that some identified miRNAs and their targets in the constructed network might be potential risk biomarkers of COPD. The results of our study can be used to predict the potential risk biomarkers of COPD, which can then be used to comprehensively elucidate the regulatory changes associated with the development and progression of COPD.
Materials and methods
Data source
In the current study, we used miRNA-mRNA dual expression profiling data (GSE38974) to implement our analysis. MicroRNAs were profiled in subjects with 19 COPD patients and 8 normal smokers using Exiqon miRNA microarrays (GPL7723). Microarray of mRNAs was obtained from Agilent Quick Amp Labeling technologies (GPL4133), which includes 9 normal smokers and 23 COPD patients. The processing of raw miRNA and mRNA microarray data was in complete agreement with the original contribution [10]. We used SAM (Significance Analysis of Microarrays) method [11] to identify statistically significant differential expression of mRNAs and miRNAs that distinguish COPD patients from the normal smokers. To eliminate false positive discoveries and to ensure the results agreed with other sample sets of COPD, we selected more rigorous criteria of
Sample matching based on the propensity score
Because the sample size of miRNA and mRNA expression profile datasets was different, we could not delete samples arbitrarily. Therefore, we first performed matching using the propensity score (PS) method, which was performed in the ratio of 1:1 sub-samples on two datasets. Propensity score (PS) is often defined as the conditional probability of receiving a certain treatment from the given covariates [13]. In the current PS matching, the selected covariates are as follows: age, gender, height, weight and smoking history. The logistic regression model was used for PS matching in this analysis. As a result, four samples having lower PS score of mRNA expression profiling were discarded. Then, we performed further analysis on the miRNA-mRNA dual expression profile of 19 COPD patients as they had matching propensity score analysis.
Canonical correlation analysis
In general, canonical correlation analysis was performed to identify and measure the association between two sets of variables. It can find the two bases in which the correlation matrix between the variables is diagonal and the correlations on the diagonal are maximized [14]. It is important to note that canonical correlation method loses its effect if overfull variables are included in the analysis; therefore, we did not select the whole differentially expressed miRNAs and mRNAs to perform canonical correlation analysis. Alternatively, we only selected those differentially expressed miRNAs and mRNAs involved in the miRNA-target relationships that integrate three miRNA-target sources: miRTarBase [15], miRecords [16] and TarBase [17]. In this analysis, miRNAs were considered as the first set of variables and mRNAs as the second set of variables. Consider the number of variables exceeded the number of samples; we performed the regularized canonical correlation (RCC) to seek the potential associations between miRNAs and mRNAs. Before performing RCC on two variables sets, we used the leave-one-out criterion to determine the optimal values of two regularization parameters. The CCA package of R software (
Network construction
For the extracted miRNAs and mRNAs from the canonical correlation analysis, except kept those miRNA-target relationships obtained from three miRNA-target sources, we expanded the network based on the associations between identified miRNAs and mRNAs. We only selected those miRNA-mRNA interactions showing significant p-values
The miRNAs and mRNAs identified by canonical correlation analysis
The miRNAs and mRNAs identified by canonical correlation analysis
In the constructed network, for each miRNA, we performed the Gene Ontology (GO) function enrichment analysis for their target genes. We used clusterProfiler package of R software (
Validation of the potential COPD-related genes involved in the network
Classification performance analysis for the identified potential COPD-related genes
To find whether the genes involved in the constructed network might be potential COPD-related genes, we manually selected genes that overlapped with COPD-related genes included in Online Mendelian Inheritance in Man (OMIM) database [19]. The area under receiver operating characteristic (ROC) curve of these overlapping genes was calculated to detect COPD. We used the expression of these overlapping genes as predictor variables, and applied Support Vector Machine (SVM) [20] to distinguish COPD patients from normal smokers. In practice, cross-validation can limit problems like overfitting and derive a more accurate estimate of model prediction performance. Because enough data was not available to partition it into “training set” and “test set”, significant modeling or testing capability would have got compromised [21]. To tackle this problem, we performed 5-fold cross validation in SVM program. In this procedure, we divided all samples into five sets. For each analysis, one set was considered as testing data whereas the remaining sets were considered as training data.
Cluster analysis by combining miRNA with mRNA expression profiling to validate the identified potential COPD-related genes
To validate the potential COPD-related genes involved in the network, we performed cluster analysis by combining miRNA with mRNA expression profile of 19 patients using Similarity Network Fusion (SNF) method [22]. SNF is a multi-omics data processing method in which the similarities between patients from different data types are integrated by a cross-network diffusion process to construct the fusion patient similarity matrix. After clustering 19 COPD patients to three clusters (subtypes), we extracted top 50 most significant differentially expressed genes distinguishing each of three clusters from normal smokers respectively, and the overlapped genes of three gene sets were extracted. Figure 1 illustrates the flowchart of our work in this analysis.
The flowchart of our work. Firstly, we identified the differentially expressed miRNAs and mRNAs. Secondly, by integrating three miRNA-target sources, we performed canonical correlation analysis to identify potential COPD-related miRNAs and mRNAs. Thirdly, we constructed and expanded miRNA-mRNA network. Finally, for miRNAs involved in the network, we performed GO functional enrichment analysis of their targets. We also performed the validation of potential COPD-related genes involved in the consturction network, including ROC curve analysis, SVM classification, and cluster analysis.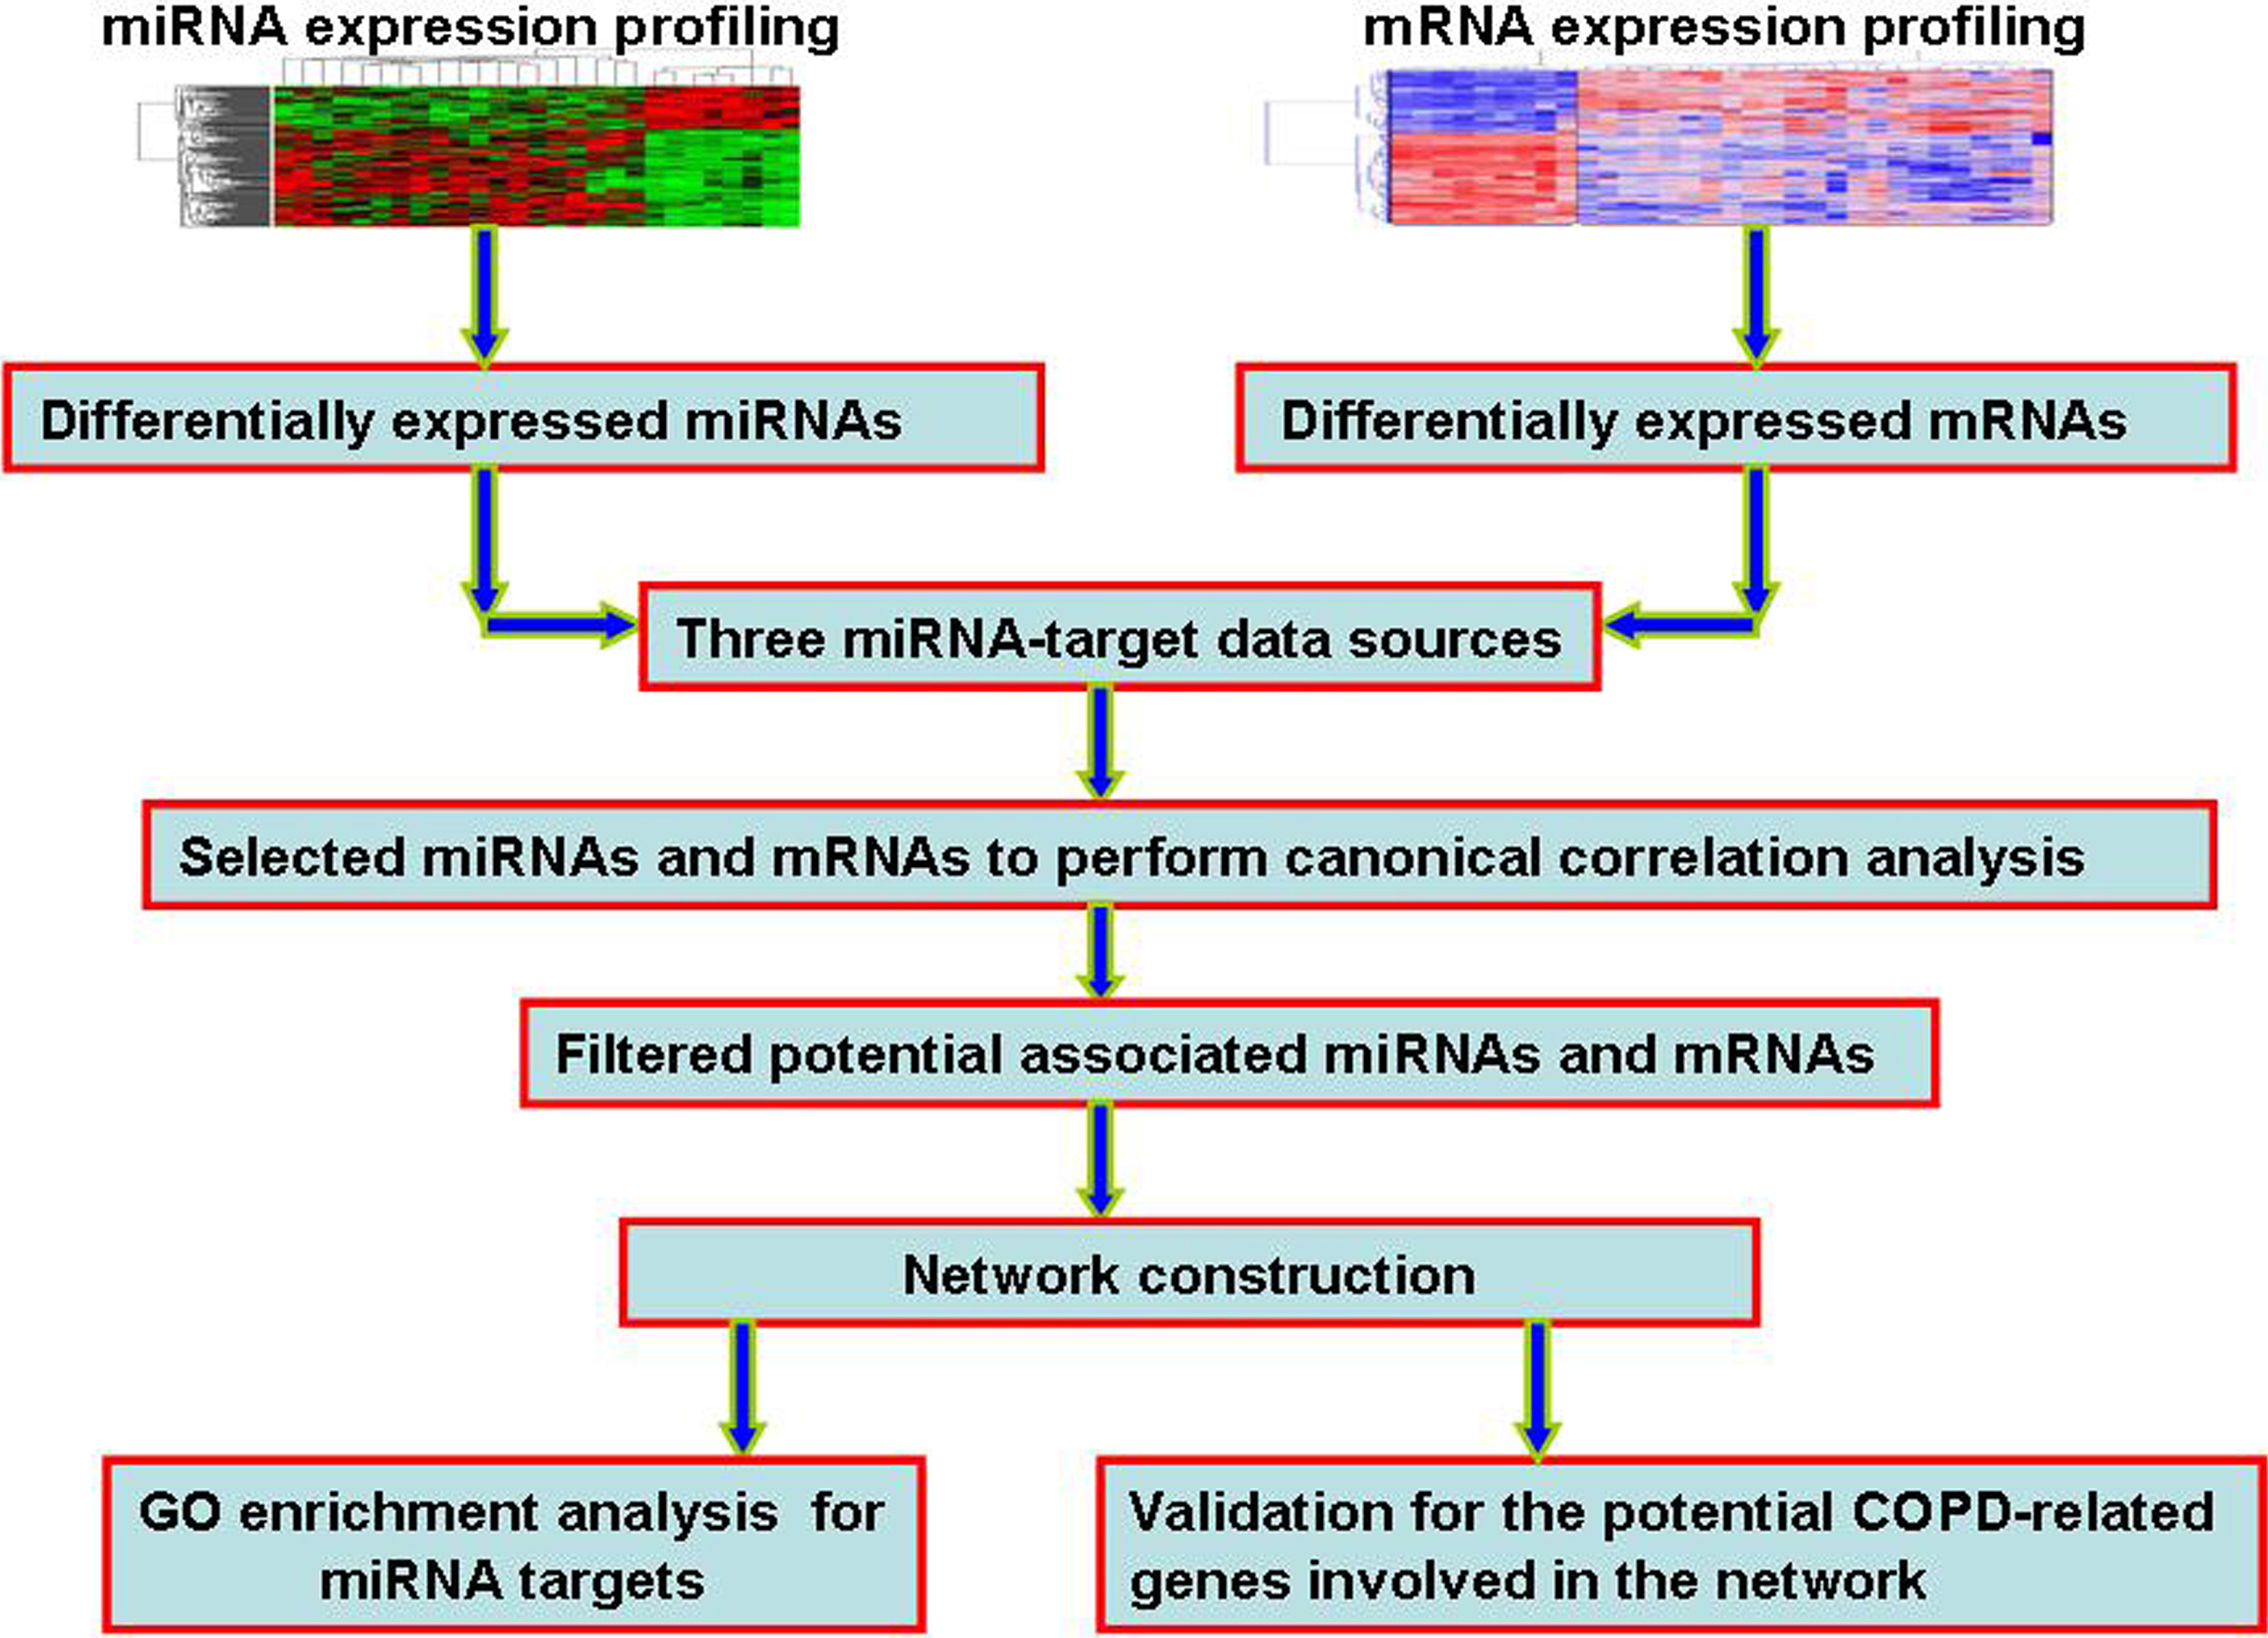
Canonical Correlation analysis
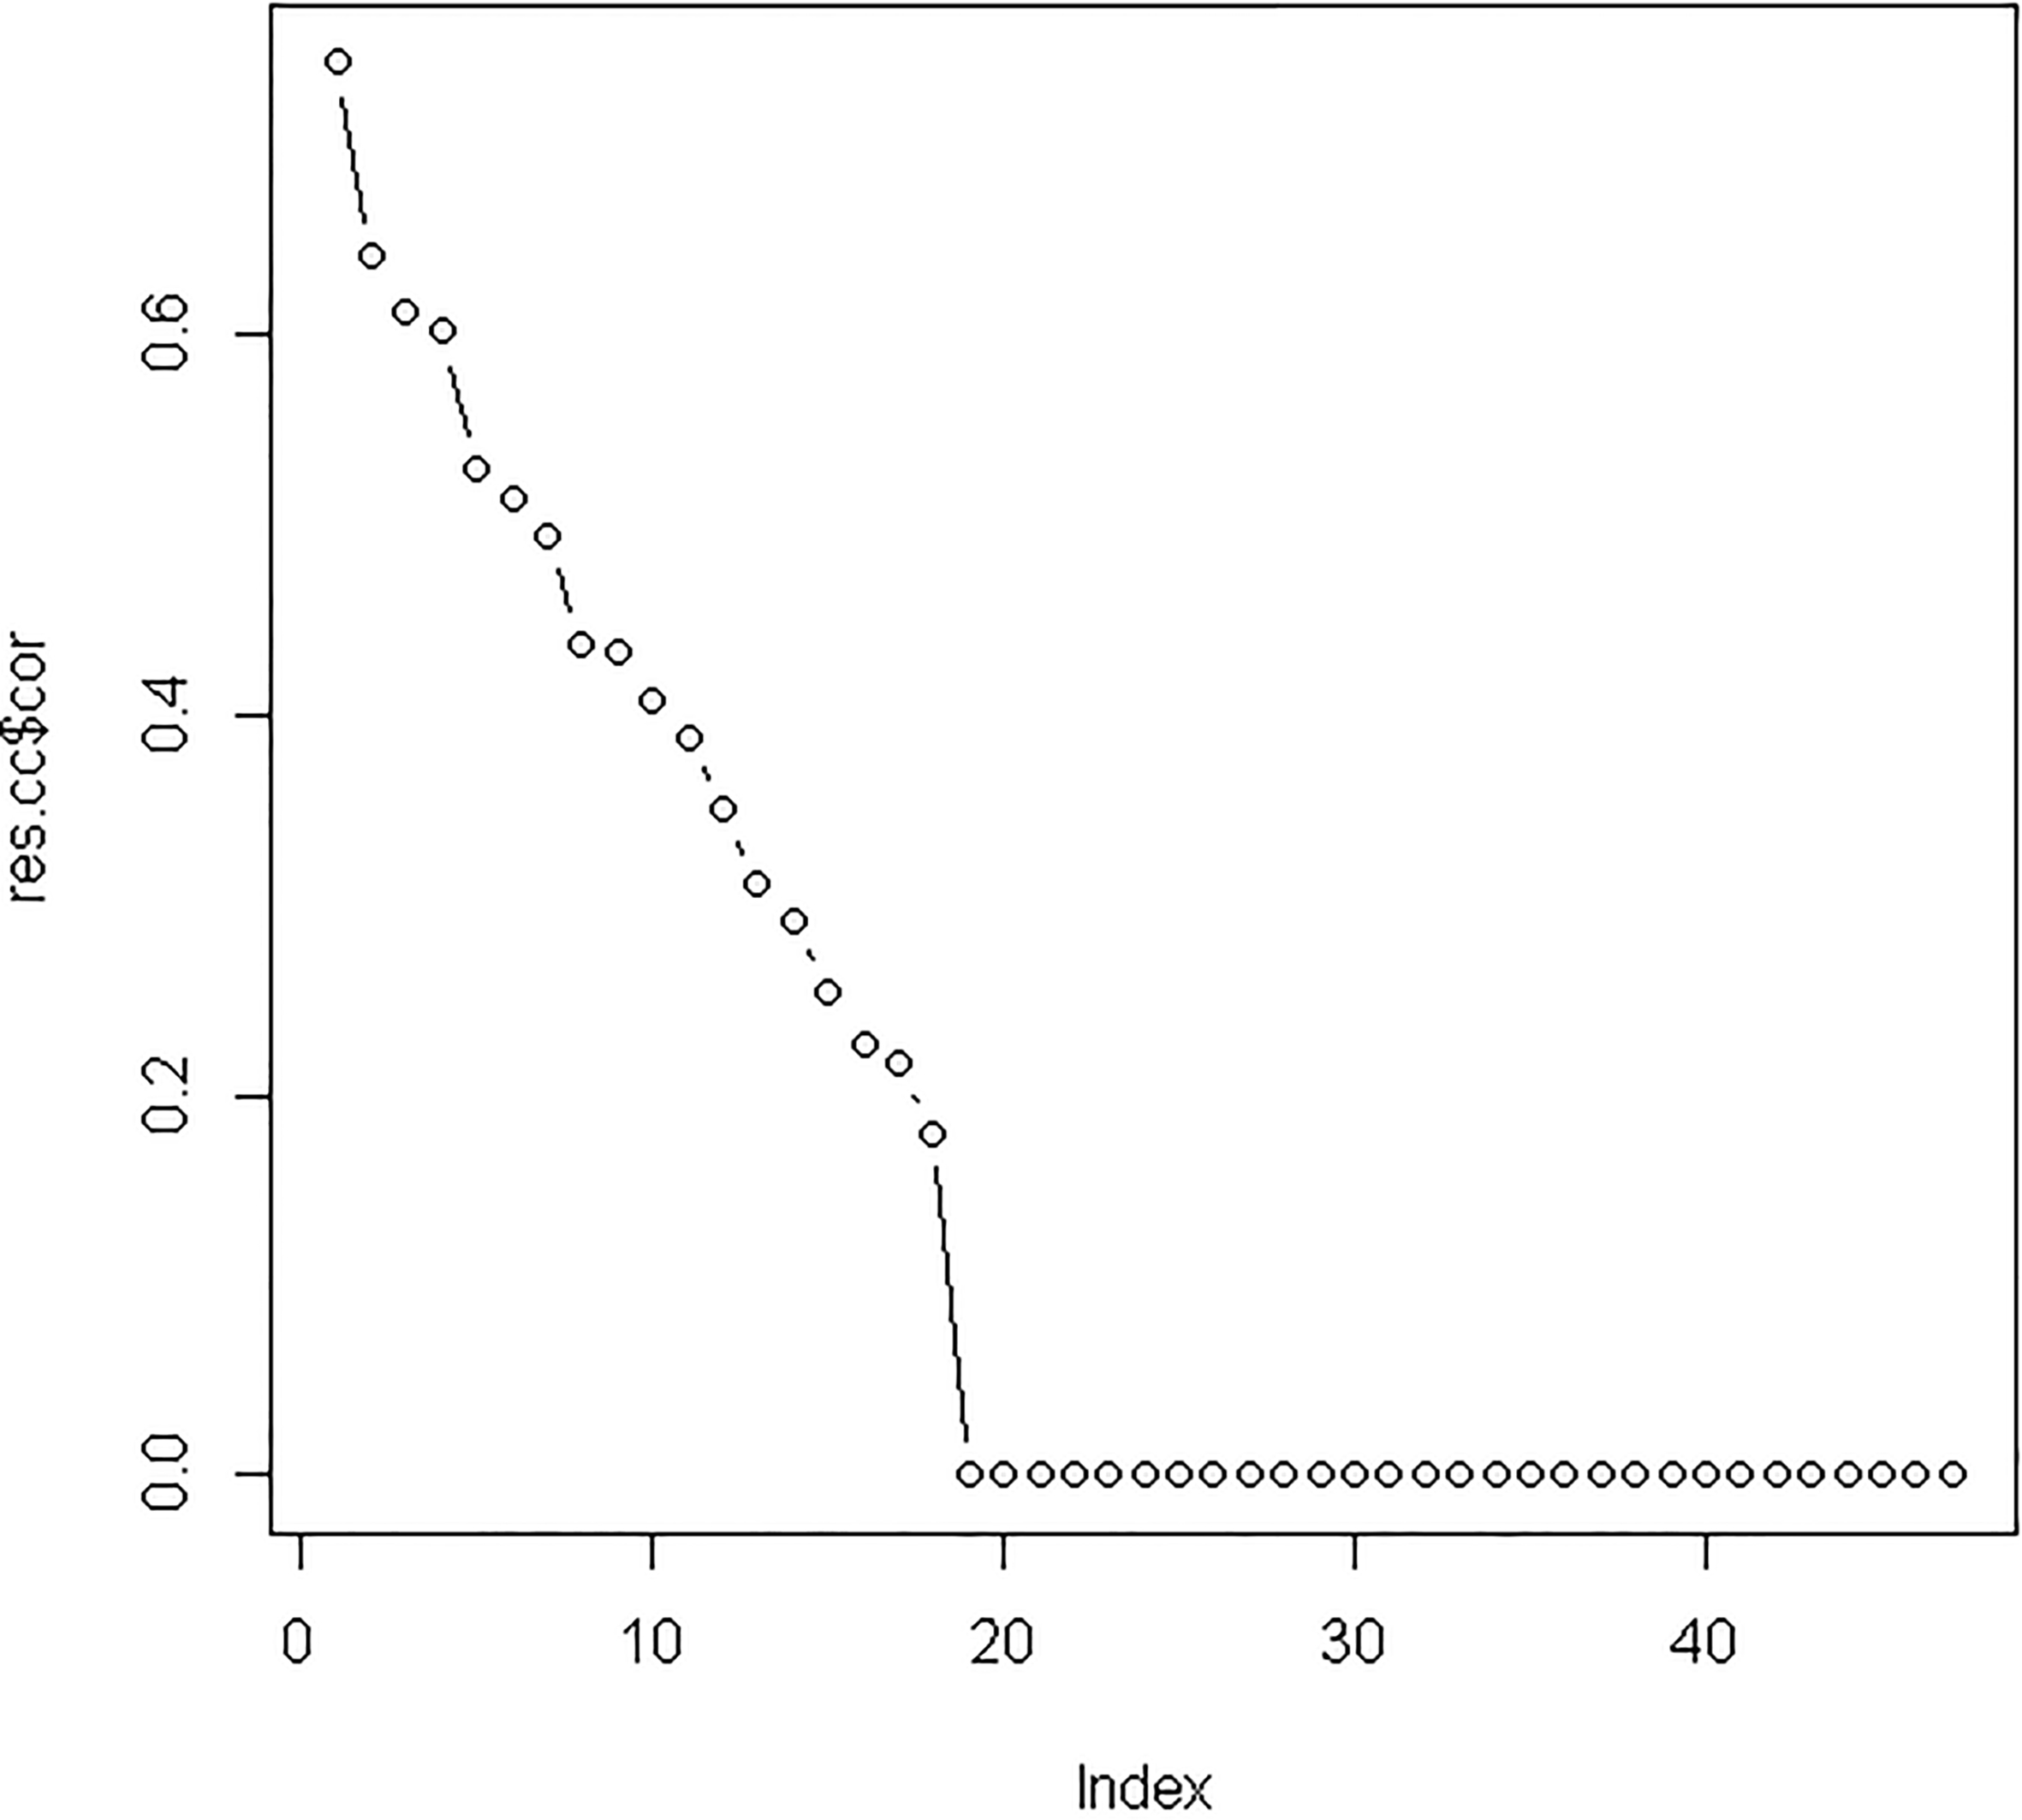
After integrating three miRNA-target sources into differentially expressed miRNAs and mRNAs, we used 47 differentially expressed miRNAs and 85 differentially expressed mRNAs to perform canonical correlation analysis. Based on leave-one-out criterion, we found that the optimal values of two regularization parameters were 0.25 and 0.75, respectively. After performing regularized canonical correlation, we obtained the four matrixes: the correlation between miRNA and miRNA canonical variables; the correlation between mRNA and miRNA canonical variables; the correlation between miRNA and mRNA canonical variables and the correlation between mRNA and mRNA canonical variables. For these four matrixes, we selected the correlation coefficients of the original variable and the first canonical variable because the first canonical variable had the highest canonical correlation coefficient of 0.74 (see Supplementary Fig. 1). We identified 13 miRNAs and 26 mRNAs with correlation coefficients
The constructed miRNA-mRNA regulation network. In this graph, blue circles indicate target genes involved in three miRNA-target databases, and the orange circles indicate added target genes involved in significant miRNA-mRNA pairs. Black lines indicate miRNA-mRNA relationships involved in three miRNA-target databases, and red lines indicate added miRNA-mRNA relationships involved in significant miRNA-mRNA pairs. 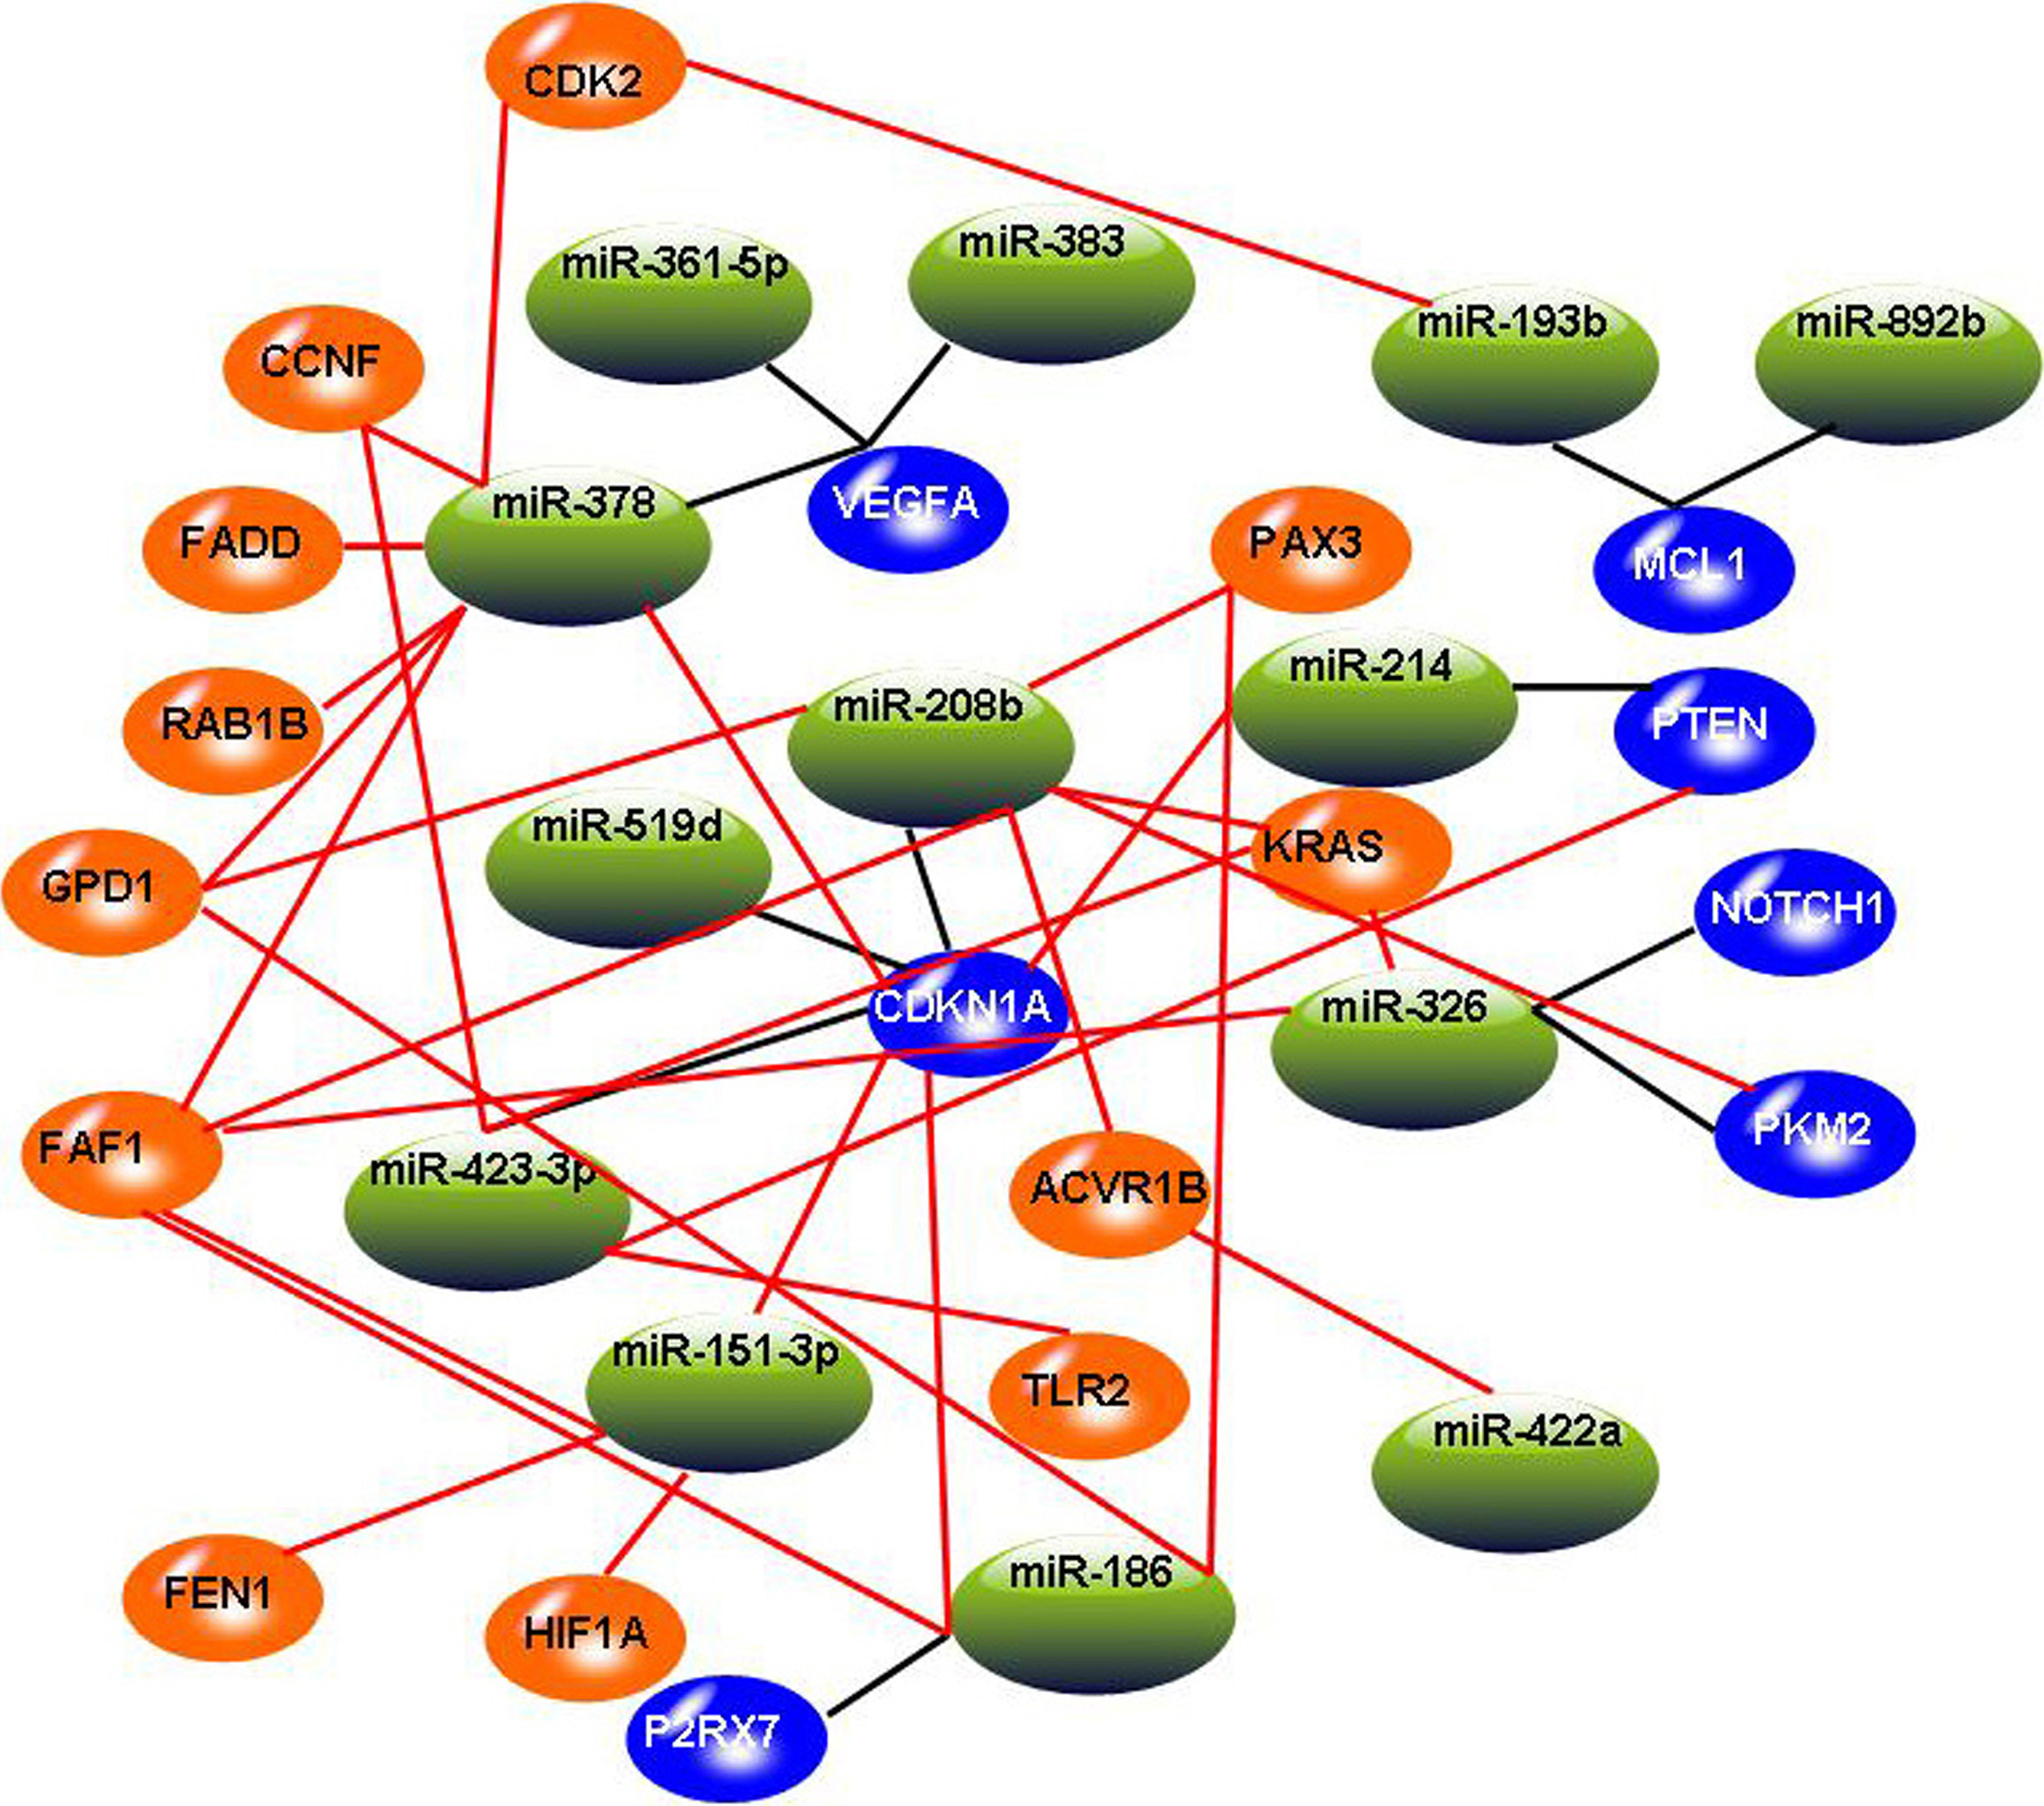
After identifying 13 miRNAs and 26 mRNAs by canonical correlation analysis, we expanded the network by adding miRNA-mRNA pairs identified by Spearman rank correlation test. According to the criterion of
GO function enrichment analysis of target genes of miR-208b (A) and miR-378 (B). The significant GO terms about BP were shown in different colors. The cooler colors indicate more significant GO terms (The p-values displayed in the graph were not adjusted).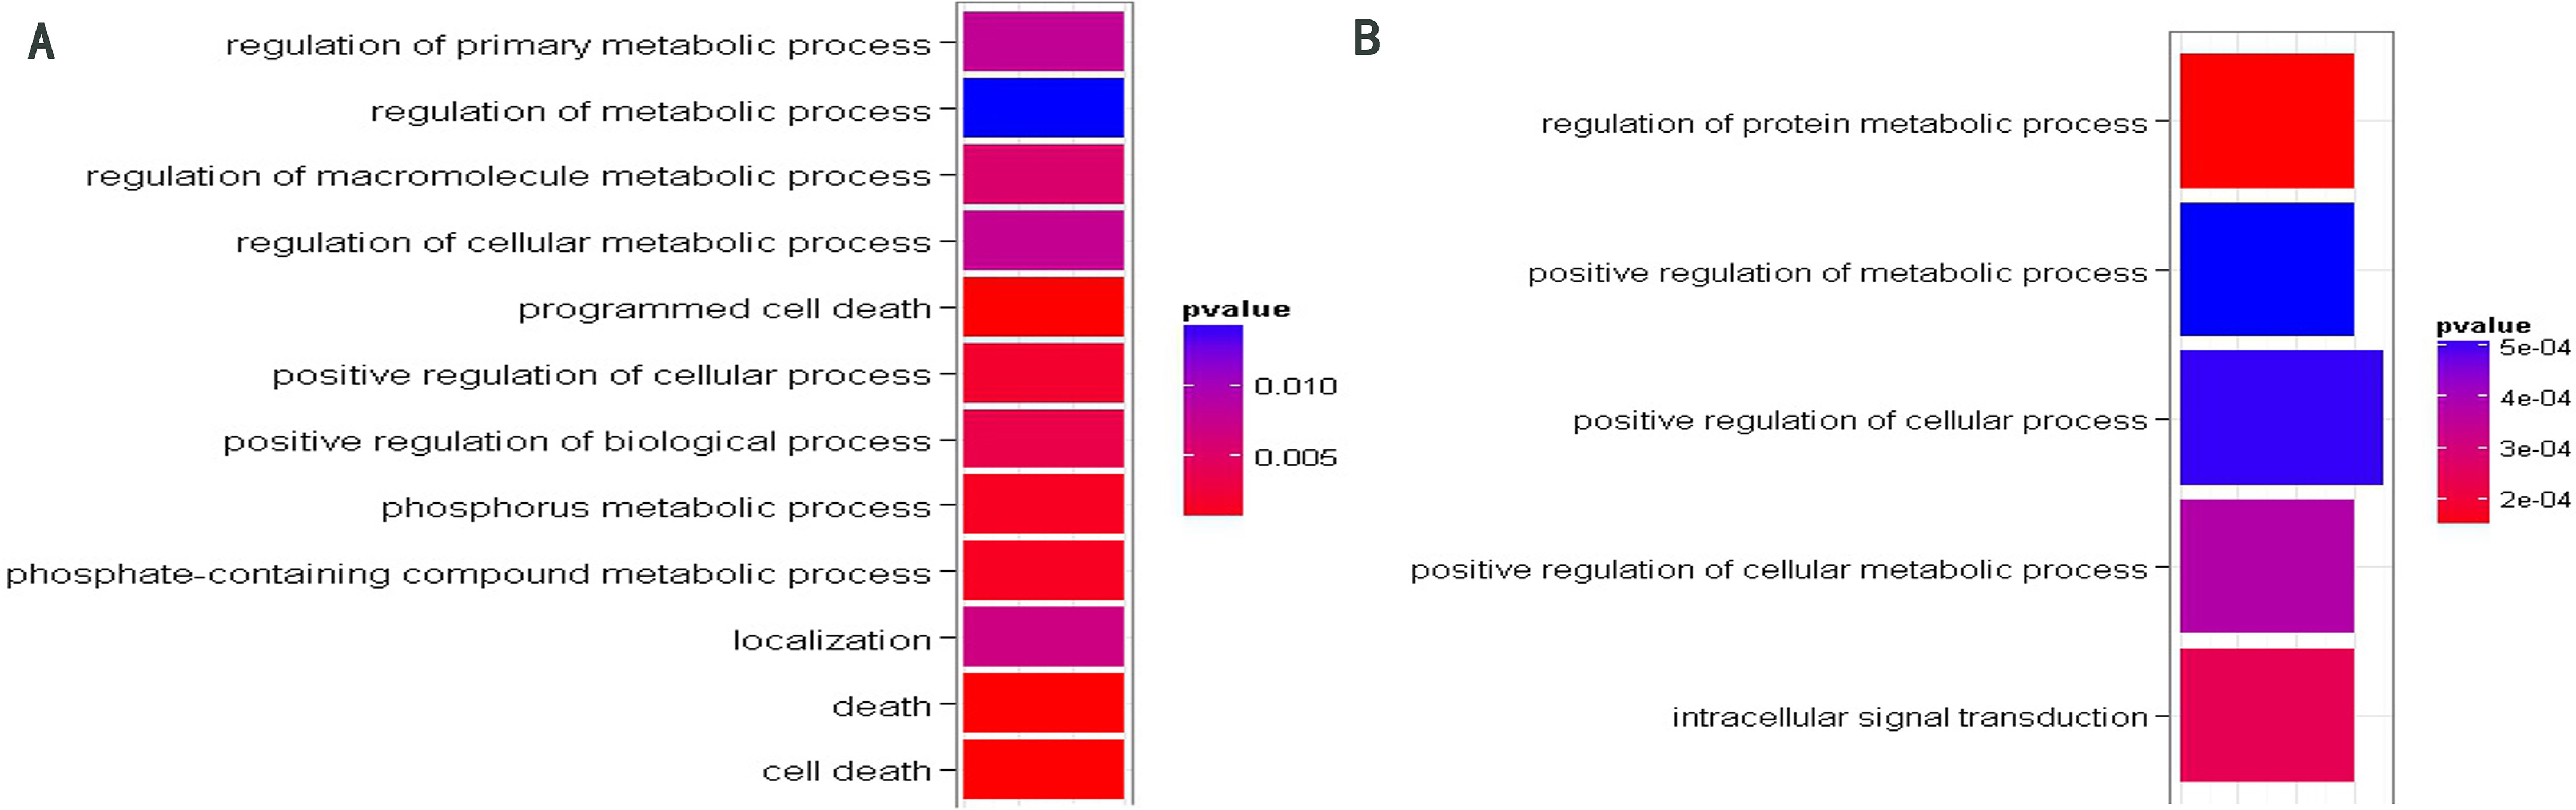
The classification performance analysis for four genes that overlap with COPD-related genes recognized in OMIM database. (A) Four overlapped genes: HIF1A, KRAS, PTEN and TLR2. (B) The ROC curve analysis for four genes. (C) The classification accuracy rate of four genes based on SVM method. (D) The SVM classification plot for HIF1A and KRAS. 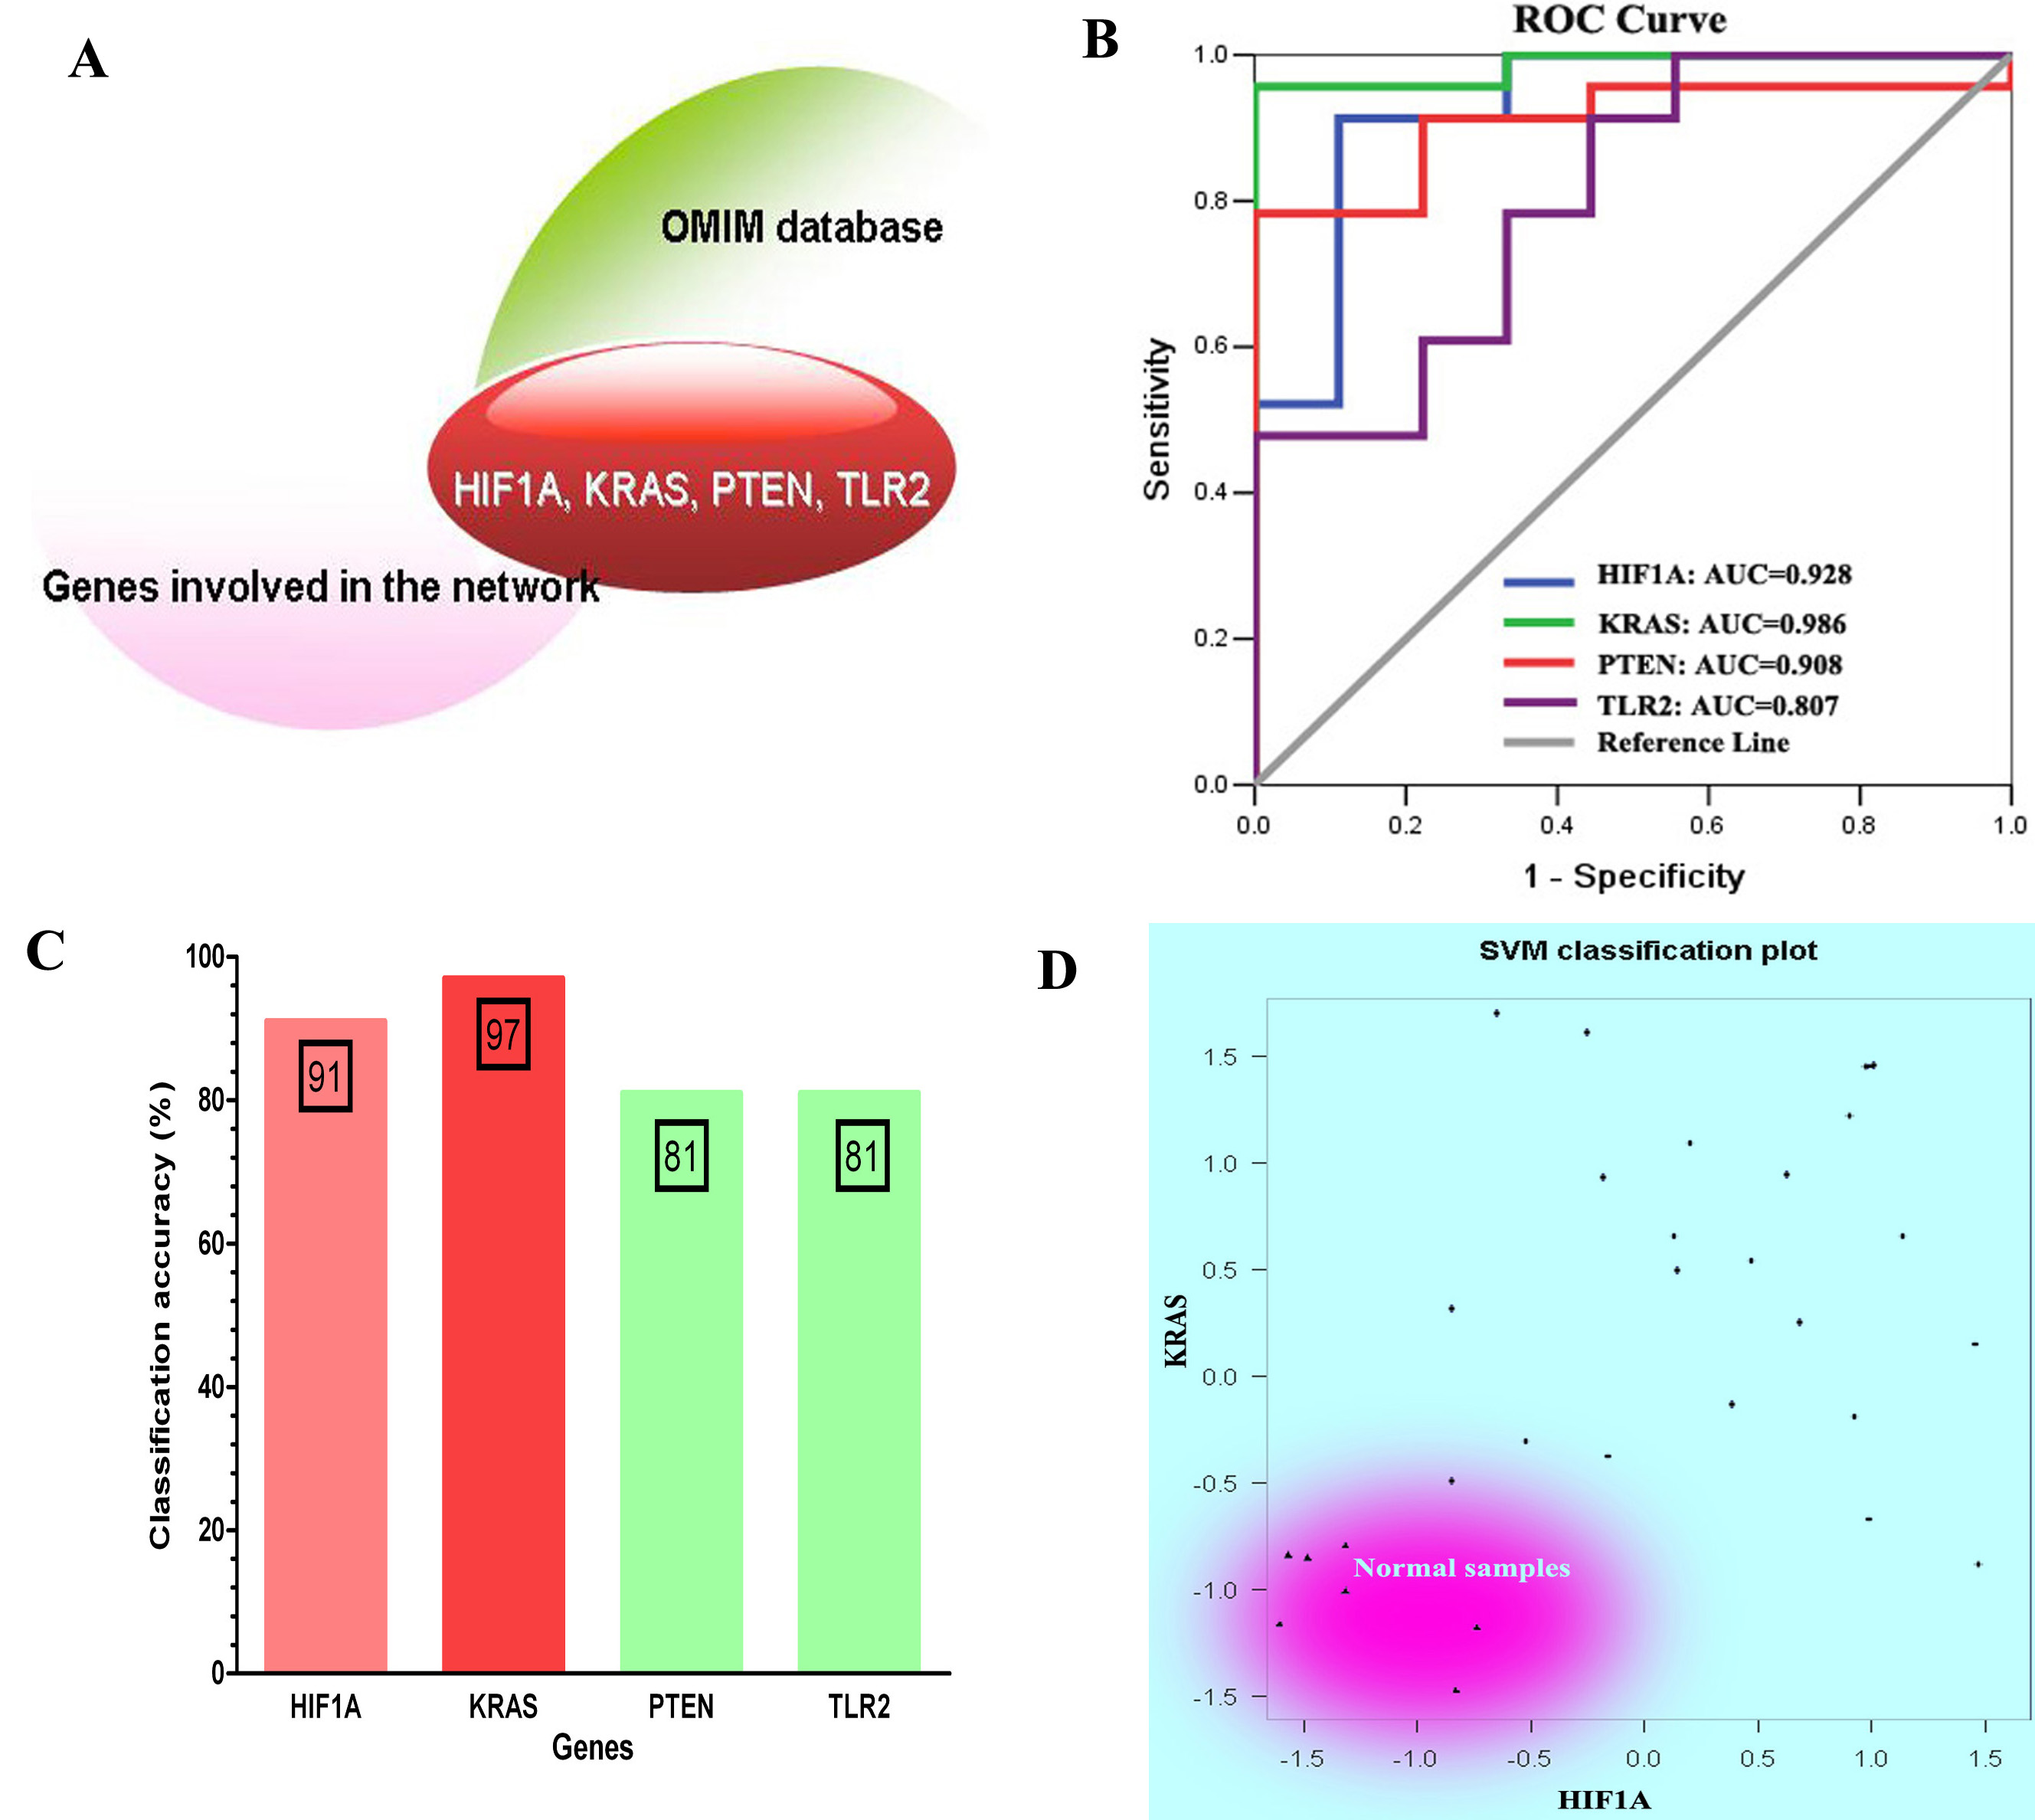
For each miRNA, we performed the Gene Ontology (GO) function enrichment analysis of their target genes involved in the network. Only target gene sets of miR-378 and miR-208b were enriched with some significant GO terms (see Supplementary Table 1). Figure 3 illustrates significant GO terms about biological process (BP). As shown in Fig. 3, the target genes of miR-208b were enriched on cell death and metabolic process. In a previous study conducted on mice, we found that in pulmonary endothelial or epithelial cells, the direct induction of cell apoptosis was accompanied with emphysematous changes. This implies that there are defects in these clearance mechanisms, and many evidences prove that such defects are quite common in patients with COPD [32]. Furthermore, target genes of miR-208b were enriched on GO term “localization” (GO: 0051179), which is defined as any process in which a cell, a substance, or a cellular entity is transported, tethered to, or otherwise maintained in a specific location. In practice, “localization” may also be achieved via selective degradation. In a recent COPD-related study, we found that interstitial PTX3 levels were not correlated with mRNA transcripts of whole tissue. These results indicate the lack of selection of cells relevant for PTX3 production at the chosen anatomical sites. In other words, PTX3 levels reflect selective degradation or post-transcriptional regulation [33]. Other significant functions of target genes of miR-208b and miR-378 focus on the metabolic process. In practice, we reported that skeletal muscle proteins become mobilized during inflammation. In COPD patients, the increased levels of acute phase proteins are correlated with an enhanced resting metabolic rate and fat free mass (FFM) loss [34].
To determine whether the genes involved in the constructed network were potential COPD-related genes, we manually selected genes that overlapped with COPD-related genes included in OMIM database. We found 6 genes (HIF1A, KRAS, P2RX7, PTEN, TLR2 and VEGFA) which have been approved to be associated with COPD (see Fig. 4A). Meanwhile, the area under ROC curve (AUC) of four genes (HIF1A, KRAS, PTEN, and TLR2) was greater than 0.8, which can be used as an indicator to detect COPD in patients (see Fig. 4B). By considering the expression of these four genes as prediction variables, we classified samples by SVM method. The classification accuracy rate of HIF1A, KRAS, PTEN, and TLR2 were 91%, 97%, 81%, and 81%, respectively (see Fig. 4C). In particular, we used SVM classification plot to determine classification performance of two genes (HIF1A and KRAS) that show higher classification accuracy rate than the other two genes. The two-dimensional classification diagram showed a good classification performance in which normal smokers were distinguished well from COPD patients (see Fig. 4D).
As shown in Fig. 5, significant regulation (
Scatter dot plots of significant regulation (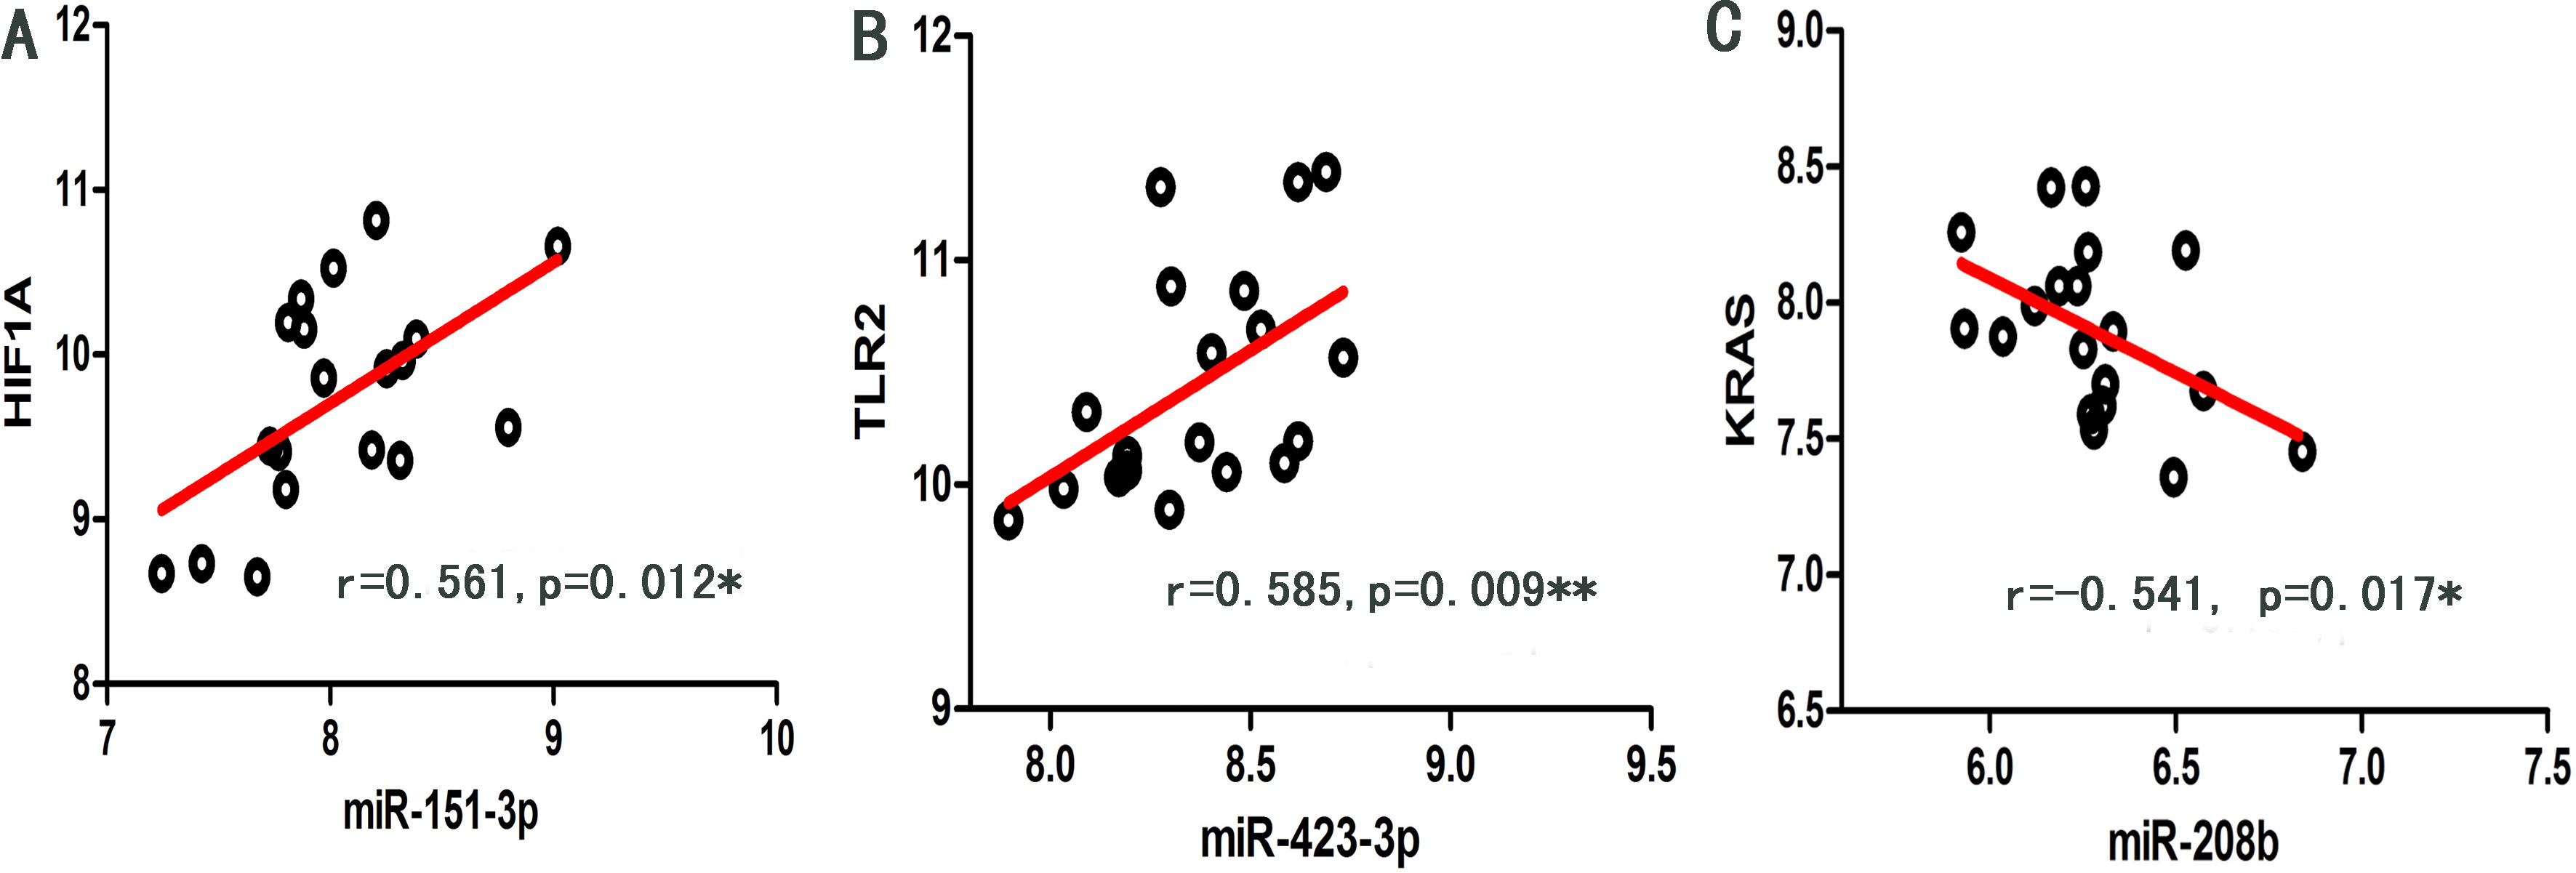
To validate the potential COPD-related genes involved in the network, we performed cluster analysis by combining miRNA with mRNA expression profile of 19 COPD patients based on SNF method. The results indicate that 19 COPD patients were divided into three clusters: A heatmap (Fig. 6A) and a silhouette plot (Fig. 6B) describe these three clusters. Cluster 1, cluster 2 and cluster 3 include 4, 7 and 8 COPD patients respectively. A higher silhouette score indicates that there is greater similarity between samples of the same cluster. In this analysis, silhouette score of cluster 1 was the highest (S
(A) Heatmap of cluster analysis based on SNF method. (B) Silhouette plot of three clusters. Silhouette score indicates the consistency within clusters of data. (C) The common genes: PTEN, VEGFA and KRAS, were shared by three top 50 differentially expressed genes sets. 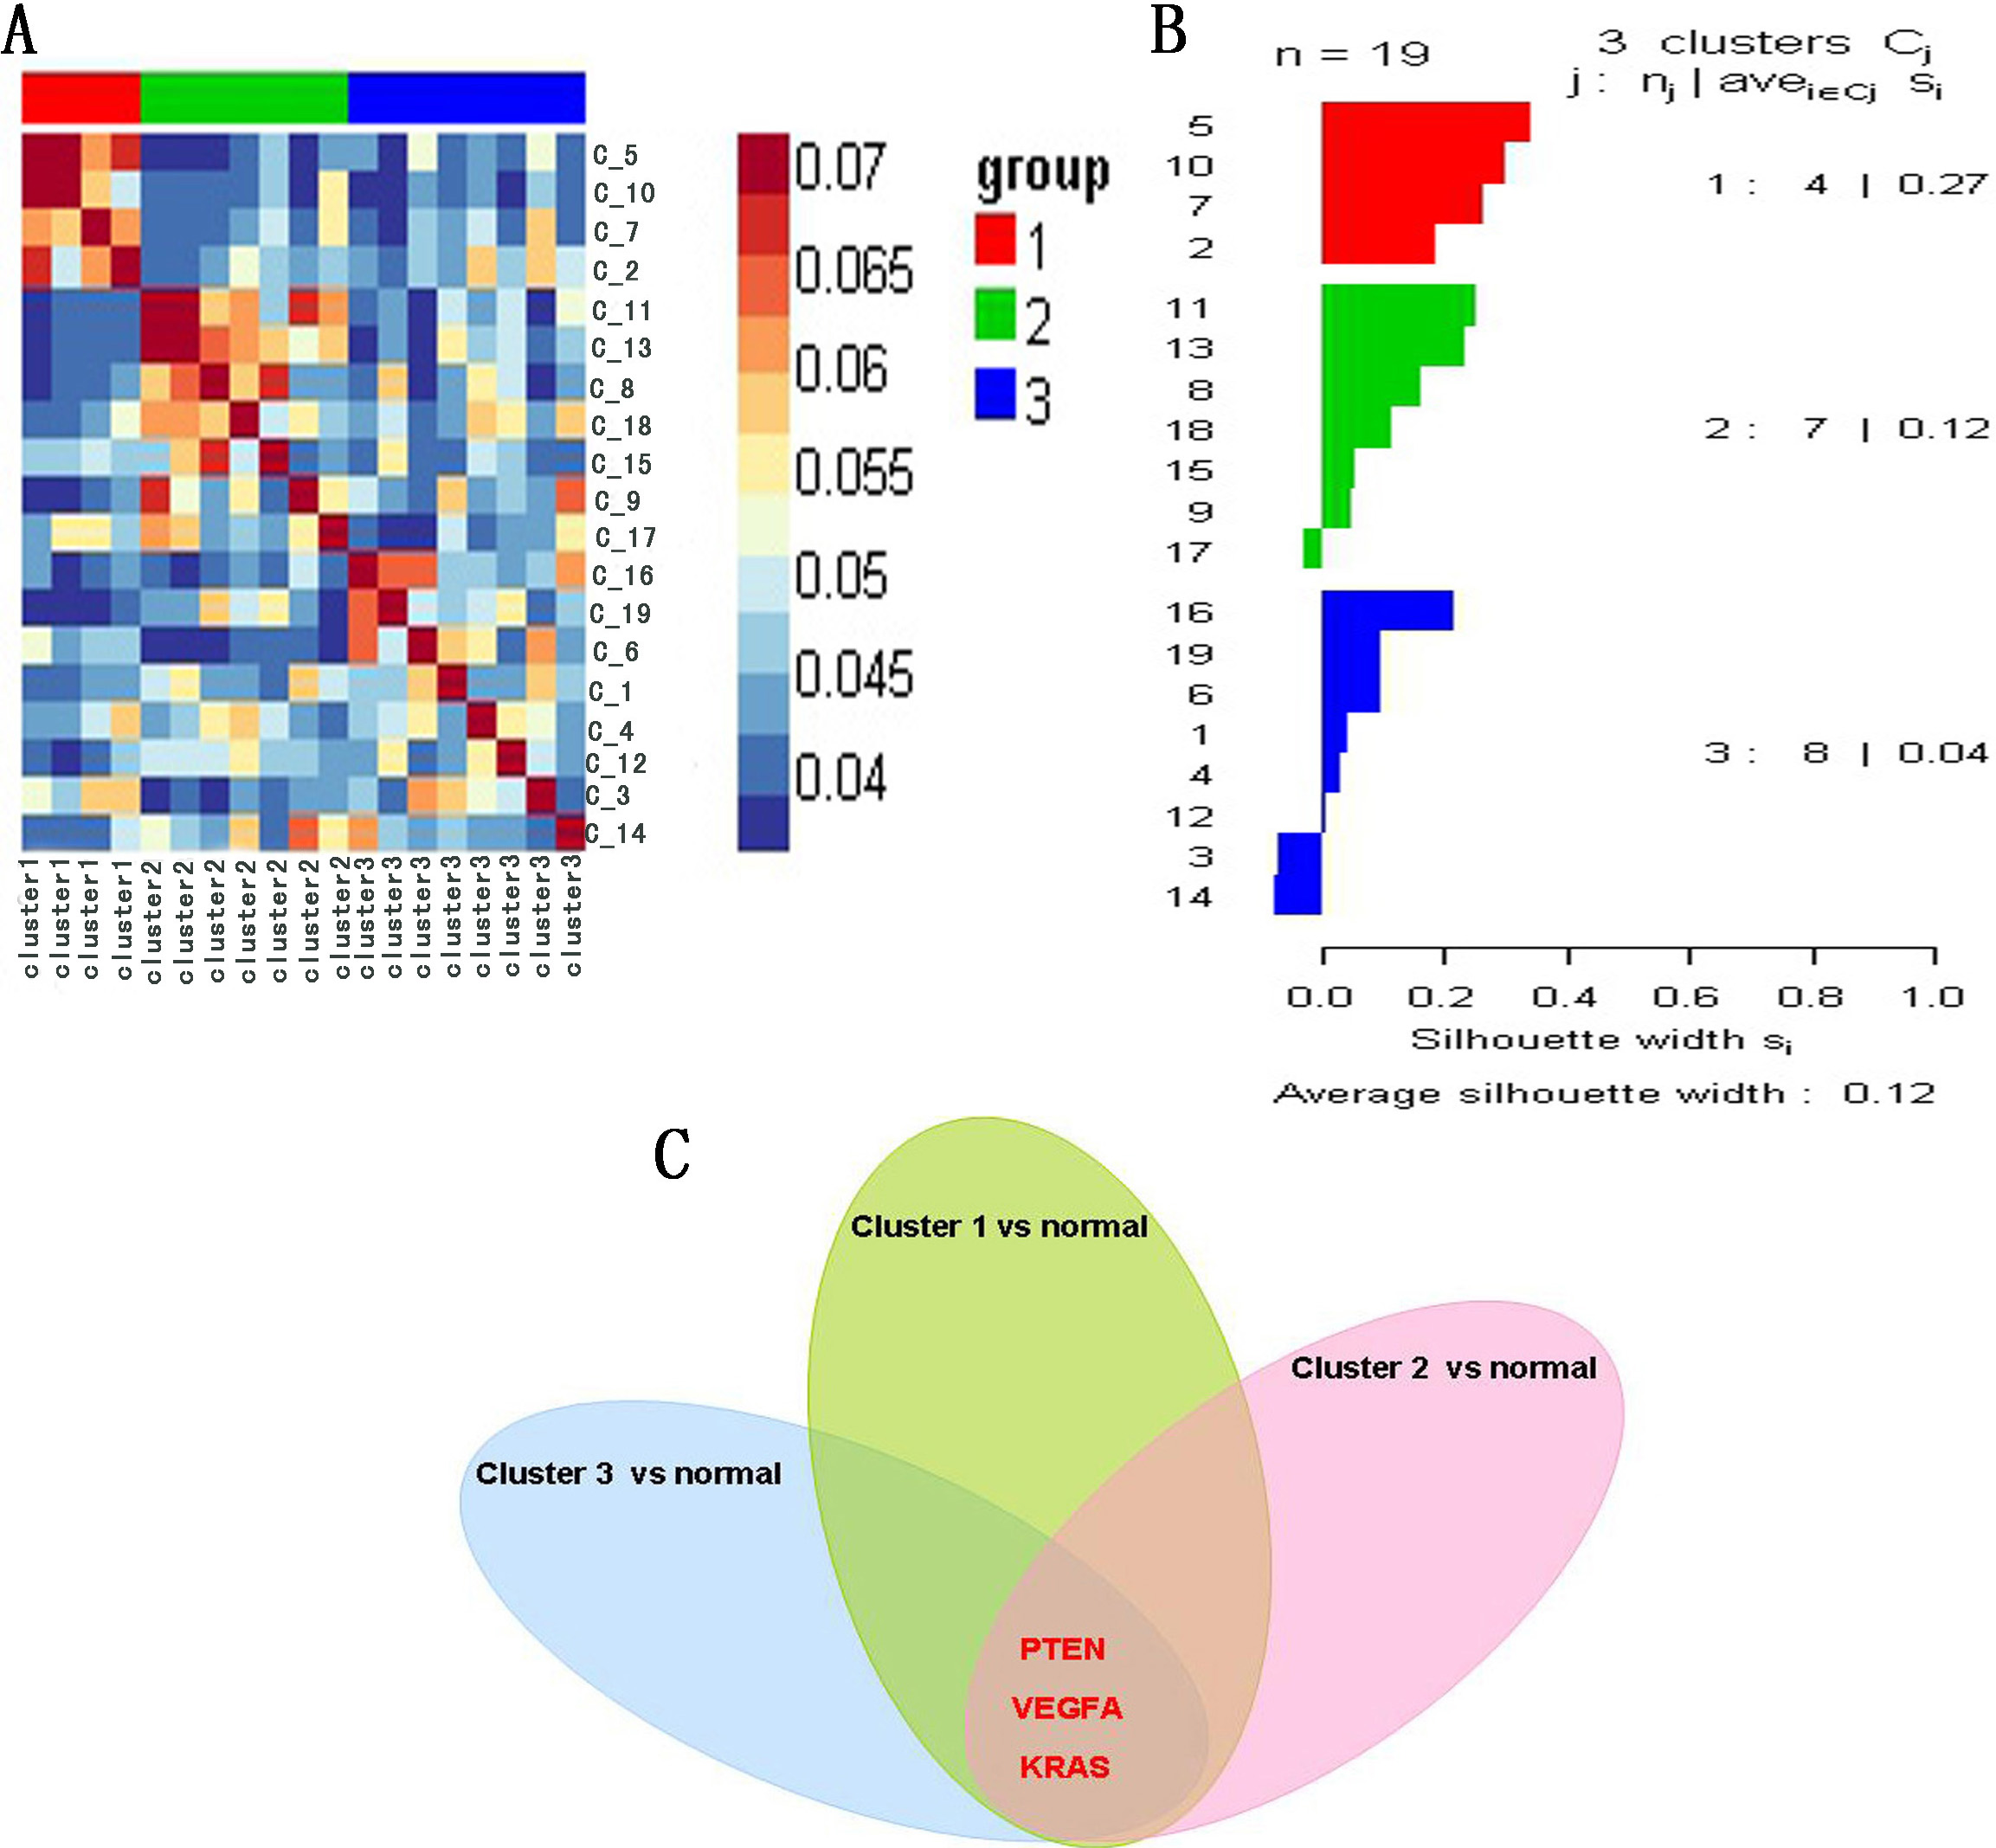
Currently, many studies have established that genetic, epigenetic, and environmental factors are risk factors responsible for the incidence and progression of COPD in general population. By performing integration data analysis, the key regulators of COPD can be identified. In the past few years, many studies have shown that miRNA-mRNA dysregulation leads to the metastasis of cancers [37]. Previous studies have reported about the effects of smoke exposure on the expression of miRNA; however, these studies have provided little information about the role of miRNAs in COPD ci38. Very few studies have reported about how miRNA-mRNA dysregulation triggers COPD in patients, because very less data is available about miRNA-mRNA dual expression profile till date. In the present study, we conducted canonical correlation analysis to extract the potential COPD-related genes: the miRNA-mRNA dual expression profile data was analyzed to determine miRNA-mRNA association with COPD. The identified genes were found to be strongly associated with the susceptibility of COPD in patients, and this observation was supported by previous and recent evidences. By performing integrative data analysis of miRNA-mRNA dual expression profile, we found that miRNA-mRNA regulation played a pivotal role in the incidence and progression of COPD. Furthermore, the novel COPD-related key regulators and biomarkers could be directly identified by this analysis.
Canonical correlation analysis (CCA) does have some limitations. Because CCA is based on linear transformations, it has limited applications in biomedical sciences. Furthermore, some identified potential biomarkers may be identified as false positive predictors by CCA. Recently, non-linear canonical correlation analysis has been developed; this technique applies non-linear functions to original variables in order to extract correlated components from two sets of variables [39]. In future studies, we will consider some new methods to implement this analysis. Another important limitation of this study is as follows: we only selected the validated miRNA-target regulations in databases, and many predicted miRNA-target regulations were not come into the analysis. Our method also does not identify regulation by translation inhibition. In addition, one of the major limitations of our analysis is the fact that there are very few miRNA-mRNA dual expression profiles related to COPD. As we know, unconvincing results are obtained by analyzing small sample sizes. In this study, we used algorithms that effectively analyzed high-dimensional data from small sample sizes, such as SAM, RCC, and SNF. Thus, we ensured that reliable results could be obtained from this analysis. We hope that more miRNA-mRNA dual expression profiles related to COPD would be available in the near future. These COPD-related profiles can then be used to perform similar analysis and to validate these results. In our current study, the identified COPD-related biomarkers were not validated by biological assays. In future studies, molecular biology experiments must be conducted to validate the findings of our study.
Another limitation of this study is that the multiple testing was not performed when filtering miRNA-mRNA pairs based on spearman correlation test. In fact, multiple testing procedures play an important role in detecting the presence of correlation. False Discovery Rate (FDR) is one of the multiple testing methods. The simple FDR estimation can be computed from p-values using Benjamini-Hochberg procedure. In this way, small p-values result in small FDR estimates. In our current study, the most significant miRNA-mRNA pairs with the smallest p-values were kept in the network. However, we could not ascertain whether those extracted miRNA-mRNA pairs that were not able to pass multiple testing were significant, and they might be the false positive discoveries.
Moreover, some studies that were based on network analysis have reported the following results: they found that the expressions of genes with differential methylation regions (DMRs) were highly negatively correlated with corresponding DNA methylations levels. This indicates that DNA methylation plays an important role in the incidence and progression of diseases [40]. Indeed, the high-throughput sequencing data analysis and the global DNA methylation analysis of airway epithelia in COPD have found some genes that are hyper-methylated and down-regulated in COPD, such as VEGFA, which is regulated by miR-378, miR-361-5p and miR-383 [41]. In the current study, we did not identify methylation events because the matched COPD-related DNA methylation data are lacking. In fact, it is preferable to combine multiple data types rather than exploiting them separately; this will be an effective strategy to identify biomarkers related to COPD. In future studies, the underlying mechanism governing complex molecular regulation must be investigated by integrating multiple data types, such as DNA methylation data, somatic mutation data, and copy number data of biological networks. These studies will help researchers to have a better understanding of biological factors, which can be used for further experimental validations and discoveries of COPD biomarkers.
Footnotes
Acknowledgments
This work is supported by Beijing Natural Science Foundation (Grant No. 7142015), National Natural Science Foundation of China (Grant Nos. 31100905) and the foundation-clinical cooperation project of Capital Medical University (16JL58).
Conflict of interest
None to report.
Supplementary materials
GO function enrichment analysis for miRNAs targets
miRNA
Domains
GO ID
Description
p-value
Adjusted p-value
miR-378
CC
GO:0044444
Cytoplasmic part
2.3E-03
0.0259
CC
GO:0043234
Protein complex
4.0E-03
0.0259
CC
GO:0032991
Macromolecular complex
9.5E-03
0.0413
BP
GO:0051246
Regulation of protein metabolic process
1.4E-04
0.004
BP
GO:0035556
Intracellular signal transduction
2.4E-04
0.004
BP
GO: 0031325
Positive regulation of cellular metabolic process
3.8E-04
0.004
BP
GO: 0048522
Positive regulation of cellular process
5.1E-04
0.004
BP
GO: 0009893
Positive regulation of metabolic process
5.2E-04
0.004
MF
GO:0005515
Protein binding
1.1E-02
0.0317
miR-208b
BP
GO: 0012501
Programmed cell death
2.1E-05
0.0003
BP
GO:0008219
Cell death
4.3E-05
0.0003
BP
GO: 0016265
Death
4.4E-05
0.0003
BP
GO: 0006796
Phosphate-containing compound metabolic process
1.0E-03
0.0053
BP
GO: 0006793
Phosphorus metabolic process
1.1E-03
0.0053
BP
GO: 0048522
Positive regulation of cellular process
1.7E-03
0.0068
BP
GO: 0048518
Positive regulation of biological process
3.2E-03
0.011
BP
GO:0060255
Regulation of Macromolecule metabolic process
5.5E-03
0.016
BP
GO: 0051179
Localization
6.9E-03
0.017
BP
GO: 0031323
Regulation of cellular metabolic process
7.8E-03
0.017
BP
GO:0080090
Regulation of primary metabolic process
8.0E-03
0.017
BP
GO:0019222
Regulation of metabolic process
1.4E-02
0.029
The canonical correlation coefficients between the original variable and the canonical variables. The highest canonical correlation coefficient of 0.74 was seen from the original variable and the first canonical variable; therefore all of the correlation coefficients between the original variable and the first canonical variable were selected.