
Abstract
Finding a good query plan is key to the optimization of query runtime. This holds in particular for cost-based federation engines, which make use of cardinality estimations to achieve this goal. A number of studies compare SPARQL federation engines across different performance metrics, including query runtime, result set completeness and correctness, number of sources selected and number of requests sent. Albeit informative, these metrics are generic and unable to quantify and evaluate the accuracy of the cardinality estimators of cost-based federation engines. To thoroughly evaluate cost-based federation engines, the effect of estimated cardinality errors on the overall query runtime performance must be measured. In this paper, we address this challenge by presenting novel evaluation metrics targeted at a fine-grained benchmarking of cost-based federated SPARQL query engines. We evaluate five cost-based federated SPARQL query engines using existing as well as novel evaluation metrics by using LargeRDFBench queries. Our results provide a detailed analysis of the experimental outcomes that reveal novel insights, useful for the development of future cost-based federated SPARQL query processing engines.
Introduction
The availability of increasing amounts of data published in RDF has led to the genesis of many federated SPARQL query engines. These engines vary widely in their approaches to generating a good query plan [5,25,39,50]. In general, there exist several possible plans that a federation engine can consider when executing a given query. These plans have different costs in terms of the resources required and the overall query execution time. Selection of the best possible plan with minimum cost is hence of key importance when devising cost-based federation engines; a fact which is corroborated by a plethora of works in database research [27,29].
In SPARQL query federation, index-free (heuristics-based) [16,31,47] and index-assisted (cost-based) [9,11,13,17,20,26,28,30,36,43,49] engines are most commonly used for federated query processing [39]. The heuristics-based federation engines do not store any pre-computed statistics and hence mostly use different heuristics to optimize their query plans [47]. Cost-based engines make use of an index with pre-computed statistics about the datasets [39]. Using cardinality estimates as principal input, such engines make use of cost models to calculate the cost of different query joins and generate optimized query plans. Most state-of-the-art cost-based federated SPARQL processing engines [9,13,17,20,26,28,30,43,49] achieve the goal of optimizing their query plan by first estimating the cardinality of the query’s triple patterns. Subsequently, they use this information to estimate the cardinality of the joins involved in the query. A cost model is then used to compute the cost of performing different query joins while considering network communication costs. One of the query plans with minimum execution costs is finally selected for result retrieval. Since the principal input for cost-based query planning is the cardinality estimates, the accuracy of these estimates is crucial to achieve a good query plan.
The performance of federated SPARQL query processing engines has been evaluated in many recent studies [1–3,9,10,12,18,23,24,30,39–41,43,48] using different federated benchmarks [4,7,14,19,32,33,38,45,46]. Performance metrics, including query execution time, number of sources selected, source selection time, query planning time, continuous efficiency of query processing, answer completeness and correctness, time for the first answer, and throughput, are usually reported in these studies. While these metrics allow the evaluation of certain components (e.g., the source selection model), they cannot be used to evaluate the accuracy of the cardinality estimators of the cost-based federation engines. Consequently, they are unable to show how the estimated cardinality errors affect the overall query runtime performance of federation engines.
In this paper, we address the problem of measuring the accuracy of the cardinality estimators of federated SPARQL engines, as well as the effect of these errors on the overall query runtime performance. In particular, we propose metrics1
Our proposed metric is open-source and available online at
In summary, the contributions of this work are as follows:
We propose metrics to measure the errors in cardinality estimations of cost-based federated engines. These metrics allow a fine-grained evaluation of cost-based federated SPARQL query engines and uncover novel insights about the performance of these types of federation engines that were not reported in previous works.
We measure the correlation between the values of the novel metrics and the overall query runtimes. We show that some of these metrics have a strong correlation with runtimes and can hence be used as predictors for the overall query execution performance.
We present an empirical evaluation of five – CostFed [43], Odyessey [30], SemaGrow [9], LHD [49] and SPLENDID [13] – state-of-the-art cost-based SPARQL federation engines on LargeRDFBench [38] by using the proposed metrics along with existing metrics, affecting the query runtime performance.
The rest of the paper is organized as follows: In Section 2, we present related work. A motivating example is given in Section 3. In Section 4, we present our novel metrics for the evaluation of cost-based federation engines. In Section 5, we give an overview of the cardinality estimators of selected cost-based federation engines. The evaluation of these engines with proposed as well as existing metrics is shown in Section 6. Finally, we conclude in Section 7.
Metrics used in the existing federated SPARQL query processing systems,
In this section, we focus on the performance metrics used in the state-of-the-art to compare federated SPARQL query processing engines. Based on the previous federated SPARQL benchmarks [14,38,45] and performance evaluations [1–3,9,12,13,18,30,36,43,47,49] (see Table 1 for an overview), the performance metrics used for federated SPARQL engines comparison can be categorized as:
All of these metrics are helpful to evaluate the performance of different components of federated query engines. However, none of these metrics can be used to evaluate the accuracy of the cardinality estimators of cost-based federation engines. Consequently, studying the effect of estimated cardinality errors on the overall query runtime performance of federation engines cannot be conducted based on these metrics. To overcome these limitations, we propose metrics for measuring errors in cardinality estimations of triple patterns, joins between triple patterns, and overall query plan, and show how these metrics are affecting the overall runtime performance of federation engines.
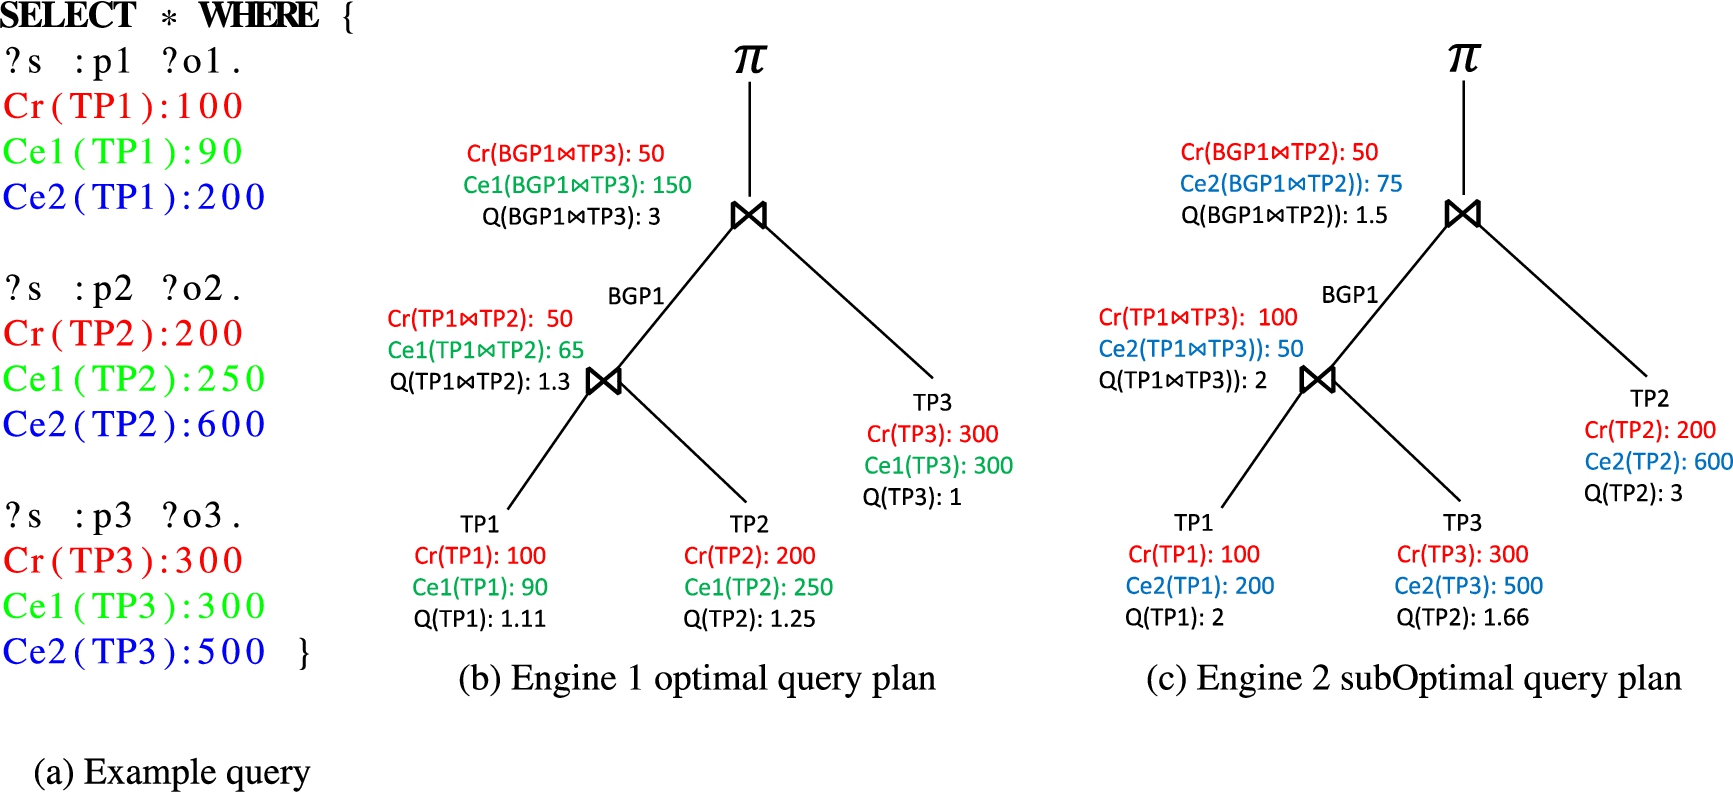
Motivating example: a sample SPARQL query and the corresponding query plans of two different federation engines.
In this section, we present an example to motivate our work and to understand the proposed metrics. We assume that the reader is familiar with the concepts of SPARQL and RDF, including the notions of a triple pattern, the joins between triple patterns, the cardinality (result size) of a triple pattern, and left-deep query execution plans. As aforementioned, most cost-based SPARQL federation engines first estimate individual triple pattern cardinality and use this information to estimate the cardinality of joins found in the query. Finally, the query execution plan is generated by ordering the joins. In general, the optimizer first selects the triple patterns and joins with minimum estimated cardinalities [43].
Figure 1 shows a motivating example containing a SPARQL query with three triple patterns – namely TP1, TP2 and TP3 – and two joins. Consider two different cost-based federation engines with different cardinality estimators. Figure 1(a) shows the real (
The motivating example clearly shows that good cardinality estimations are essential to produce a better query plan. The question we aim to answer pertains to how much the accuracy of cardinality estimations affects the overall query plan and the overall query runtime performance. To answer this question, the q-error (Q in Fig. 1) was introduced in [29] in the database literature. In the next section, we define this measure and propose new metrics based on similarities to measure the overall triple patterns error
Cardinality estimation-related metrics
Now we formally define the q-error and our proposed metrics, namely
q-error
The q-error is the factor by which an estimated cardinality value differs from the actual cardinality value [29].
(q-error).
Let
In this definition, over- and underestimations are treated symmetrically [29]. In the motivating example given in Fig. 1, the real cardinality of TP1 is 100 (i.e.,
The q-error makes use of the ratio instead of an absolute or quadratic difference and is hence able to capture the intuition that only relative differences matter for making planning decisions. In addition, the q-error provides a theoretical upper bound for the plan quality if the q-error of a query is bounded. Since it only considers the maximum value amongst those calculated, it is possible that plans with good average estimations are regarded as poor by this measure. Consider the query plans given in Fig. 1(b) and Fig. 1(c). Both have a q-error of 3, yet the query plan in Fig. 1(b) is optimal, while the query plan in Fig. 1(c) is not. To solve this problem, we introduce the additional metrics defined below.
Similarity errors
The overall similarity error of query triple patterns is formalised as follows:
(Triple Patterns Error
).
Let Q be a SPARQL query containing triple patterns
In the motivating example given in Fig. 1, the real cardinalities vector
(Joins Error
).
Let Q be a SPARQL query containing joins
(Query Plan Error
).
Let Q be a SPARQL query and
In the motivating example given in Fig. 1(b), the real cardinalities vector of all triple patterns and joins,
Selected federation engines
In this section, we give a brief overview of the selected cost-based SPARQL federation engines. In particular, we describe how the cardinality estimations for triple patterns and joins between triple patterns are performed in these engines.
Let D represent a dataset or source for short,
From these notations the cardinality
A recursive definition is used to define the SPARQL expression E [8,9] in the query planning phase and is defined as follows: all triple patterns are SPARQL expressions and if
Triple pattern cardinality is estimated as follows:
In these equations the
In this section, the letters with a question mark (e.g.
For single triple pattern cardinality estimation, the selectivity of each part is estimated as follows:
Given two triple patterns T1 and T2, LHD calculates the join selectivity by using the following equations:
Using the join selectivity values, join cardinality is estimated by the following equation:
VoID vocabulary:
SemaGrow contains a Resource discovery component, which returns the list of relevant sources to a triple pattern along with statistics. The statistics related to the data source include (1) the number of estimated distinct subjects, predicates and objects matching the triple pattern, and (2) the number of triple patterns in the data sources matching the triple pattern. The cardinality of a triple pattern is provided by the Resource Discovery component. On the other hand, for more complex expressions, SemaGrow needs to make an estimation based on available statistics. In order to estimate complex expressions based on the aforementioned basic statistics, SemaGrow adopts the formulas described by LHD [49]. The cardinality of each expression (E) in a data source S, is defined as
For estimating the join cardinality we need to calculate the join selectivity (
Odyssey represents
For arbitrary-shaped queries, Odyssey also considers the connections (links) between different CSs. Characteristic pairs (CPs) help in describing the links between Characteristic sets (CSs) using properties. For entities
In this section, we discuss the results we obtained in our evaluation. All results are also available at the project homepage. First, we evaluate our novel metrics in terms of how they are correlated with the overall query runtime performance of state-of-the-art federated query engines. Thereafter, we compare existing cost-based SPARQL federation engines using the proposed metrics and discuss the evaluation results.
Experiment setup and hardware
We used all queries except the large data queries (L1–L10) in our experiments. The reason for not using L1–L10 was that the evaluation results presented in [38] show that most engines are not yet able to execute these queries. LargeRDFBench comprises of 13 real-world RDF datasets of varying sizes. We loaded each dataset into a Virtuoso 7.2 server.
Regression experiments
Throughout our regression experiments, our null hypothesis was that there is no correlation between the runtimes of queries and error measurements (i.e., q-error or similarity error) used in the experiments. We began by investigating the dependency between the metrics we proposed and the overall query runtime performance of the federation engines selected for our experiments. Figure 2 shows the results of a simple linear regression experiment aiming to compute the dependency between the q-error and similarity errors and the overall query runtimes. For a particular engine, the left figure shows the dependency between the q-error and overall runtime while the right figure in the same row shows the result of the correlation of runtime with similarity error. The higher coefficients (dubbed R in the figure) computed in the experiments with similarity errors suggest that it is likely that the similarity errors are a better predictor for runtime. The positive value of the coefficient suggests that an increase in similarity error also means an increase in the overall runtime. It can be observed from the figure that outliers are potentially contaminating the results. Hence, we applied robust regression [21,35,37] using the Huber loss function [22] in a second series of experiments to lessen the effect of the outliers on the results (especially for q-errors) (see Fig. 3). We observe that after removing outliers using robust regression, the average R-values of the similarity-based error correlation further increases. The lower p-values in the similarity-error-based experiments further confirm that our metrics are more likely to be a better predictor for runtime than the q-error. The reason for this result is that our measure exploits more information and is hence less affected by outliers. This is not the case for the q-error, which can be perturbed significantly by a single outlier.

q-error and similarity error vs. runtime (simple linear regression analysis). The grey shaded areas represent the confidence intervals (bands) in regression line.

q-error and similarity error vs. runtime (robust regression analysis). The grey areas represent the confidence intervals (bands) in regression line.
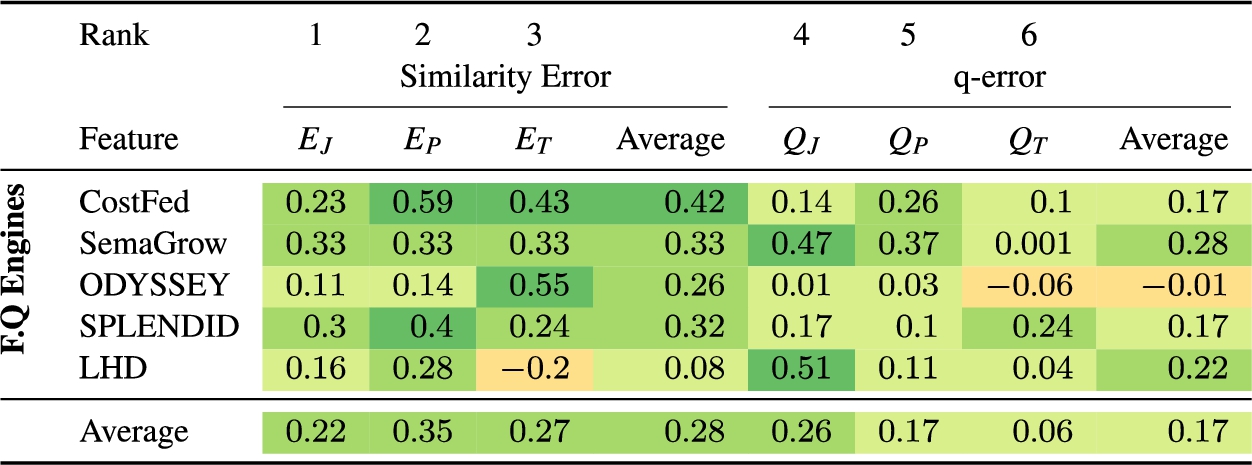
Spearman’s rank correlation coefficients between query plan features and query runtimes for all queries
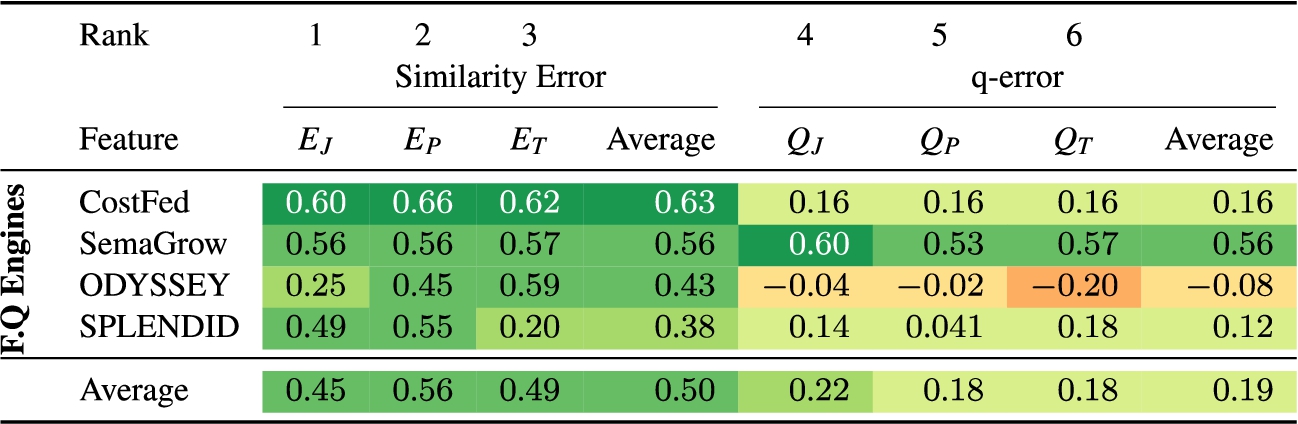
Spearman’s rank correlation coefficients between query plan features and query runtimes after linear regression (only for common queries between all systems)

Spearman’s rank correlation coefficients between query plan features and query runtimes after robust regression (only for common queries between all systems).  ),
),  ),
),  ),
),  ),
),  )
)
To further investigate the correlation between metrics and runtimes, we measured Spearman’s correlation coefficient between query runtimes and corresponding errors of each of the first six metrics. The results are shown in Table 2 which shows that the proposed metrics on average have positive correlations with query runtimes, i.e., the smaller the error, the smaller the query runtimes. The similarity error of overall query plan (
In order to make a fair comparison between the results, we only take the common queries on which every system passed. We eliminate the LHD [49] because it failed in 20/32 benchmark queries (which is a very high number and only 12 simple queries passed), and is not adequate for comparison. We apply Spearman’s correlation again on common queries. Table 3 shows that the proposed metric has a positive correlation with query runtime when we deal with only common queries. The similarity error of overall plan (
Furthermore, we removed outliers influencing results by applying robust regression on both the q-error and proposed similarity error metrics. Robust regression is done by Iterated Re-weighted Least Squares (IRLS) [21]. We used Huber weights [22] as weighting function in IRLS. This approach further fine-tuned the results and made the correlation for our proposed similarity error and runtime stronger. Table 4 shows that all metrics have a positive correlation. However, in our proposed metric this difference is definite. The similarity error of overall query plan (

Similarity and q-error of query plan.
Another important factor worth mentioning is that the robust regression does not abide by the normality assumptions. Comparing the p-values (at 5% confidence level) of the simple linear regression and robust regression suggests that the data is sufficiently normally distributed for simple linear regression.
Overall, the results show that the proposed similarity errors correlate better with query runtimes than the q-error. Moreover, the correct estimation of the overall plan is clearly the most crucial fragment of the plan generation. Thus, it is important for federation engines to pay particular attention to the cardinality estimation of the overall query plan. However, given that this estimation commonly depends on triple patterns and join estimations, better means for approximating triple patterns and join cardinalities should lead to better plans. The weak to moderate correlation of the similarity errors with query runtimes suggests that the query runtime is a complex measure affected by multi-dimensional metrics, such as metrics given in Table 1 and the SPARQL features, such as number of triple patterns, their selectivities, use of projection variables, number of joins and their types [44]. Therefore, it is rather hard to pinpoint a single metric or a SPARQL feature which has a high correlation with the runtime [38,44]. The proposed similarity error metric is related to the query planning component of the federation engines and is useful for evaluating the quality of the query plans generated by these engines.
In the robust regression model, the outliers are adjusted with new values according to Huber loss function. In similarity error, the list of queries which are re-weighted after applying robust regression are: C2, C1, S14, CH7 in CostFed; S2 in SemaGrow; S8 and S2 in SPLENDID; and S8 in Odyssey. In q-error, the list of queries which are re-weighted after applying robust regression are: C6, C2, C4, CH7, S3 in CostFed; CH3, CH4, S13, C2 in SemaGrow; CH6, C2, C7, S5 in SPLENDID; and S11, C2, C1, S4 in Odyssey.
In these queries, the residual values are either significantly higher or lower than the regression line. For example, in CostFed the average of the similarity errors across all queries is 0.272 and the range of the residual values for unmodified queries is between
Finally, the overall q-error is more affected by robust regression as compared to similarity error. This is because a q-error takes the maximum of all the errors in the cardinality estimation of the joins and triple patterns. Consequently, some queries produce very high q-error values due to a single less efficient cardinality estimation for a join or a triple pattern.
Combined regression-based comparison analysis
Recall that our null hypothesis was that there is no correlation between query runtime and error measurement. Based on the results shown in Figs 2 and 3, we can make the following observations:
We can reject the null hypothesis in 62.5% (i.e., 5 out 8) of the experiments for the similarity error while the same can only be done in 12.5% (1 out of 8) experimental settings for the q-error. The similarity error is significantly correlated with the runtimes of CostFed (simple and robust regression), SemaGrow (simple and robust regression) and Splendid (robust regression). On the other hand, the q-error is solely significantly correlated with the runtime of SemaGrow (robust regression). In the one case where the p-values achieved by both measures allow to reject the null hypothesis (i.e., for SemaGrow using the robust regression analysis), the R-value of the similarity error is higher than that of the q-error (0.56 vs. 0.53). For Odyssey, both the similarity error and q-error were not able to produce significant results in our experiments. This suggests that the two errors do not capture the phenomena that influence the performance of Odyssey. A deeper look into Odyssey’s runtime performance suggests that it performs worst w.r.t. its source selection time (see Table 8), a factor which is not captured by the errors considered herein.
Our observations suggest that the similarity error is more likely to be significantly correlated with the runtime of a federated query engine than the q-error. However, for some systems (like Odyssey in our case) it may not produce significant results. Interestingly, the correlation between similarity error and runtimes is significant and highest for best-performing (in terms of average query runtime, see Fig. 5) federated query engine CostFed. We hypothesize that this result might indicate that the similarity error is most useful for systems which are already optimized to generate good plans. However, this hypothesis needs to be confirmed through further experiments. Still, the usefulness of the similarity error seems especially evident when one compares the behaviour of the similarity and the q-error when faced with single cardinality estimation errors. For example, suppose we have 3 joins in a query with estimated cardinalities 10, 10, 100 and with real cardinalities 10, 10 and 1 respectively. The q-error of the plan would be 100 even though only a single join estimation was not optimal. As shown by the equation in Section 4.1, the q-error is sensitive to single estimation error if they are of high magnitude. This is not the case with similarity errors, which would return 0.86.
q-error and similarity-based errors
We now present a comparison of the selected cost-based engines based on the 6 metrics given in Fig. 4. Overall, the similarity errors of query plans given in Fig. 4(a) suggests that CostFed produces the smallest errors followed by SPLENDID, LHD, SemaGrow, and Odyssey. CostFed produces smaller errors than SPLENDID in 10/17 comparable queries (excluding queries with timeout and runtime errors). SPLENDID produces smaller errors than LHD in 12/14 comparable queries. LHD produces smaller errors than SemaGrow in 6/12 comparable queries. In turn, SemaGrow produces smaller errors than Odyssey in 9/15 comparable queries.
An overall evaluation of the q-error of query plans given in Fig. 4(b) leads to the following result: CostFed produces the smallest errors followed by SPLENDID, SemaGrow, Odyssey, and LHD. In particular, CostFed produces smaller errors than SPLENDID in 9/17 comparable queries (excluding queries with timeout and runtime error). SPLENDID produces smaller errors than SemaGrow in 9/17 comparable queries. SemaGrow produces smaller errors than Odyssey in 8/13 comparable queries. Odyssey is superior to LHD in 5/8 cases.
An overall evaluation of the similarity error in joins leads to a different picture (see Fig. 4(c)). While CostFed remains the best system and produces the smallest errors, it is followed by Odyssey, SPLENDID, SemaGrow, and LHD. In particular, CostFed outperforms Odyssey in 12/17 comparable queries (excluding queries with timeout and runtime error). Odyssey produces less errors than SPLENDID in 7/14 comparable queries. SPLENDID is superior to SemaGrow in 11/17 comparable queries. SemaGrow outperforms LHD in 7/12 comparable queries.
As an overall evaluation of the q-error of joins given in Fig. 4(d), CostFed produces the smallest errors followed by SPLENDID, SemaGrow, Odyssey, and LHD. CostFed produces less errors than SPLENDID in 12/17 comparable queries (excluding queries with timeout and runtime error). SPLENDID produces less errors than SemaGrow in 9/17 comparable queries. SemaGrow produces less errors than Odyssey in 9/13 comparable queries. Odyssey produces less errors than LHD in 4/8 comparable queries.
Overall, the evaluation of the similarity errors of triple patterns given in Fig. 4(e) reveals that CostFed produces the smallest errors followed by SPLENDID, Odyssey, SemaGrow, and LHD. CostFed produces smaller errors than SPLENDID in 10/17 comparable queries (excluding queries with timeout and runtime error). SPLENDID produces smaller errors than Odyssey in 15/17 comparable queries. Odyssey produces smaller errors than SemaGrow in 7/14 comparable queries. SemaGrow outperformed LHD in 6/12 queries.
An overall evaluation of the
In general, the accuracy of the estimation is dependent upon the detail of the statistics stored in the index or data summaries. Furthermore, it is important to pay special attention to the different types of triple patterns (with bound and unbound subject, predicate, objects) and joins types (subject-subject, subject-object, object-object) for the better cardinality estimations. CostFed is more accurate because of the more detailed data summaries, able to handle the different types of triple patterns and joins between triple patterns. The use of the buckets can more accurately estimate the cardinalities of the triple patterns with most common predicates used in the dataset. Furthermore, it handles multi-valued predicates. The Odyssey statistics are more detailed as compared to SPLENDID and SemaGrow (both using VoiD statististics). The distributed characteristic sets (CS) and characteristic pair (CP) statistics generally leads to better cardinality estimations for joins.
How much does an efficient cardinality estimation really matter?
We observed that it is possible for a federation engine to produce quite a high cardinality estimation error (e.g., 0.99 is the overall similarity error for the S11 query in SemaGrow), yet it produces the optimal query plan. This leads to the question, how much does the efficiency of cardinality estimators of federation engines matter to generate optimal query plans? To this end, we analyzed query plans generated by each of the selected engines for the benchmark queries. In our analysis, there are three possible cases in each plan:
Table 5 shows the query plan generated by the query planners of the selected engines according to the aforementioned three cases possible for each plan. Since LHD failed to generate any query plan for the majority of the LargeRDFBench queries, we omit it from further discussion. In our evaluation, CostFed produced the smallest sub-optimal plans (i.e, 6) followed by Odyssey (i.e., 11), SemaGrow (i.e., 12), and SPLENDID (i.e, 14). The reason for CostFed’s small number of sub-optimal plans is due to the fact that it has the fewest cardinality errors in the estimation, as discussed in the previous section. In addition, it generates the highest number of possible only-plans (which can be regarded as optimal plans for the given source selection information). This is because CostFed’s source selection is more efficient in terms of the total triple pattern-wise sources selected without losing recall (see Table 8).
Query Plans generated by query engines for all queries (Simple, Complex, Complex + High Dimensional Queries). Failed: ( ) Engine Failed to produce Query Plan,
 OptP: ( ) Optimal Query Plan generated by engine,
 subOpt: ( ) subOptimal Plan generated by engine,
 OnlyP: ( ) Only Plan possible

Query Plans generated by query engines for all queries (Simple, Complex, Complex + High Dimensional Queries). ) Engine Failed to produce Query Plan, ) Optimal Query Plan generated by engine, ) subOptimal Plan generated by engine, ) Only Plan possible
In Table 5, we can see that only a few sub-optimal query plans were generated for simple queries. This is due to the fact that simple category queries of the LargeRDFBench contain very few joins (avg. 2.6 [38]) to be executed by the federation engines. Thus, it is relatively easy to find the best join execution order. However, for complex and complex-plus-high-data sources queries, more sub-optimal plans were generated. This is because these queries contain more joins (around 4 joins on avg. [38]), hence a more accurate join cardinality estimation is required to generate the optimal join ordering plan. In conclusion, efficient cardinality estimation is more important for complex queries with more possible join ordering.
Number of transferred tuples.  ) means lowest value among all systems, and “red color” (
 ) means highest value among all systems

Table 6 shows the number of tuples sent and received during the query execution for the selected federation engines. The number of sent tuples is related to the number of endpoint requests sent by the federation engine during query processing [30,47]. The number of received tuples can be regarded as the number of intermediate results produced by the federation engine during query processing [30]. The smaller number of transferred tuples is considered important for fast query processing [30]. In this regard, CostFed ranked first with 31 green boxes (i.e., it had the best results among the selected engines), followed by Odyssey with 24 green boxes, SemaGrow with 12 green boxes, LHD with 10 green boxes, and then SPLENDID with 9 green boxes.
In most queries, CostFed and Odyssey produced the only possible plans only-plan, which means only one (excluding the Left join for OPTIONAL SPARQL operator) was locally executed by the federation engine. Consequently, these engines transfer fewer tuples in comparison to other approaches. The largest difference is observed for S13, where CostFed and Odyssey clearly outperform the other approaches, transferring 500 times fewer tuples. The number of received tuples in LHD is significantly high in comparison to other approaches. This is because it does not produce normal tree-like query plans. Rather, LHD focuses on generating independent tasks that can be run in parallel. Therefore, independent tasks retrieve a lot of intermediate results, which need to be joined locally in order to get the final query resultset.
Comparison of index construction time (Index Gen. Time ) and Index Size for selected federation engines
Comparison of index construction time (
Another advantage that CostFed and Odyssey have over other approaches is their join-aware approach for triple pattern-wise sources selected (TPWSS). This join-aware nature of these engines saves many tuples from transferring due to less overestimation of sources. CostFed also performs better because it maintains cache for ask requests and saves many queries from sending to different sources. Another important factor worth mentioning here is that the number of transferred tuples does not consider the number of columns (i.e., the number of projection variables in the query) in the result set, but only counts the number of rows (i.e., the number of results) returned or sent to the endpoints. We also observed that in the case of an only-plan or an optimal plan, the number of received tuples is less compared to sub-optimal plans, clearly indicating that a smaller number of tuples is key to fast query processing. The amalgamated average of all queries could also be misleading because in complex queries, there are more failed/timeout queries for some systems while producing answers in others. Therefore, we calculated the separate average for each category of queries, i.e., simple, complex and complex-and-high-data. From our analysis of the results, we concludes that if an engine produces optimal or only-plan, the number of intermediate results also decreases.
A smaller-sized index is essential for fast index lookup during source selection, but it can lack important information. In contrast, large index sizes provide slow index lookup and are hard to manage, but may lead to better cardinality estimations. To this end, it is important to compare the size of the indexes generated by the selected federation engines. Table 7 shows a comparison of the index/data summaries’ construction time and the index size4
The index size is given by size of summaries used for cardinality estimation (in MBs).
Comparison of selected federation engines in terms of source selection time  ) means lowest value among all systems, and “red color” (
 ) means highest value among all systems

According to [38], the efficiency of source selection can be measured in terms of: (1) total number of triple pattern-wise sources selected (#T), (2) the number of SPARQL ASK requests sent to the endpoints (#A) during source selection, and (3) the source selection time. Table 8 shows a comparison of the source selection algorithms of the select triple stores across these metrics. As discussed previously, the smaller #T leads to better query plan generation [38]. The smaller #A leads to smaller source selection time, which in turn leads to smaller query execution time. In this regard, CostFed ranked first (83 green boxes, i.e., the best results among the selected engines), followed by Odyssey with 56 green boxes, LHD with 15 green boxes, SPLENDID with 10 green boxes, and then SemaGrow with 9 green boxes.
The approaches that perform a join-aware and hybrid (SPARQL + index) source selection lead to smaller #T [38]. Both Odyssey and Costfed perform join-aware source selection and hence lead to smaller #T than other selected approaches. The highest number of SPARQL ASK requests is sent by index-free federation engines, followed by hybrid (SPARQL + index), which in turn is followed by index-only federation engines [38]. This is because for index-free federation engines, such as FedX, the complete source selection is based on SPARQL ASK queries. The Hybrid engines such as CostFed, SPLENDID, SemaGrow and Odyssey make use of both index and SPARQL ASK queries to perform source selection, thus some of the SPARQL ASK requests are skipped due to the information used in the index. The Index-only engines, such as LHD, only make use of the index to perform the complete source selection. Thus, these engines do not consume a single SPARQL ASK query during source selection. The source selection time for such engines is much smaller due to only index-lookup without sending outside requests to endpoints. However, they have more #T than hybrid (SPARQL + index) source selection approaches.
Finally, we present the query runtime results of the selected federation engines across the different queries categories of LargeRDFBench. Figure 5 gives an overview of our results. In our runtime evaluation on simple queries (S1–S14) (see Fig. 5(a)), CostFed has the shortest runtimes, followed by SemaGrow, LHD, Odyssey, and SPLENDID. CostFed’s runtimes are shorter than SemaGrow’s on 13/13 comparable queries (excluding queries with timeout and runtime error) (average runtime = 0.5 sec for CostFed vs. 2.5 sec for SemaGrow). SemaGrow outperforms LHD on 4/11 comparable queries with an average runtime of 2.5 sec for SemaGrow vs. 2.7 sec for LHD. LHD’s runtimes are shorter than Odyssey’s on 8/10 comparable queries with an average runtime of 8.5 sec for Odyssey. Finally, Odyssey is clearly faster than SPLENDID on 8/12 comparable queries with an average runtime of 131 sec for SPLENDID.
Our runtime evaluation on the complex queries (C1–C10) (see Fig. 5(b)) leads to a different ranking: CostFed produces the shortest runtimes followed by SemaGrow, Odyssey, and SPLENDID. CostFed outperforms SemaGrow in 6/6 comparable queries (excluding queries with timeout and runtime error) with an average runtime of 3 sec for CostFed vs. 9 sec for SemaGrow. SemaGrow’s runtimes are shorter than Odyssey’s in 3/4 comparable queries with an average runtime of 63 sec for Odyssey. Odyssey is better than SPLENDID in 5/5 comparable queries, where SPLENDID’s average runtime is 98 sec.
The runtime evaluation on the complex and high sources queries (CH1–C8) given in Fig. 5(c) establishes CostFed as the best query federation engine, followed by SPLENDID and then SemaGrow. CostFed’s runtimes are smaller than SemaGrow in 3/3 comparable queries (excluding queries with timeout and runtime error), with an average runtime of 4 sec for CostFed vs. 191 sec for SemaGrow. SPLENDID has no comparable queries with CostFed and SemaGrow. LHD and Odyssey both fail to produce results when faced with complex queries.

Average execution time of LargeRDFBench and FedBench queries.
In this paper, we presented an extensive evaluation of existing cost-based federated query engines. We used existing metrics from relational database research and proposed new metrics to measure the quality of cardinality estimators of selected engines. To the best of our knowledge, this work is the first evaluation of cost-based SPARQL federation engines focused on the quality of the cardinality estimations.
The proposed similarity-based errors have a more positive correlation with runtimes, i.e., the smaller the error values, the better the query runtimes. Thus, this metric helps developers to design a more efficient query execution planner for federation engines. Our proposed approach produces more significant results compared to q-error. However, there is still room for further improvement. The higher coefficients (R values) with similarity errors (as opposed to q-error), suggest that the proposed similarity errors are a better predictor for runtime than the q-error. The smaller p-values of the similarity errors, as compared to q-error, further confirm that similarity errors are more likely to be a better predictor for runtime than the q-error. Errors in the cardinality estimation of triple patterns have a higher correlation to runtimes than the error in the cardinality estimation of joins. Thus, cost-based federation engines must pay particular attention to attaining accurate cardinality estimations of triple patterns. The number of transferred tuples have a direct co-relation with query runtime, i.e., the smaller the number of transferred tuples, the smaller the query runtimes. The smaller number of triple pattern-wise sources selected is key to generate maximum only possible query plans ( On average, the CostFed engine produces the fewest estimation errors and has the shortest execution time for the majority of LargeRDFBench queries. The weak to moderate correlation of the cardinality errors with query execution time suggests that the query runtime is a complex measure affected by multi-dimensional performance metrics and SPARQL query features. The proposed similarity error metric is related to the query planning component of the federation engines and is useful for evaluating the quality of the query plans generated by these engines. The proposed cardinality estimating metrics are generic and can be applied to non-federated cardinality-based query processing engines as well.
The impact of our proposed work is to provide new measures for the development of better cost-based federated SPARQL query engines. Furthermore, our proposed metrics will help in determining the quality of the generated query plans, such as indicating whether or not the join orders are correct. This kind of information is not revealed from the query runtime because the overall query runtime is affected by all metrics given in Table 1. As future work, we want to compare heuristic-based (index-free) federated SPARQL query processing engines with cost-based federated engines. We want to investigate how much an index is assisting a cost-based federated SPARQL engine to generate optimized query execution plans.
Footnotes
Acknowledgements
The work has been supported by the EU H2020 Marie Skłodowska-Curie project KnowGraphs (no. 860801), BMVI-funded project LIMBO (Grant no. 19F2029I), BMVI-funded project OPAL (no. 19F2028A), and BMBF-funded EuroStars project SOLIDE (no. 13N14456). This work has also been supported by the National Research Foundation of Korea (NRF) (grant funded by the Korea government (MSIT) (no. NRF-2018R1A2A2A05023669)).