
Abstract
Semantics-based knowledge representations such as ontologies are found to be very useful in automatically generating meaningful factual questions. Determining the difficulty-level of these system-generated questions is helpful to effectively utilize them in various educational and professional applications. The existing approach for predicting the difficulty-level of factual questions utilizes only few naive features and, its accuracy (F-measure) is found to be close to only 50% while considering our benchmark set of 185 questions. In this paper, we propose a new methodology for this problem by identifying new features and by incorporating an educational theory, related to difficulty-level of a question, called Item Response Theory (IRT). In the IRT, knowledge proficiency of end users (learners) are considered for assigning difficulty-levels, because of the assumptions that a given question is perceived differently by learners of various proficiency levels. We have done a detailed study on the features/factors of a question statement which could possibly determine its difficulty-level for three learner categories (experts, intermediates, and beginners). We formulate ontology-based metrics for the same. We then train three logistic regression models to predict the difficulty-level corresponding to the three learner categories. The output of these models is interpreted using the IRT to find a question’s overall difficulty-level. The accuracy of the three models based on cross-validation is found to be in satisfactory range (67–84%). The proposed model (containing three classifiers) outperforms the existing model by more than 20% in precision, recall and F1-score measures.
Introduction
A considerable amount of effort has been invested into the creation of a semantics-based knowledge representations such as ontologies where information is formalized into machine-interpretable formats. Among these are SNOMED CT,1
The problem of generating question items from ontologies has recently gained much attention in the computer science community [1,3,5,11,20,23,24]. This is mainly due to the utility of the generated questions in various educational and professional activities such as learner assessments in e-Learning systems, quality control in human computational tasks and fraud detection in crowd-sourcing platforms [17], to name a few.
Traditionally, question generation (QG) approaches have largely focused on retrieving questions from raw text, databases and other non-semantics based data sources. However, since these sources do not capture the semantics of the domain of discourse, the generated questions cannot be machine-processed, making them less employable in many of the real-world applications. For example, questions that are generated from raw text are mainly employed for language learning tasks [2].
Knowing the semantics of the questions, that are automatically generated, helps in further analyzing them to find their scope, difficulty-level and possible solutions. These aspects are of great importance when we consider sensitive areas such as education. This is an obvious limitation of the existing approaches that do not employ semantics-based knowledge sources. Using semantics-based knowledge sources in QG has various other advantages, such as (1) in ontologies, we model the semantic relationships between domain entities, which help in generating meaningful and machine-processable questions (2) ontologies enable standard reasoning and querying services over the knowledge, providing a framework for generating questions more easily.
Many efforts in the ontology-based QG are accompanied by methods for automating the task of difficulty-level estimation. In the E-ATG system [22], a recent QG system, we have proposed a method for predicting difficulty-level of the system generated factual questions. To recall, in that method, we assign a relatively high difficulty score to a question if the concepts and roles in the question form a rare combination/pattern. For example, considering movie domain, if a question contains the roles: is based on and won oscar – which rarely appear together – the question is likely to be more difficult than those questions which are formed using a common role combination (say, is directed by and is produced by). Even though this method showed a good accuracy in predicting the difficulty-levels of a selected set of 24 questions (given in [22]), on considering a large set of benchmark questions (introduced in Section 6.1), the accuracy has dropped down to approximately 50% – more details are given in Section 9. This shows that more investigation needs to be done to improve the current model, mainly by identifying other factors which influence the difficulty-level of a question.
An early effort to identify factors that could potentially predict the difficulty-level was by Seyler et al. [15,16]. They have introduced a method to classify a question as easy or hard by finding the features of the similar question entities in the Linked Open Data (LOD). Feature values for the classification task are obtained based on the connectivity of the question entities in the LOD. We observed that, rather than mapping to LOD – which is not always possible in the case of highly specific domains/domain-entities – incorporating domain knowledge in the form of terminological axioms and following an educational theory called Item Response Theory (IRT), the prediction can be made more accurate.
The contributions of this paper can be listed as follows.
We reformulate some of the existing factors/features and propose new factors which influence the difficulty-level of a question by taking into account the learners’ knowledge level (or learners’ category).
We introduce ontology-based metrics for finding the feature values.
With the help of standard feature selection methods in machine learning and by using a test dataset, we study the influence of these factors in predicting hardness of a question for three standard learner categories.
We then propose three learner-specific regression models trained only with the respective influential features, and the output of the models is interpreted using the IRT to find the overall difficulty-level of a question.
This paper is organized as follows. Section 2 contains the preliminaries required for understanding the paper. Section 3 discusses the outline of the proposed method. In Section 4, we give an account of the related works. Section 5 proposes the set of features of a question which determines its difficulty-level. In Section 6, we explain the machine learning methods that we have adopted to develop the Difficulty-level Model (DLM). Further, we discuss the performance of DLM in Section 6.2. A comparison with the state-of-the-art method is given in Section 9. Conclusions and future line of research are detailed at the end.
We assume the reader to be familiar with Description Logics [8] (DLs). DLs are decidable fragments of first-order logic with the following building blocks: unary predicates (called concepts), binary predicates (called roles), instances of concepts (called individuals) and values in role assertions (called literals). A DL ontology is thought of as a body of knowledge describing some domain using a finite set of DL axioms. The concept assertions and role assertions form the assertion component (or ABox) of the ontology. The concept inclusion, concept equality, role hierarchy etc. (the type of axioms depend on the expressivity of the DL) form the terminological component (or TBox) of the ontology.
Question generation using patterns
For a detailed study of difficulty-level estimation, we use the pattern-based method, employed in the E-ATG system, for generating factual questions from the ABox of the given ontologies.
In the pattern-based question generation, a question can be considered as a set of conditions that asks for a solution which is explicitly present in the ontology. The set of conditions is formed using different combinations of concepts and roles assertions associated with an individual in the ontology. Example-1 is on such question, framed from the following assertions that are associated with the (key) individual
Name the Movie that is directed by Alejandro and has release date Aug 27, 2014.
For generating a question of the above type, we may need to use a (generic) SPARQL query template as shown below. The resultant tuples are then associated with a question pattern (E.g., Name the [?C], that is [?R1] [?o1] and [?R2] [?o2]. (key: ?s)) to frame the questions.
In our previous work [22], we have looked at all the possible graph patterns (i.e., combinations of subject, object, concepts and predicates) for framing questions. However, due to the practicality of using all the patterns in the E-ATG system, we have limited to 19 commonly occurring question patterns. We have also proposed methods for selecting domain-relevant resultant tuples (or questions) for conducting domain related assessments. A resultant tuple of the above query (for example,
For the ease of understanding, all examples presented in this paper are from the Movie domain.
Item Response Theory (IRT) [18] models relationship between the ability or trait of a person and his responses to the items in an experiment. The term item denotes an entry, statement or a question used in the experiment. The item response can be dichotomous (yes or no; correct or incorrect; true or false) or polytomous (more than two options such as rating of a product). The quality measured by the item may be knowledge proficiency, aptitude, belief or even attitude. This theory was first proposed in the field of psychometrics, later, the theory was employed widely in educational research to calibrate and evaluate questions items in the world-wide examinations such as the Scholastic Aptitude Test (SAT) and Graduate Record Examination (GRE) [7].
In our experiments, we use the simplest IRT model often called Rasch model or the one-parameter logistic model (1PL) [9]. According to this model, a learner’s response to a question item is determined by her knowledge proficiency level (a.k.a. trait level) and the difficulty of the item. 1PL is expressed in terms of the probability that a learner with a particular trait level will correctly answer a question that has a particular difficulty-level. [18] represents this model as:
In the equation,
In the equation,
Outline of the proposed method
In this paper, based on the insights obtained by the study of the questions that are generated from the ATG [21] and E-ATG systems, we propose features/factors that can positively or negatively influence the difficulty-level of a question. Albeit there are existing methods which utilize some of these factors for predicting difficulty-level, studying the psychometric aspects of these factors by considering learners’ perspective about the question, has given us further insight into the problem.
As we saw in Section 2.2, IRT is an item oriented theory which could be used to find the difficulty-level of a question by knowing the question’s hardness (difficult or not difficult) with respect to various learner categories. Therefore, on finding the hardness of a given question based each on learner category, we can effectively use the IRT model for interpreting its overall difficulty-level.
According to IRT, a question is assigned a high difficulty-level if it is difficult for an expert learner to answer it correctly. A question is said to be difficult for an expert if the probability of a group of expert learners answering the question correctly is
Assigning one of the three difficulty-levels: high, medium and low, by considering whether the question is difficult (d) or not-difficult (
) for three learner categories
Assigning one of the three difficulty-levels: high, medium and low, by considering whether the question is difficult (d) or not-difficult (

Block diagram of the proposed model for predicting a question’s difficulty-level.
We consider three standard categories of learners: beginners, intermediates and experts, and model three classifiers for predicting the difficulty corresponding to the three learner categories, as shown in Fig. 1. Since the hardness (
A simple notion to find the difficulty-level of an ontology-generated multiple choice questions (MCQs) was first introduced by Cubric and Tosic [10]. Later, in [4], Alsubait et al. extended the idea and proposed a similarity-based theory for controlling the difficulty of ontology-generated MCQs. In [3], they have applied the theory on analogy type MCQs. In [6], the authors have extended the use of the theory to other question types and experimentally verified their approach in a student-course setup. The practical solution which they have suggested to find out the difficulty-level of an MCQ is with respect to the degree of similarity of the distractors to the key. If the distractors are very similar to the key, students may find it very difficult to answer the question, and hence it can be concluded that the MCQ is difficult.
In many a case, the question statement in an MCQ is also a deciding factor for the difficulty of an MCQ. For instance, the predicate combination or the concepts used in a question can be chosen such that they can make the MCQ difficult or easy to answer. This is the reason why in this paper we focus on finding difficulty-level of questions having no choices (i.e., non-MCQs). An initial investigation of this aspect was done in [22]. Concurrently, there was another relevant work by Seyler et al. [15,16], focusing on QG from knowledge graphs (KGs) such as DBpedia. For judging the difficulty-level of such questions, they have designed a classifier trained on Jeopardy! data. The classifier features were based on statistics computed from the KGs (Linked Open Data) and Wikipedia. However, they have not considered the learner’s knowledge level, as followed in the IRT, while formulating the feature metrics. This makes their measures less employable in sensitive applications such as in an e-Learning system. While considering ontology-based questions, one of the main limitation of their approach is that the feature values were determined based on the connectivity of question entities in the KG, whereas in the context of DL ontologies, the terminological axioms can be also incorporated to derive more meaningful feature metrics. In addition, the influence of the proposed factors in determining the difficulty using feature selection methods was not studied.
Proposed factors to determine difficulty-level of questions
In this section, we look at a set of factors which can possibly influence the difficulty-level of a question and propose ontology-based metrics to calculate them. The intuitions for choosing those factors are also detailed.
To recall, a given question can be thought of as a set of conditions. For example, consider the following questions (where the underlined portions denote the equivalent ontology concepts/roles used).
Name the
Name the
The equivalent set of conditions of the two questions can be written as:
Popularity
Popularity is considered as a factor because of the intuition that the greater the popularity of the entities that form the question, more likely that a learner answers the question correctly. (We observe that this notion is applicable for learners of all categories.) Therefore, the question becomes easier to answer if the popularity of the concepts and roles that are present in the question is high. For example, out of the following two questions, Qn-3 is likely to be easy to answer than Qn-4, since
Name an
Name a
Our approach for measuring popularity is based on the observation that, (similar to what we see in Wikipedia data) if more articles talk about a certain entity, the more important, or popular, this entity is. In Wikipedia, when an article mentions a related entity, it is usually denoted by a link to the corresponding Wikipedia page. These links form a graph which is exploited for measuring the importance of an entity within Wikipedia. Keeping this in mind, we can define the popularity of an entity (individual) in an ontology as the number of object properties which are linked to it from other individuals. For obtaining a measure in the interval [0,1], we divide the number of in-links by the total amount of individuals in the ontology.
To find the popularity of a concept C in ontology
Selectivity
Selectivity of the conditions in a question helps in measuring the quality of the hints that are present in it [15]. Given a condition, selectivity refers to the number of individuals that satisfy it. When the selectivity is high, a question tends to be easy to answer. For example, among the following questions, clearly, Qn-5 is easier to answer than Qn-6. This is because finding an actor who has acted in at least a movie is easy to answer than finding an actor who has acted in a particular movie; finding the latter requires more specific knowledge.
Name an actor who acted in a movie. Name an actor who acted in Argo.
The conditions in the above questions are:
Since
As a question can have more than one conditions present in it, answer spaces of all the condition have to be taken into account while calculating the overall difficulty score of the question. It is debatable that including a specific condition in the question can always make the question difficult to answer – sometimes a specific condition can give a better hint to a (proficient) learner.
For example, the following question is more difficult to answer than Qn-5 and Qn-6 for a non-expert, since Name an American actor who acted in Argo.
When a question contains multiple conditions, we do an aggregation of their normalized (or relative) answer spaces (denoted as
In the following paragraphs, we discuss how the selectivity feature would affect the difficulty-level of an item. We discuss the cases of expert, intermediate and beginner learners separately. In the process, we define two selectivity based features and specify how to compute them using the knowledge base and the domain ontology.
Expert learner
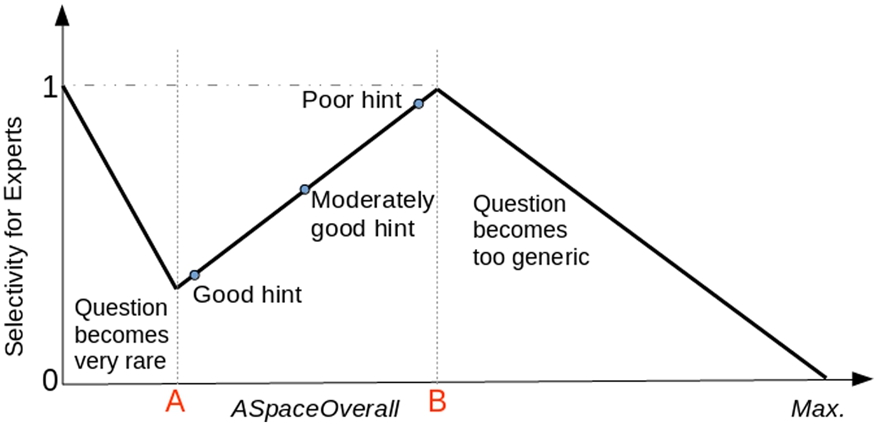
Relation between selectivity and answer space for experts.
An expert learner is assumed to have a well developed structured knowledge about the domain of discourse. She is supposed to clearly distinguish the terminologies of the domain and is capable of doing reasoning over them. Therefore, in general, selectivity can be assumed to be directly proportional to the difficulty-level; that is, when the ASpaceOverall increases, the underlying hints becomes poor and the question is likely to become difficult for her. However, intuitively, below and beyond particular ASpaceOverall values, a question’s difficulty does not necessarily follow this proportionality. As pointed out in [21,22] when a question pattern becomes rare, it becomes difficult to answer the question correctly. Therefore, in Fig. 2, towards the left of the point A, the question tends to become difficult, since the answer space becomes too small. Similarly, towards the right of the point B, the question tends to become more generic and its difficulty diminishes. To accurately predict whether a question is difficult or not, it is necessary to statistically determine the positions of the points A and B. Based on the initial analysis of the empirical data obtained from [22], we processed with an assumption that the question tends to become too generic when the ASpaceOverall
Beginner learner A beginner is assumed to have a less developed internal knowledge structure. She can be assumed to be familiar with the generic (sometimes popular) information about the domain and is less aware about the detailed specifics. We assume that the selectivity factor behaves proportionally to the ASpaceOverall, unlike what we saw in the experts’ case. The intuition behind this assumption is that, when the overall answer space increases, as in the case of an expert the so-called hints in the question cannot be expected to become poor; this is because, a person with poorly developed domain knowledge may not be able to differentiate the quality or property of the hint, making it rather a factor for generalizing the question (thereby making the question easily answerable). Therefore, we can follow a linear proportionality relation as shown in Fig. 3, to find the difficulty for a beginner, and we can denote this new selectivity as Selectivity Bg .

Relation between selectivity and answer space for beginners.
Intermediate learner An intermediate learner can be assumed to have partially both the perspective of an expect as well that of a beginner. Therefore, we can assume her selectivity value as combination of Selectivity Ex and Selectivity Bg – considering them as two factors.
In the current context, coherence captures the semantic relatedness of entities (between individuals, between an individual and a concept, and even between two concepts) in a question. It can be best compared to measuring the co-occurrences of individuals and concepts in the text. While considering coherence as a factor, we assume that higher the coherence between individuals/concepts in a question, lower is its difficulty-level and vice versa, because intuitively, the facts about highly coherent entities are likely to be recalled easier than the facts about less coherent entities. It is observed that this notion is applicable for learners of all categories.
Name the hollywood-movie starring Anil Kapoor and Tom Cruise.
Name the hollywood-movie starring Tom Cruise and Tim Robbins.
Given an ontology, we measure the coherence between two of its individuals as the sum of the ratio between the size of the set of entities that point to both individuals and the size of the union of the sets of entities that point to either one of the individuals, and the ratio between the size of the set of entities that are pointed by both individuals and the size of the union of the sets of entities that are pointed by either one of the individuals. Formally, the coherence between two individuals p and q can be represented as in Eq. 4, where
When there exists two or more individuals or concepts in a question, as in the case of the above example, the overall coherence is calculated by finding the sum of the coherences of each pair.
Specificity
Specificity refers to how specific a question is. For example, among the following questions, Qn-2 is more specific question than Qn-10 and requires more knowledge proficiency to answer it correctly. We consider Qn-2 as more difficult to answer than Qn-10.
Name an
Name the
For a learner, the difficulty-level depends on how detailed the question is. Intuitively, if a question contains domain specific conditions, the probability of a learner for correctly answering the question will reduce. (This notion is observed to be applicable for all categories of learners.) To capture this notion, we utilize the concept and role hierarchies in the domain ontology. We relate the depths of the concepts and roles that are used in the question to the concept and role hierarchies of the ontology, to determine the question difficulty. To achieve this, we introduce depthRatio for each predicate p in an ontology. depthRatio is defined as:
For a question S, generated from an ontology
A stem can have more than one predicate present in it. In that case, we assume that the predicate with a highest depthRatio (associated with the reference individual) could potentially make the stem more specific. Therefore, we define the overall depthRatio of a stem (called the specificity) as the product of the average depthRatio with the maximum value among all the depthRatios. In the following equation,
Difficulty-level modeling of questions
In the previous section, we have proposed a set of features which possibly influence the difficulty-level of a question. In this section, we do a feature selection study using three widely used filter models to find out the amount of influence of the proposed factors in predicting question difficulty. We then train three logistic regression models (
Training and testing data preparation
For training as well as for testing the models, we need to have questions along with their difficulty-levels. Since no such standard question sets were available, we have created a synthetic dataset and the difficulty-level of questions are assigned using conventional methods (described below). From now on, we will call the difficulty-level determined using the conventional methods as the questions’ actual difficulty-level.
Conventionally, a question can be assigned a difficulty-level by either of the two ways: (1) in a classroom setting by using IRT – we call this as Method-1 – or (2) with the help of subject matter experts – we call this as Method-2. In the former method, we find the probability by which a particular question is answered correctly by a learner of specific knowledge proficiency level and assign it as difficulty (d) or not (
We have gathered 1220 questions from four ontologies (DSA, MAHA, GEO and PD ontologies – see our project website4
Project website:
Question sets used and the distribution of their difficulty-levels
Even though we use two methods for assigning difficulty-levels, Method-1 is proven to be the more accurate approach than Method-2 [9,22]. However, finding the actual difficulty-level of the questions using Method-1 requires us to first identify the proficiency level of the test takers. This is practically not possible in many cases [22]. In the Table 2, you can see that only for DSA ontology we could apply Method-1.
In the case of Data Structures and Algorithms (DSA) ontology, we could potentially utilize those students who have taken the DSA course offered by IITM as the test takers and their subject proficiencies could be easily identified by looking at their course grades. (More details about the method can be found at the Appendix). For the other domains, this convenience was not there and therefore, the predictions of domain experts were considered for assigning the scores – each question-set is examined by five domain specific experts to assign difficulty-levels.

An instance of the training data.
Ranking score of features for the three training sets using three popular filter models. (IG, RF and CB, denote the three filter models: information gain, ReliefF and correlation-based, respectively)

For the aforementioned reason, we have decided to use the question-set from the DSA ontology as the benchmark question-set for testing the model. The question-sets obtained from the other ontologies are combined to form the training set.
The testing set contains 185 questions and the training data contains 1045 questions. As mentioned before, the questions in these question sets were classified as difficult or not-difficult for each of the three learner categories. We denote the training data for experts, intermediate and beginners respectively as
Feature selection In order to find out the amount of influence of each of the proposed factors, we did an attribute evaluation study using three most representative feature selection approaches [19]: Information Gain [13] (IG), ReliefF [14] (RF) and Correlation-based [12] (CB) methods. These feature selection approaches select a subset of features that minimize redundancy and maximize relevance to the target such as the class labels in classification. The ranking scores/weights obtained for the features are given in Table 3.
In Table 3, we can see that, the least prominent feature for finding the difficulty for experts is the SelectivityBg, since all the three filter models ranked it as the least influential one – see the fields shaded in blue in the three
Observations Consistent to what we have postulated in Section 5.2, SelectivityEx is found to be a more influential factor than SelectivityBg, for deciding the difficulty of a question for an expert learner. Similarly, for a beginner, SelectivityBg is found to be more influential than SelectivityEx.
The performances5
Precision = TP/TP + FP; Recall = TP/TP + FN; F1-Score = 2 ∗ (Recall ∗ Precision)/(Recall + Precision), where TP: true positives, FP: false positives, and FN: false negatives.
The performance of our individual models are found to be in a satisfactory range. The other model which uses regression model was by Dominic Seyler et al. [15]. It should be kept in mind that in DLM we have three classifiers (or models) corresponding to the three learner categories, whereas in the case of [15], they had only one binary classifier (easy/hard). Their model’s best accuracy was reported to be only 66.4%.
We use the test dataset mentioned in Section 6.1 for our detailed evaluation. We have conducted the evaluation by considering the test dataset as a whole and by considering randomly chosen small datasets to find the average precision, recall and F1-score.
While using the whole test dataset consisting of 185 questions for testing, the precision values of the model for predicting the high difficulty-level, medium difficulty-level and low difficulty-level classes are 78.18%, 79.73% and 78.57% respectively. The recall values for high, medium and low difficulty-level classes are 79.62%, 81.94% and 74.57% respectively. The corresponding F1-scores are 0.7894, 0.8082 and 0.7652 respectively. Table 5 reports our observations. The rows 1–3 contain the counts of number of questions that fall under the specific difficulty-level classes. The words “correct” and “wrong” indicate the number of questions that are correctly and wrongly classified (w.r.t. the actual prediction) by our model.
Precision, recall and F1-score of the models:
,
,
, for the 2 classes: n and
under 10-fold cross validation setup
Precision, recall and F1-score of the models:
Precision, recall and F1-score calculation of the DLM for the 3 classes of difficulty-levels
To find the average precision, recall and F1-score, we have generated 10 datasets consisting of 25 questions each randomly selected from the 185 questions. Our observations are presented in the last three rows of the Table 5.
Following from what we have seen in Section 3, the DLM cannot assign a difficulty-level to a given question if the outcomes of the three regression models do not agree with the three possible assignments (see Table 1). We call such questions as non-classifiable ones and the others as classifiable questions. We investigated the percentage of such non-classifiable cases by analyzing all the questions generated (super set of the question sets used for training and testing) – denoted as
MAHA, PD, GEO, ROR, and JOB ontologies (available in our project website).
This could be due to two reasons: 1. inaccuracy of the individual models; 2. incompleteness of the knowledge formalized in the ontology. To study the influence of the former, we have trained the DLM using four datasets containing 250, 500, 750 and 1045 data items (randomly chosen from the training set). When tested the model using QS, the percentage of non-classifiable questions were found to be 13.5, 10, 7.5 and 7.1 respectively. This shows that on increasing the training data, the count of unclassifiable questions could be reduced to some extent.
To analyze the influence of the incompleteness of the ontologies, we have randomly removed 20% of the triples from the MAHA, PD and GEO ontologies. We made sure that the triples related to the questions used in the training set were not affected, so that we could reuse the experts’ opinion about the difficulty-levels of the questions. Considering the (incomplete) ontologies after removing the triples as: MAHA′, PD′ and GEO′ respectively, we recalculated the feature values of the questions in the training set from these new ontologies, and trained a new model DLM′ (DLM is the model that was trained using our actual training set). On giving all the questions generated from these new ontologies, using the method described in [22], as input to the DLM′, it was found that that the percentage of non-classifiable questions was 12.32%, whereas when the same testing set is tested on DLM, the percentage was found to be 7.77%. This shows that the incompleteness of the ontologies has a huge impact on the number of non-classifiable questions.
In this section, we compare the predictions of difficult-levels by the proposed (IRT-based) model and the model given in [22]. We call the latter as E-ATG model. We do not report a comparison with the model proposed in [15,16] because their difficulty-level model is not a domain ontology-based model and prediction is possible only if the question components can be mapped to Linked Open Data entities. In addition, they could predict the question difficulty either as easy or hard, whereas our model classifies the question into three standard difficulty-levels: high, medium and low.
In [22], effectiveness of the E-ATG model is established by comparing the predicated difficulty-levels with their actual difficulty-levels determined in a classroom setting. Only twenty four representative questions generated from the DSA ontology were used for the study. Since, we now have a larger benchmark question set containing 185 questions, we use it for reporting the precision, recall, F1-score and their average values in Table 6. Average values are computed using 10 randomly generated datasets as we did in Section 7.
Precision, recall and F1-score calculation of the E-ATG model for the 3 classes of difficulty-levels
Precision, recall and F1-score calculation of the E-ATG model for the 3 classes of difficulty-levels
On comparing to the precision, recall and F1-scores of the our proposed model (given in Table 5) and the E-ATG model, we can see that there is a significant improvement (of more than 20%) on adopting the IRT-based DLM.
The E-ATG model mainly considered only one feature, the triviality score (which denotes how rare the property combination in the stem are), for doing the predication. Our results (20% improvement) show that the proposed set of new features could improve the correctness of the prediction. The current model is trained only using 1045 training samples. We expect the system to perform even better after training with more data as and when they are available, and by identifying other implicit features. Due to unavailability of large training data, unsupervised feature learning methods cannot be effectively applied in this context.
Conclusions and future work
Establishing mechanisms to control and predict the difficulty of assessment questions is clearly a big gap in existing question generation literature. Our contributions have covered the deeper aspects of the problem, and proposed strategies, that exploit ontologies and associated measures, to provide a better difficulty-level predicting model, that can address this gap. We developed the difficulty-level model (DLM) by introducing three learner-specific logistic regression models for predicting the difficulty of a given question for three categories of learners. The output of these three models was then interpreted using the Item Response Theory to assign high, medium or low difficulty-level. The overall performance of the DLM and the individual performance of the three regression models based on cross-validation were reported and they are found to be satisfactory. Comparison with the existing method [22] shows an improvement of more than 20% in precision, recall and F1-score measures.
In Section 5, we have detailed the rationales for proposing the four factors that influence the difficulty-level of a question. However, we could not find any other studies (even not in other fields) to give more theoretical grounding to proposed factors. This has lead us to investigate further on the influence of these factors on a question’s actual difficulty-level reported in Table 3. It is still an open question to study more on the other potential factors (if any) to improve the accuracy of the prediction.
The model proposed in this paper for predicting the difficulty-level of questions is limited to ABox-based factual questions. It would be interesting to extend this model to questions that are generated using the TBox-based approaches. However, the challenges to be addressed would be much more, since, in the TBox-based methods, we have to deal with many complex restriction types (unlike in the case of ABox-based methods) and their influence on the difficulty-level of the question framed out of them needs a detailed investigation.
For establishing the propositions and techniques stated in this paper, we have implemented a system which demonstrates the feasibility of the methods on medium-sized ontologies. It would be interesting to investigate the performance of the model on ontologies of different sizes. An understanding of the impact of the various characteristics of these ontologies on the performance would be our another future line of research.
Footnotes
Acknowledgements
This project is funded by Ministry of Human Resource Development, Gov. of India. We express our fullest gratitude to the participants of our evaluation process: Dr. S. Gnanasambadan (Director of Plant Protection, Quarantine & Storage), Ministry of Agriculture, Gov. of India; Mr. J. Delince and Mr. J. M. Samraj, Department of Social Sciences AC & RI, Killikulam, Tamil Nadu, India; Ms. Deepthi.S (Deputy Manager), Vegetable and Fruit Promotion Council Keralam (VFPCK), Kerala, India; Dr. K. Sreekumar (Professor) and students, College of Agriculture, Vellayani, Trivandrum, Kerala, India. We also thank all the undergraduate and post-graduate students of Indian Institute of Technology, Madras, who have participated in the empirical study.
Appendix
Testing set preparation The representative (185) questions generated from DSA ontology using the heuristics proposed in [22] are utilized for developing the testing set. We have limited the cardinality of the question set to a number that can be managed under our time constraint, and in addition, we found the questions to be more repetitive when we relax the thresholds of the question selection heuristics.
The selected questions were divided into three batches (B1, B2 and B3) of 60, 75 and 75 questions respectively. We first conducted an online test employing the questions in B1. Out of the 81 graduate level students (of IIT Madras) who have participated in our online test, 72 learners of the required knowledge proficiency levels were selected. To determine their trait levels, we have instructed them to self assess their knowledge confidence level on a scale of high, medium or low, at the end of the test. To avoid the possible errors that may occur during the self assessment of trait levels, the participant with high and medium trait levels were selected from only those students who have successfully finished the course: CS5800: Advanced Data Structures and Algorithms, offered at the computer science department of IIT Madras. The participants with high trait level were selected from those students with either of the first two grade (i.e., 10 Excellent and 9 Very Good). The participants with medium trait level were from those students who were having any of the next two grade points (i.e., 8 Good and 7 Satisfactory Work).
The other batches of questions were employed one after the other across three consecutive weeks. They have been asked to finish the questions in span of 75 minutes (however, we have not keep track of the time taken for finishing the tests). Instructions were given to avoid referring to any external medium to answer the questions, explaining the context of the test. To easy the evaluation and to avoid guess works, we have included a “Don’t know” option along with all the questions. Also informed them that selecting the don’t know option would be considered as equivalent to writing an incorrect action.
Training set preparation We have used 1045 representative questions that are generated from MAHA, GEO and PD ontologies for preparing the training set. As mentioned in Section 6.1, each of the questions would be classified into either difficult (d) or not difficulty (nd) for three categories of learners: Expert (E), Intermediate (I) and Beginner (B). Let us consider the possible classes to be: {E-d, E-nd}, {I-d, I-nd}, {B-d, B-nd}. The classification of questions from a specific ontology was done by experts of the corresponding domain. For MAHA and GEO ontology the team members who have involved in the (knowledge) development of the ontology were involved in the classification task. In the case of PD ontology (related to plant disease domain), experts having either masters’ or Ph.D. degree in plant disease related domain were involved in the evaluation task. We made sure that a minimum of five domain experts have evaluated each question. Conflicting cases were resolved by considering the majority voting.