
Abstract
RDF Graph Summarization pertains to the process of extracting concise but meaningful summaries from RDF Knowledge Bases (KBs) representing as close as possible the actual contents of the KB both in terms of structure and data. RDF Summarization allows for better exploration and visualization of the underlying RDF graphs, optimization of queries or query evaluation in multiple steps, better understanding of connections in Linked Datasets and many other applications. In the literature, there are efforts reported presenting algorithms for extracting summaries from RDF KBs. These efforts though provide different results while applied on the same KB, thus a way to compare the produced summaries and decide on their quality and best-fitness for specific tasks, in the form of a quality framework, is necessary. So in this work, we propose a comprehensive Quality Framework for RDF Graph Summarization that would allow a better, deeper and more complete understanding of the quality of the different summaries and facilitate their comparison. We work at two levels: the level of the ideal summary of the KB that could be provided by an expert user and the level of the instances contained by the KB. For the first level, we are computing how close the proposed summary is to the ideal solution (when this is available) by defining and computing its precision, recall and F-measure against the ideal solution. For the second level, we are computing if the existing instances are covered (i.e. can be retrieved) and at which degree by the proposed summary. Again we define and compute its precision, recall and F-measure against the data contained in the original KB. We also compute the connectivity of the proposed summary compared to the ideal one, since in many cases (like, e.g., when we want to query) this is an important factor and in general in RDF, linked datasets are usually used. We use our quality framework to test the results of three of the best RDF Graph Summarization algorithms, when summarizing different (in terms of content) and diverse (in terms of total size and number of instances, classes and predicates) KBs and we present comparative results for them. We conclude this work by discussing these results and the suitability of the proposed quality framework in order to get useful insights for the quality of the presented results.
Introduction
RDF has become one of the major standards in describing and publishing data, establishing what we call the Semantic Web. Thus, the amount of the available RDF data increases fast both in size and complexity, making the appearance of RDF Knowledge Bases (KBs) with millions or even billions of triples something usual. Given that RDF is built on the promise of linking together relevant datasets or KBs and with the appearance of the Linked Open Data (LOD) cloud, we can now query KBs (both standalone or distributed) with millions or billions of triples altogether. This increased size and complexity of RDF KBs has a direct impact on the evaluation of the RDF queries we express against these RDF KBs. Especially on the LOD cloud, we observe that a query against a big, complex, interlinked and distributed RDF KB might retrieve no results at the end because either the association between the different RDF KBs is weak (is based only on a few associative links) or there is an association at the schema level that has never been instantiated at the actual data level. Moreover, a lot of these RDF KBs carry none at all or only partial schema information (mainly contain instances built and described separately). Additionally, in the LOD cloud the number of KBs which do not use the full schema or they use multiple schemas has increased due to the absence of the schema information, which describes the interlinks between the datasets, and the combinatorial way of mixing vocabularies.
One way to address the concerns described above is by creating summaries of the RDF KBs. Thus the user or the system is able to decide whether or not to post a query, since it is known whether information is present or not based on the summary. This would provide significant cost savings in processing time since we will substitute queries on complex RDF KBs with queries first on the summaries (on much simpler structures with no instances) and then with queries only towards the KBs that we know will produce some useful results. Graph summarization techniques would allow the creation of a concise representation of the KB regardless of the existence or not of schema information in the KB. So, the summary will represent the actual situation in the KB, namely should capture the existing/used classes and relationships by the instances and not what the schema proposes (and might have never been used). This should facilitate the query building for the end users with the additional benefit of exploring the contents of the KB based on the summary. This is true regardless if we use heterogeneous or homogeneous, linked or not, standalone or distributed KBs. In all these cases we can use the RDF summary to concisely describe the data in the RDF KB and possibly add useful information for the RDF graph queries, like the distribution and the number of instances for each involved entity.
In the literature we can find various efforts proposing summarization techniques for RDF graphs. These techniques, presented briefly in Section 3, come from various scientific backgrounds ranging from generic graph summarization to explicit RDF graph summarization. While all promise that they provide correct, concise and well-built summaries so far has been very little effort into addressing in a comprehensive and coherent way the problem of evaluating these summaries against different criteria and have some formal metrics to describe the quality of the results. Only sparse efforts have been reported, usually tailored to a specific method or algorithm. So with this paper, we aim to cover the gap that exists in the literature and provide a comprehensive Quality Framework for RDF Graph Summarization that would allow a better, deeper and more complete understanding of the quality of the different summaries and facilitate their comparison. We propose to take into account the possibility to compare the summary against two levels of information possibly available for a RDF KB. In the case where an ideal summary is available, either because it has been proposed by a human expert or because we can assume that an existing schema represents perfectly the data graph, we compare the summary provided by the algorithms with it and use similarity measures to compute its precision and recall against the ideal summary. If this is not available or usually in addition to it, we compute the percentage of the instances represented by the summary (including both class and property instances). This provides us with the understanding of how well the summary covers the KB. Moreover we introduce a metric to cover the coherency dimension of the problem, i.e. how well connected the computed summary graph is. One can combine at the end the two overall metrics or use them independently. In order to validate the proposed quality metrics, we evaluated three of the most promising RDF graph summarization algorithms and report on the quality of their results over different datasets with diverse characteristics. We should note here that the proposed Quality Framework is independent of any of the algorithms evaluated but it is suitable in providing a common ground to compare them.
This is why we could summarize our contribution as presenting a quality framework that:
Evaluates the quality of RDF Graph Summaries, where a combined effort is made to summarize, while preserving existing important semantics, basic structure and coherence;
Works at different levels, both trying to understand the comparison of the two summaries (ideal and computed) at the schema and the instance levels, while previous approaches were mainly dealing with one level (which corresponds to the instance level in our approach);
Provides novel customized definitions for precision and recall for summaries, thus allowing better capturing of the quality of the results – so we go beyond the standard property and recall definitions;
Adds the discussion on the connectivity of the computed summary and tries to promote summaries that are more connected. This is quite crucial if we want later on to query the summary using standard RDF tools.
So, the proposed framework allows for understanding the quality of the different summaries at different levels. The users can pick the metrics that better fit to the task for which they need to pick a summary.
The paper is structured as follows: Section 2 introduces some of the foundations of RDF and RDFS, which are useful for defining later on some concepts in our work; Section 3 provides a review of the existing works around quality metrics in graph summarization; while Section 4 presents our proposed Quality Metrics for RDF Graph Summaries. Section 5 presents the three of the most promising RDF Graph Summarization algorithms in the literature that are compared using the proposed Quality Framework in Section 6, where the extensive experiments performed in order to validate the appropriateness of the proposed metrics are reported. We then conclude our paper in Section 7.
Preliminaries
RDF
As per the W3C standards, the RDF data model represents data on the Web as a set of triples of the form
Let
An RDF schema graph
We note
(RDF data graph).
An RDF data graph
We note
RDF schema and data graphs.
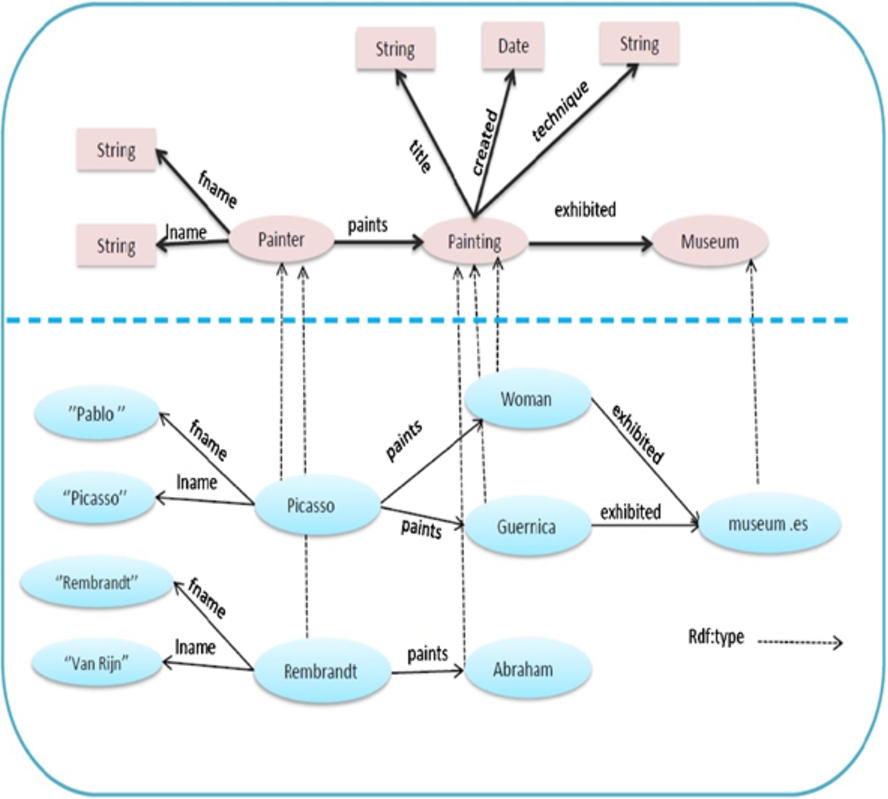
The upper part of Fig. 1 shows a visualization of an RDF schema graph example for the cultural domain, representing only class nodes, while properties are illustrated as edges between classes. For example, the class Painter denotes the set of instances which represent painter entities, while property paints relates class Painter instances to class Painting instances. The lower part of Fig. 1 depicts an instance (data) graph building on this schema. This graph represents 6 different resources. For example the resource Picasso is an instance of the Painter class having properties fname, lname and paints.
The set of properties associated with Picasso node in our example is
We denote by
(Property Instances).
We denote by
The set of instances of the class Painting in our example is
A knowledge pattern (or simply pattern from now on) characterizes a set of instances in an RDF data graph that share a common set of types and a common set of properties. More precisely:
(Knowledge Pattern).
A knowledge pattern
We introduce the term knowledge pattern because it is not sure that all summarization algorithms will produce something that can be necessarily defined as an RDF class or RDF property and also because we want to differentiate from the classes/properties of the ideal summary when we compare the two.
Table 1 shows possible patterns which can be extracted from the RDF instance graph depicted in Fig. 1 based on a forward bisimilarity relation.
Knowledge patterns example (computed based on the bisimilarity relation)

In order to be able to properly address the problem of creating RDF summaries of LOD/RDF graphs we need to define what an RDF Summary is. We follow the Definition 5 of the Knowledge Pattern and we define the summary as a set of the Knowledge Patterns that the algorithms compute. The proposed Quality Framework will help the user understand which proposed summary will better represent the original KB in terms of structure, coverage and connectivity. So, the Summary graph is defined as follows: Let (Summary graph).
Bisimilarity relation
Bisimilarity in a directed labeled graph is an Equivalence Relation defined on a set of nodes N, such that two nodes
Related work
RDF graph summarization has been intensively studied, with various approaches and techniques proposed to summarize the RDF graphs, which could be grouped into four main categories:
Aggregation and grouping approaches [25,30–32,36], which are based on grouping the nodes of an input RDF graph G into clusters/groups based on the similarity of the attribute values and on the neighborhood relationships associated with nodes of G. Structural extraction approaches [2,5,8,10,16–21,28,29,35], which define an equivalence relation on the nodes of the RDF data graph G, usually based on the set of incident graph paths. This allows extracting a form of schema for G by representing the equivalence classes of nodes of G as nodes in the summary graph, characterized by the set of incident paths of each class. Logical compression approaches [13,14], which are based on compressing the RDF datasets by generating a set of logical rules from the dataset and removing triples that can be inferred from these rules. The summary graph is then represented by a compressed graph and set of logical decompression rules, with the drawback that such approaches do not produce RDF graphs as summaries. Pattern-mining-based approaches [6,37,38], which are based on extracting frequent patterns from the RDF graph, then composing them to build an approximated summary graph.
Typically, the RDF summarization methods proposed so far do not address in depth the problem of the quality of the produced RDF summaries. A noticeable exception is the work in [4], which proposes a model for evaluating the precision of the graph summary, compared to a gold standard summary which is a forward and backward bisimulation summary. The main idea of the precision model is based on counting the edges or paths that exist in the summary and/or in the gold summary graph. The precision of a summary is evaluated in the standard way, based on the number of true positives (the number of edges existing in the summary and in the input graph) and false positives (the number of invalid edges and paths existing in the summary but not in the input graph). The first limitation of this quality model [4] is that it works only with the summaries generated by an algorithm that uses a bisimulation relation. Similarly to our quality framework, they consider the precision at instance level, i.e. how many of summary class/property instances are correctly matched in the original KB. Unlike to our work, this work does not consider the recall at the instance level, because it claims that the way summarization algorithms work, does not allow them to miss any instance. But this is not always correct, e.g. the approximate RDF summarization algorithms like [37,38] might miss a lot of instances. As it is well-known, the precision alone cannot accurately assess the quality, since a high precision can be achieved at the expense of a poor recall by returning only few (even if correct) common paths. Additionally and unlike our work, this model does not consider at all the quality of the summary at the schema level, e.g. what if one class/property of the ideal summary is missing or an extra one is added or a property is assigned to the wrong class. In all these cases, the result will be the same, while it is obvious that it should not. Finally, [4] is missing completely any notion of evaluating the connectivity of the final summarization result.
One more effort, [7], addressing the quality of hierarchical dataset summaries is reported in the literature. The hierarchical dataset summary is based on the grouping of the entities in the KB using their types and the values of their attributes. The quality of a given/computed hierarchical grouping of entities is based on three metrics: (1) the weighted average coverage of the hierarchical grouping, i.e. the average percentage of the entities of the original graph that are covered by each group in the summary; (2) the average cohesion of the hierarchical grouping where the cohesion of a subgroup measures the extent to which the entities in it form a united whole; and (3) the height of a hierarchical grouping, i.e. the number of edges on a longest path between the root and a leaf. The main limitation of this approach is that it works only with the hierarchical dataset summaries, since metrics like the cohesion of the hierarchical groups or the height of the hierarchy cannot be computed in other cases. Moreover, the proposed groupings provide a summary that can be used for a quick inspection of the KB but cannot be queried by any of the standard semantic query languages. On the other hand and similarly to our quality framework, [7] considers the recall (named coverage) at instance level, i.e. how many of the instances of the original KB are correctly covered by the summary concepts. Contrary to our work, this model does not consider at all the quality of the summary at the schema level. Notions from [7] can also be found in the current paper, where algorithms like [37,38] that rely on approximation get penalized if they approximate too much, in fact loosing the cohesion of the instances represented by the computed knowledge patterns.
Besides that, only few efforts have been reported in the literature addressing the quality of the schema summarization methods in general [3,27,33], i.e. the quality of the RDF schema that can be obtained through RDF summarization. The quality of the RDF schema summary in [27] is based on expert ground truth and is calculated as the ratio of the number of classes identified both by the expert users and the summarization tool over the total number of classes in the summary. The main limitation of this approach is that it uses a boolean match of classes and fails to take into account similarity between classes when classes are close but not exactly the same as in the ground truth or when classes in the ground truth are represented by more than one class in the summary. Works in schema matching (e.g. [33]) are also using to some extend similar metrics like recall, precision, F1-Measure commonly used in Information Retrieval, but are not relevant to our work since even if we consider an RDF graph summary as an RDF schema, we are not interested in matching its classes and properties one by one; as stated above this binary view of the summary results does not offer much in the quality discussion. Additionally these works do not take into account issues like the size of the summary.
To the best of our knowledge, this is the first effort in the literature to provide a comprehensive Quality Framework for RDF Graph Summarization, independent of the type and specific results of the algorithms used and the size, type and content of the KBs. We provide metrics that help us understand not only if this is a valid summary but also if a summary is better than another in terms of the specified quality characteristics. And we can do this by assessing information, if available, both at schema and instance levels.
Quality assessment model
In this section we present a comprehensive and coherent way to measure the quality of RDF summaries produced by any algorithm that summarizes RDF graphs. The framework is independent of the way algorithms work and makes no assumptions on the type or structure neither of the input nor of the final results, besides being expressed in RDF; this is required in order to guarantee the validity of the result but can be easily extended to other cases of semantic summarization, like for graphs expressed in OWL or Description Logics. In order to achieve this, we work at two levels:
schema level, where if an ideal summary exists, the summary is compared with it by computing the precision and recall for each class and its neighborhood (properties and attributes having as domain that class) of the produced summary against the ideal one; we also compute the precision and recall of the whole summary against the ideal one. The first will capture the quality of the summary at the local (class) level, while the second will give us the overall quality in terms of classes’ and properties/attributes’ precision and recall. instance level, where the coverage that the summary provides for class and property instances is calculated, i.e. how many instances will be retrieved if we query the whole summary graph. We use again precision and recall against the contents of the original KB.
At the end, a metric is presented that provides an indication of the quality of the graph summary by measuring whether or not the summary is a connected graph. Ideally, a summary should be a connected graph but this also depends on the actual data stored in the Knowledge Base. Thus a disconnected graph could be an indication of the data quality in the KB and not necessarily a problem of the summarization process. Nevertheless, we present it here as another indicator of the quality process, especially if the summary is compared with an ideal one, but for the reason mentioned before we avoid to combine it with the rest of the presented metrics. Finally, we discuss some results that combine these metrics and interpret their meaning.
Summary description of the proposed schema measures

Summary description of the proposed schema measures
In this section we present our quality assessment framework to evaluate the quality of an RDF graph summary against a ground truth summary
The precision is the fraction of retrieved classes and properties of the summary that are relevant. If a knowledge pattern of a summary carries a typeof link then this pattern is relevant to a specific class if the typeof points to this class, if not this is not relevant to this class. If no typeof information exists then we use the available properties and attributes to evaluate the similarity between a class and a pattern. Thus we define the
We define the
Based on the
However, neither precision nor recall alone can accurately assess the match quality. In particular, recall can easily be maximized at the expense of a poor precision by returning as many correspondences as possible. On the other side, a high precision can be achieved at the expense of a poor recall by returning only few (correct) correspondences. Hence it is necessary to consider both measures and express this through a combined measure; we use the F-Measure for this purpose, namely
We note that the schema precision at the property level in our experiments is always equal to 1 (see Section 6), which means that in our examples there are no false positives for properties. Summarization algorithms do not invent new properties but they might report some properties, present in the KB, that are not present in the ground truth summary. So, precision for properties namely
Thus, the F-Measure for the schema properties, namely
Summary description of the proposed instance measures
Summary description of the proposed instance measures
We compute the number of connected components for the summary (and in the same manner for the ground truth) using the breadth-first search algorithm, where given a particular node n, we will find the entire connected component containing n (and no more) before returning. To find all the connected components of a summary (or the ground truth) graph, we loop through the nodes, starting a new breadth-first search, whenever the loop reaches a node that has not already been included in a previously found connected component. This metric gives an indication of the connectivity of a generated summary. If it is 1, it shows that the summary is a graph connected as well as the ground truth graph, but if it is bigger than 1 it means that the summary is more disconnected than desired. The higher the connectivity, the more the links that are missing between the classes of the computed graph compared to the ground truth; this could even capture correctly a completely disconnected summary graph. This metric allows us to penalize (if needed) disconnected (compared to the ground truth) summary graphs and allows for progressive linear penalties. It is also theoretically possible that the summary graph will be more connected than the ground truth graph, this will give us values less than 1. The value of the connectivity can tend to but will never reach 0.
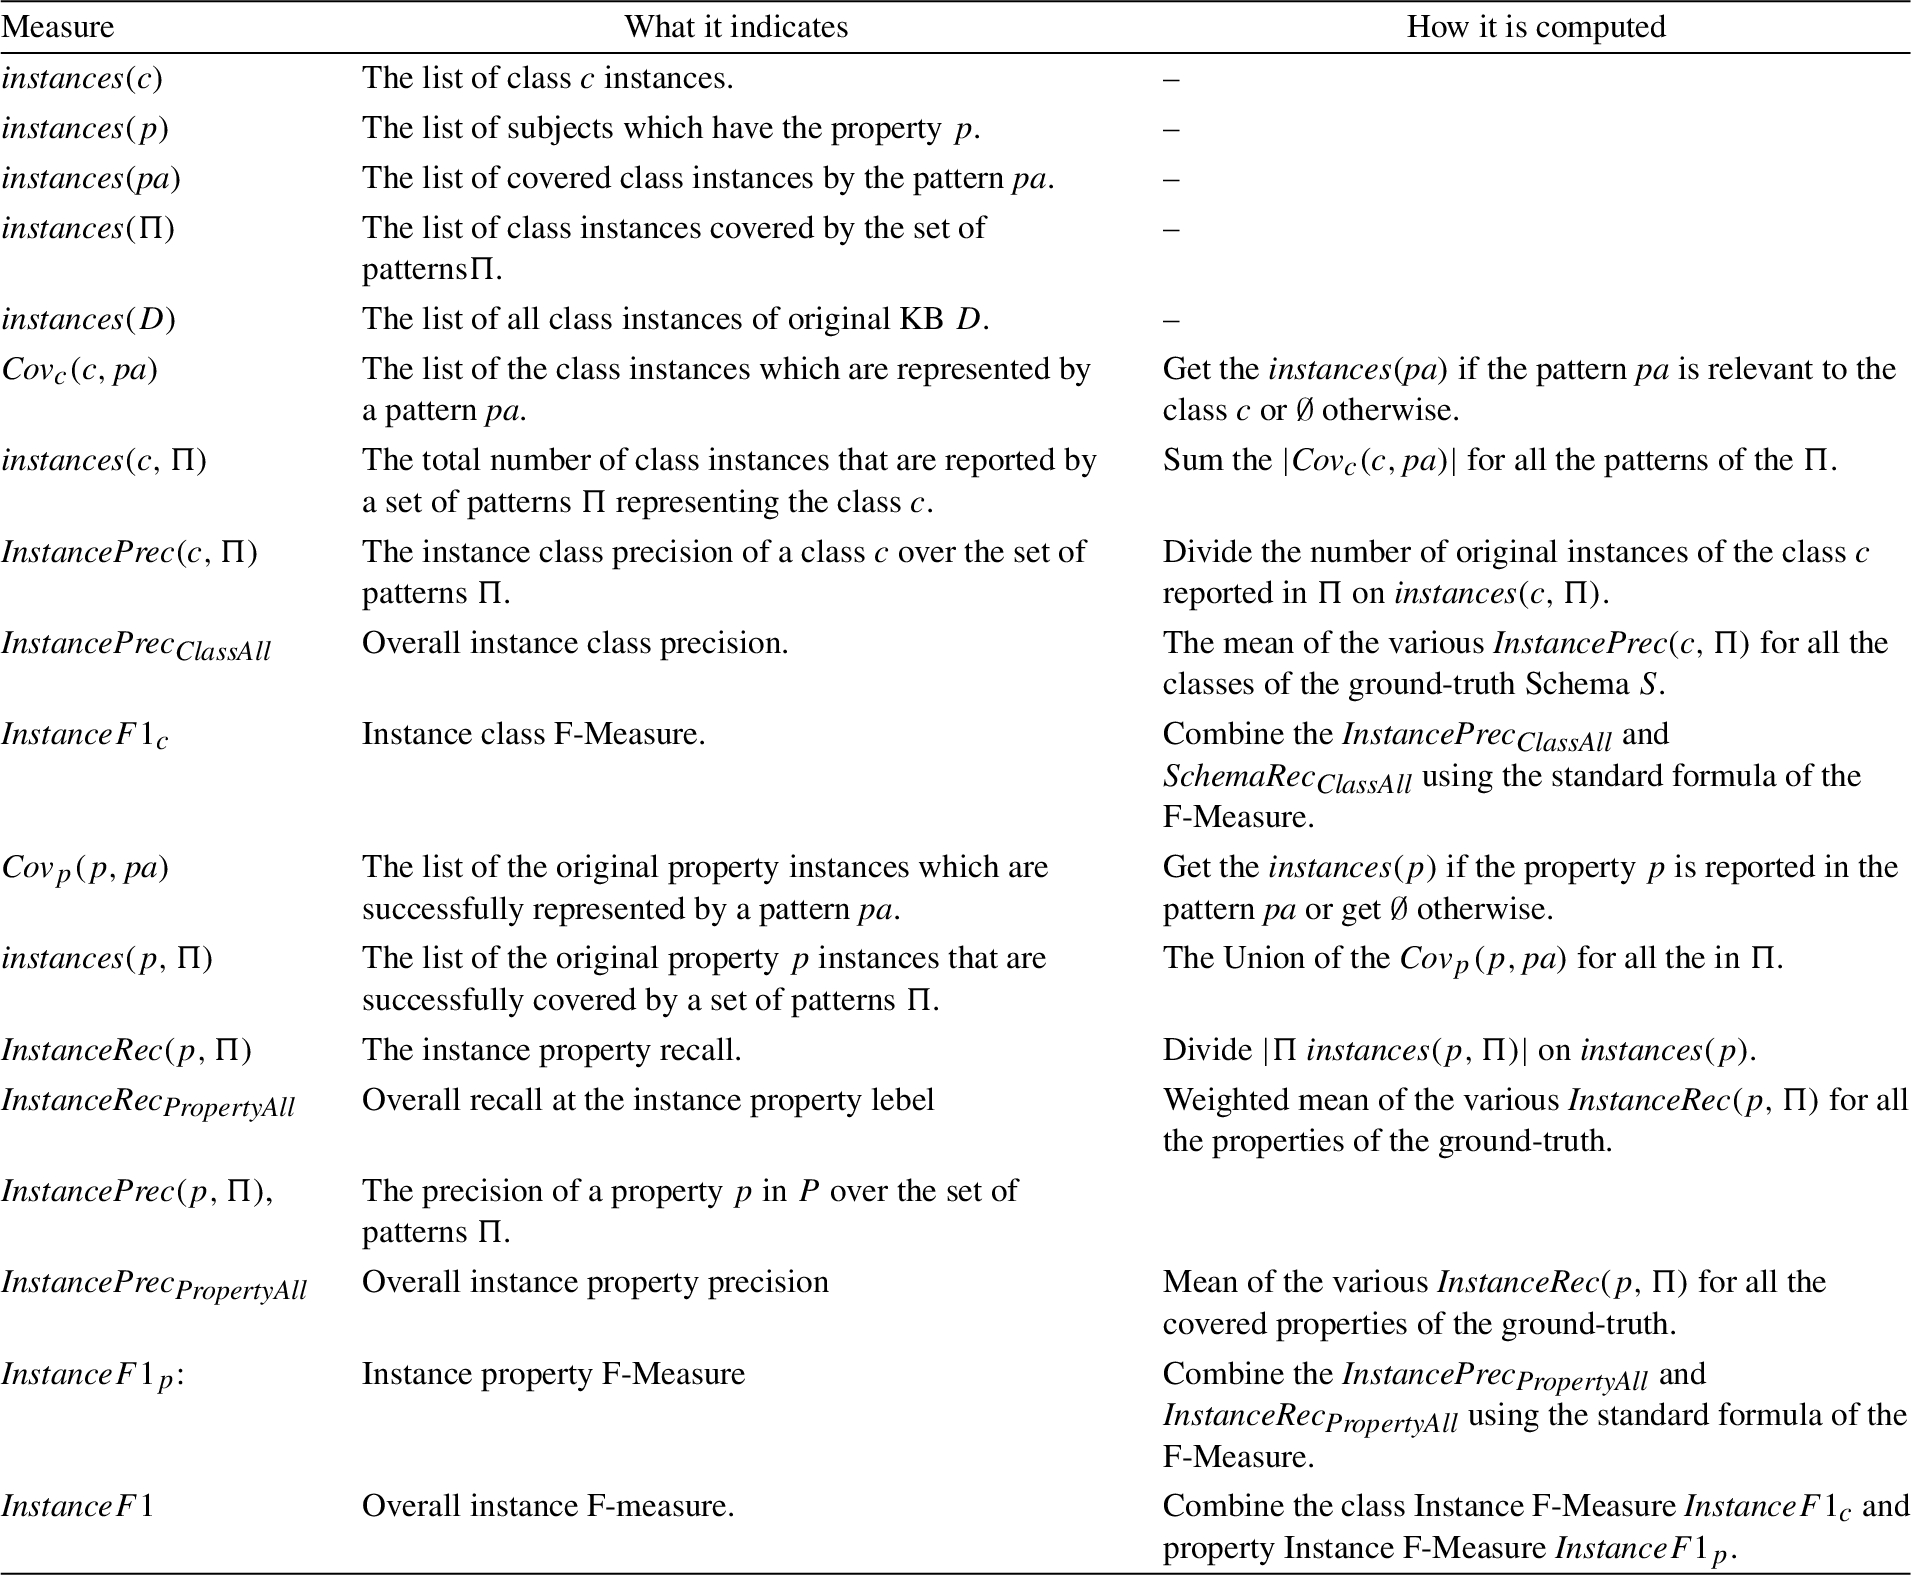
We measure the quality with regard to the instances by introducing the notion of the coverage of the instances of the original KB, i.e. how many of the original class and property instances are successfully represented by the computed RDF summary graph (e.g. can be retrieved in the case of a SPARQL query). This requires computing both the precision and recall at the class instance and at the property instance levels. Table 3 gives us a summary description of the proposed instance level metrics.
We denote by
Thus, we can define the total number of class instances
We define
We need also to make one last point for the computation of the instance-level metrics, for the case when our KB contains no schema information. In this case and in order to make the instance level class precision and recall computable we need to annotate the KB with
Representative algorithms for validating the quality framework
Algorithms’ description
As we have already mentioned in Section 3, the RDF graph summarization algorithms could be grouped into four main categories. Based on the results reported in the literature we have chosen three of the most well performing RDF graph summarization algorithms [5,16,37] according to their authors. Our selection of these algorithms was also based on specific properties and features that they demonstrate: (a) they do not require the presence of RDF schema (triples) in order to work properly, (b) they work on both homo- and heterogeneous KBs, (c) they provide statistical information about the available data (which can be used to estimate a query’s expected results’ size), and (d) they provide a summary graph that is considerably smaller than the original graph.

An artificial dataset about music artists and their productions.
Binary Matrix Mapper: Transform the RDF graph into a binary matrix, where the rows represent the subjects and the columns represent the predicates. They preserve the semantics of the information by capturing distinct types (if present), all attributes and properties (capturing property participation both as subject and object for an instance).
Graph Pattern Identification: The binary matrix created in previous step is used in a calibrated version of the PaNDa+ [26] algorithm, which allows to experiment with different cost functions while retrieving the best approximate RDF graph patterns. Each extracted pattern identifies a set of subjects (rows) all having approximately the same properties (cols). The patterns are extracted so as to minimize errors and to maximize the coverage (i.e. provide a richer description) of the input data. A pattern thus encompasses a set of concepts (type, property, attribute) of the RDF dataset, holding at the same time information about the number of instances that support this set of concepts.
The ideal summary of the dataset depicted in Fig. 2.
Constructing the RDF summary graph: A process, which reconstructs the summary as a valid RDF graph using the extracted patterns is applied at the end. The process exploits information already embedded in the binary matrix and constructs a valid RDF schema to summarize the KB.
We implemented the three algorithms used in the experiments hereafter ourselves. The implementations of two of the algorithms (ExpLOD and Campinas et al.) were not available from the original authors so we had to implement them ourselves in Java, based on the corresponding papers. We validated the implementation running tests with the datasets described in the original papers. Since we were getting the same results we are quite confident that the implementations are correct. Given also that performance benchmarking is out of scope of this current work, we did not have to deal with any kind of extreme optimizations.
Working example
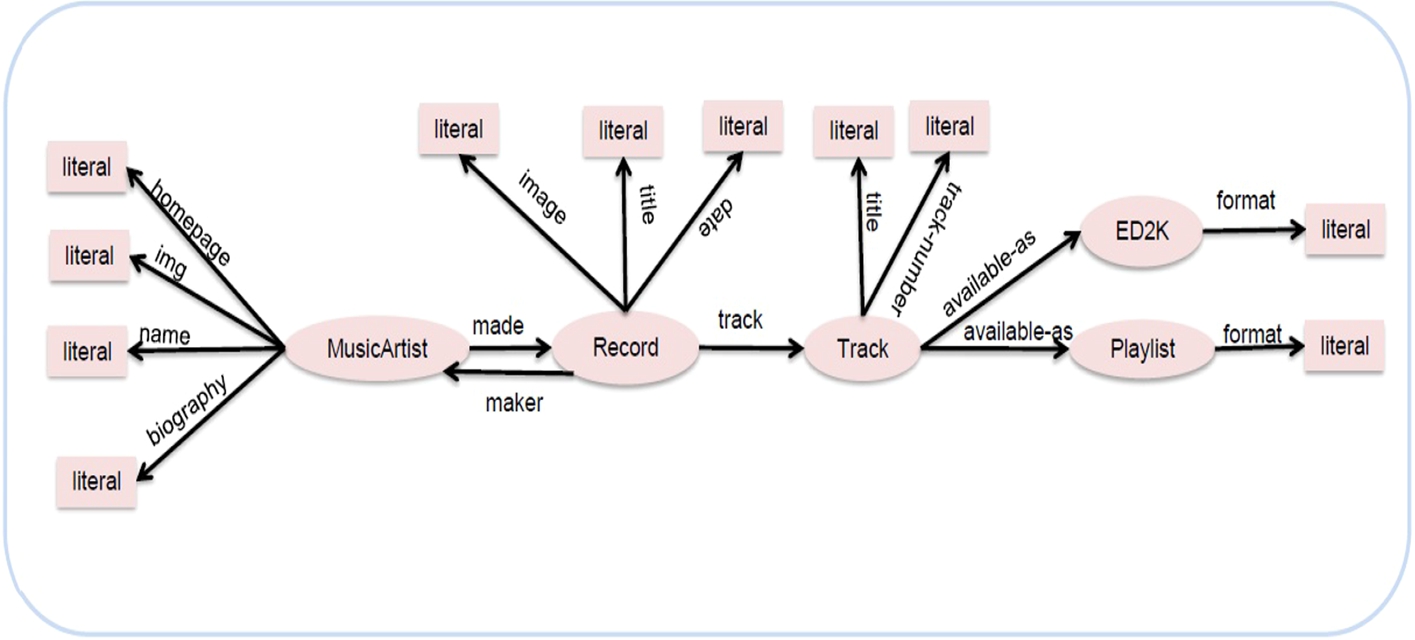
In an effort to better explain the way our quality assessment framework works and captures the differences among the different summaries we provide a working example. We have created an artificial dataset containing information about music artists and their productions. Figure 2 shows a visualization example of the RDF instance graph of this dataset. We have 3000 resources describing the music-artists and all of them have the name and made properties, while only 2500 resources have the rdf:type property, 2049 resources have the homepage property, 2850 have the img property, 50 resources have the biography property. We can also notice that we have 5000 resources describing the records and all of them have the date, image, track and maker properties, while 4995 resources have the title property and only 28 resources have the description property. There are also 45000 resources describing the tracks and all of them have the rdf:type, title, track-number and available-as properties, while only 5 resources have the olga property (used to link a track to a Document for tracking in the On-Line Guitar Archive). These tracks are available as a Playlist or/and as ED2K formats. Figure 3 shows an ideal summary for this dataset as was suggested by an expert.
Tables 4, 5 and 6 present the three RDF summaries generated using the three discussed algorithms: ExpLOD, Campinas et al. and Zneika et al. respectively. The first column shows the pattern id, the second shows the predicates involved in the pattern, while the third column shows the corresponding ideal summary class for a pattern. The last column shows the number of instances per pattern. The Figs 4, 5 and 6 are a visualization representing for three RDF summaries generated using ExpLOD, Campinas et al. and Zneika et al. receptively.
ExpLOD summary for the dataset depicted in Fig. 2

ExpLOD summary for the dataset depicted in Fig. 2
Campinas et al. summary for the dataset depicted in Fig. 2

Zneika et al. summary for the dataset depicted in Fig. 2

Here we calculate the precision for the MusicArtist class for the three summaries. We start by the ExpLOD summary described in Table 4,
Now let us take the Campinas et al. summary described in Table 5. In this table we can see that we have two patterns Pa1 and Pa2 represent the MusicArtist class, so

The ExpLOD summary of the dataset depicted in Fig. 2.

The Campinas et al. summary of the dataset depicted in Fig. 2.

The Zneika et al. summary of the dataset depicted in Fig. 2.
Schema metrics at class level
Now let us compute the precision of the MusicArtist for the Zneika et al. summary depicted in Table 6,
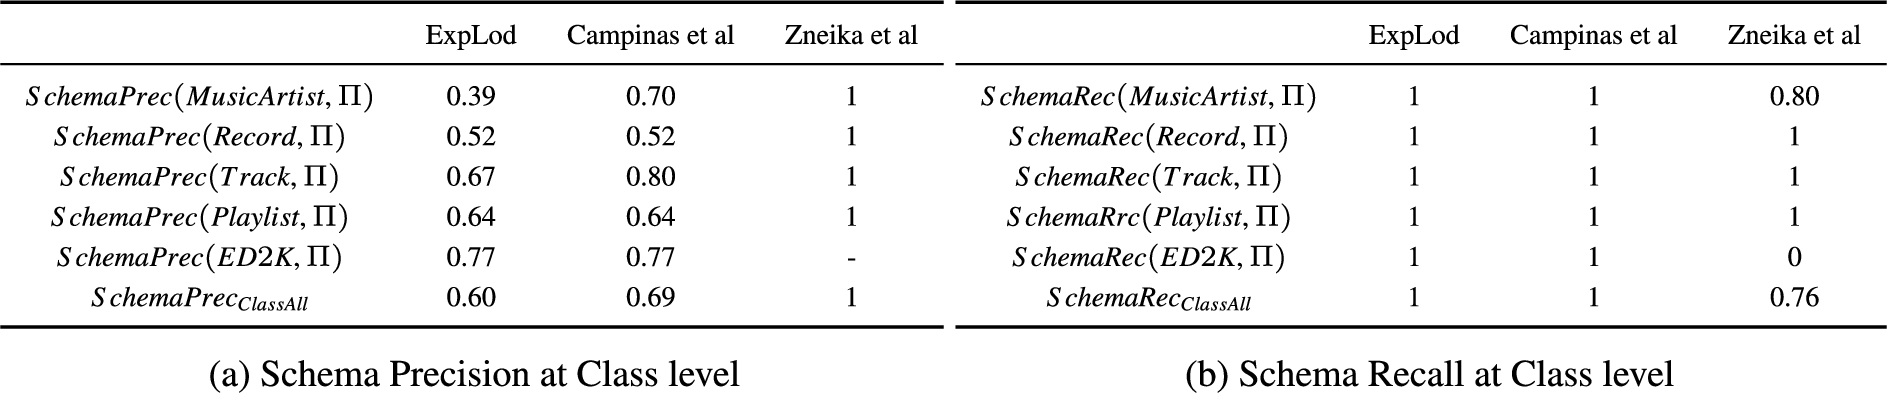
Following the same procedure, we can calculate the precision for each class in the set of classes of the ideal summary; these results are reported in Table 7a. We should also note that the class Document, which is reported in the summaries of the ExpLod and Campinas et al., is not a class in the ideal summary.
Table 7b shows the values of the recall for the list of ideal summary classes. We can note that for ExpLOD and Campinas et al., all recall values are 1, as their patterns cover all the properties in the ideal summary. While for Zneika et al., the recall for the MusicArtist is 0.8, because pattern Pa1, which represents the MusicArtist class, does not cover the biography property, so its recall equals 4 properties over 5 in the ideal summary,
Table 8 shows the recall and the precision values of the list of ideal summary properties. Where Table 8a shows the schema-level property precision, we notice that each one of the ExpLOD and Campinas et al. summaries has 16 properties, 13 of these 16 are included in the ideal summary, the other three: discography, description, and ogla are not. That makes the property precision for each one of these two summaries
Concerning the recall at the property level, ExpLOD and Campinas et al. recall equals 1, as they included all the properties in the ideal summary, while Zneika et al. missed one property which is biography, so its recall is
Schema metrics at property level

Instance metrics at property level

Table 9 shows the values of the recall for the list of distinct properties of the dataset depicted in Fig. 2. We can note that for ExpLOD and Campinas et al., all recall values are 1, as their patterns cover all the property instances of the datasets. While for Zneika et al., the property instance recall values for the biography, discography and description are 0, because these properties are completely missing from Zneika et al. summary.
Table 9a shows the values of the property instance precision. We can note that for ExpLOD, all precision values are 1, as its patterns described in Table 4 are correctly identifying all the property instances of the datasets. For the running example, the property
Now let us try to compute the instance precision value for the
Now let us take the Zneika el al. summary described in Table 6. In this table we can see that only the pattern Pa1 has the
Following the same procedure, we can calculate the instance property precision for all the dataset properties; these results are reported in Table 9a.
On the other hand, the results for the class precision and recall at the instance level in this example is always equal to 1 or almost 1 (since in one case only a few class instances are missing) and thus their computation provides no further insights for this example. This is why, the corresponding tables were omitted.
Connectivity
Table 10 reports the connectivity metric values for the summaries produced by the three discussed algorithms. It shows that the ExpLod has a value of 6 for this metric because its summary ends up with 6 separate components while the ideal summary depicted in Fig. 3 has exactly one connected component. This value means the ExpLOD provides a disconnected summary. The two other algorithms report a value of 1, which means that these two algorithm provide a summary as connected as the ideal one (one connected component in this case).
Connectivity

Connectivity
In this section, we compare the quality of the generated summaries of the three RDF graph summarization approaches covered in Section 5. We implemented these three approaches in Java 1.8 using the Nxparser2
Nxparser: https://github.com/nxparser/nxparser.
Descriptive statistics of the datasets

Table 11 shows the datasets from the LOD cloud that are considered for the experiments. The first seven columns show the following information about each dataset: its name, the number of triples it contains, and the number of instances, classes, predicates, properties and attributes. The eighth column shows the class instance distribution metric which provides an indication on how instances are spread across the classes and it is defined as the standard deviation (SD) in the number of instances per class. When the number of class instances per class in a dataset is quite close then the standard deviation is small; while, when there are considerable differences, the standard deviation will be relatively large. The ninth column shows the property instance distribution metric which provides an indication on how instances are spread across the properties and it is also defined as standard deviation (SD) in the number of instances per property.
The main goal of our datasets selection is to use real-world datasets from diverse domains with different size (number of triples) and with different numbers of classes (and class instances) and properties (and properties instances). We are also interested in the distribution of the data which might indicate if the structure of the KB or the size of the represented knowledge could affect the quality of the generated summaries. So we have datasets from 270 thousand (Jpeel) to 263 million triples (Lobid), from one (Bank2) to 53 unique classes (LinkedMDB), from about 76 thousand (Jpeel) to about 18 million unique instances/entities and from 12 to 222 predicates. These datasets range from being very homogeneous (the Bank dataset where all subjects have the same list of attributes and properties) to being very heterogeneous (LinkedMDB where the attributes and properties are very heterogeneous across types). The diversity of the datasets can help us to understand better how the selected approaches work in different situations and thus validate that the proposed quality metrics will capture the different behaviors correctly.
Evaluation results
In this section, we discuss the quality results of the RDF graph summarization approaches covered in Section 5, evaluated over all the datasets described in Table 11 for the following two cases:
Typed Dataset: the KB contains schema information, like definition of classes and properties and more importantly a significant number of instances of a dataset have at least one typeof link/property. Untyped Dataset: there is no schema information in the KB and more importantly none of the datasets subjects/objects or properties has a defined type (we explicitly checked and deleted all of them).
The distinction for the experimentation is important because there are algorithms that try to exploit schema related information (mainly typeof links) in order to gain insights for the structure of the KB. While, wherever available using this information could be valuable, we would like to test the summarization algorithms in cases when this information is not available, too. With that we can validate that the proposed Quality Framework will correctly capture the differences in the results and will correctly identify, for example, algorithms that work well in both cases.
Implementation of the quality framework
We implemented our Quality Framework as a software that takes as input the results of any RDF Graph Summarization algorithm and the ideal summary and computes the different metrics that are required to capture the quality of the results at the different levels described earlier. It outputs the values for the different metrics in an automated fashion and allows to compute F-measures where applicable. In principle it can be used to compare the quality of any summary against an ideal one or to understand how close two summaries are to one another. It is implemented in Java and it is available as open source software, here: https://github.com/ETIS-MIDI/Quality-Metrics-For-RDF-Graph-Summarization.
We describe the different steps applied in the form of algorithmic pseudocode that allows to track the computations taking place at the different levels that the Quality Framework operates. The pseudocode of Algorithm 1 gives an overview of our implementation of the computations at the schema level. The function which computes the schema class recall is shown in Algorithm 2, while the one, which computes the schema class precision, is shown in Algorithm 3. The function which computes the schema property precision and recall is shown Algorithm 4. In the same manner, the pseudocode in Algorithm 5 gives an overview of the computations at the instance level. The function which computes the instance class recall is shown in Algorithm 6, while the one, which computes the instance class precision, is shown in Algorithm 7. The function which computes the instance property precision and recall is shown in Algorithm 8.

Schema Level Metrics

Function Schema Class Recall

Function Schema Class Precision

Function Schema Property Precision and Recall
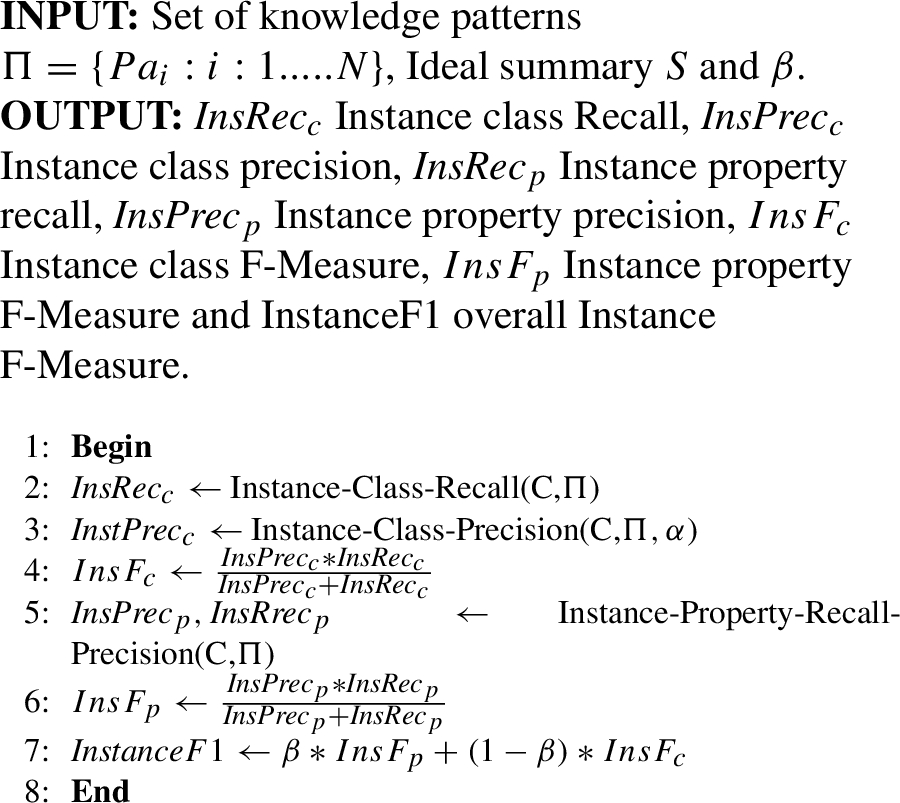
Instance Level Metrics

Function Instance Class Recall

Function Instance Class Precision

Function Instance Property Precision and Recall
Table 13 reports the precision, recall and F-Measure values at the schema level for classes and properties of the generated RDF summaries over the set of datasets depicted in Table 11 for the typed and untyped cases. The left part of Table 13 shows the results for the typed used datasets while the right part shows the results for untyped used datasets. The Figs 7 and 8 are representing the overall schema F-Measure and the class precision metrics values respectively, they were picked as visualization examples from the different computed metrics because visualized as charts they offer more details.
We can note from Table 13 that the schema property recall, schema property precision and the schema property F-Measure, reported in columns
Another notable observation from the Table 13g and the Fig. 7b, is that for the Bank dataset and for the overall schema F-Measure the perfect value (equal to 1) is reported for the Zneika et al. and Campinas et al. algorithms. This is because the Bank dataset is a fully typed and homogeneous dataset(each subject of this dataset has at least one typeof link/property) and as we explained earlier, the Campinas et al. algorithm groups the original nodes based only on their types when types exist, hence they are no missed or added properties in this case.
For the Sec dataset, the Table 13e shows that the values of schema class precision reported in column
Tables 13s, 13t report metrics values at the schema level for the generated RDF summaries of the Campinas et al. and Zneika et al. algorithms over the DBpedia dataset for the typed and untyped cases. We do not report results for the ExpLOd algorithm because ExpLOD’s implementation was bound to datasets that fit in main memory and DBpedia could not fit in main memory. We notice from these tables that the values of the schema class precision reported in column

F-measure results for typed/untyped presented datasets at the schema level.
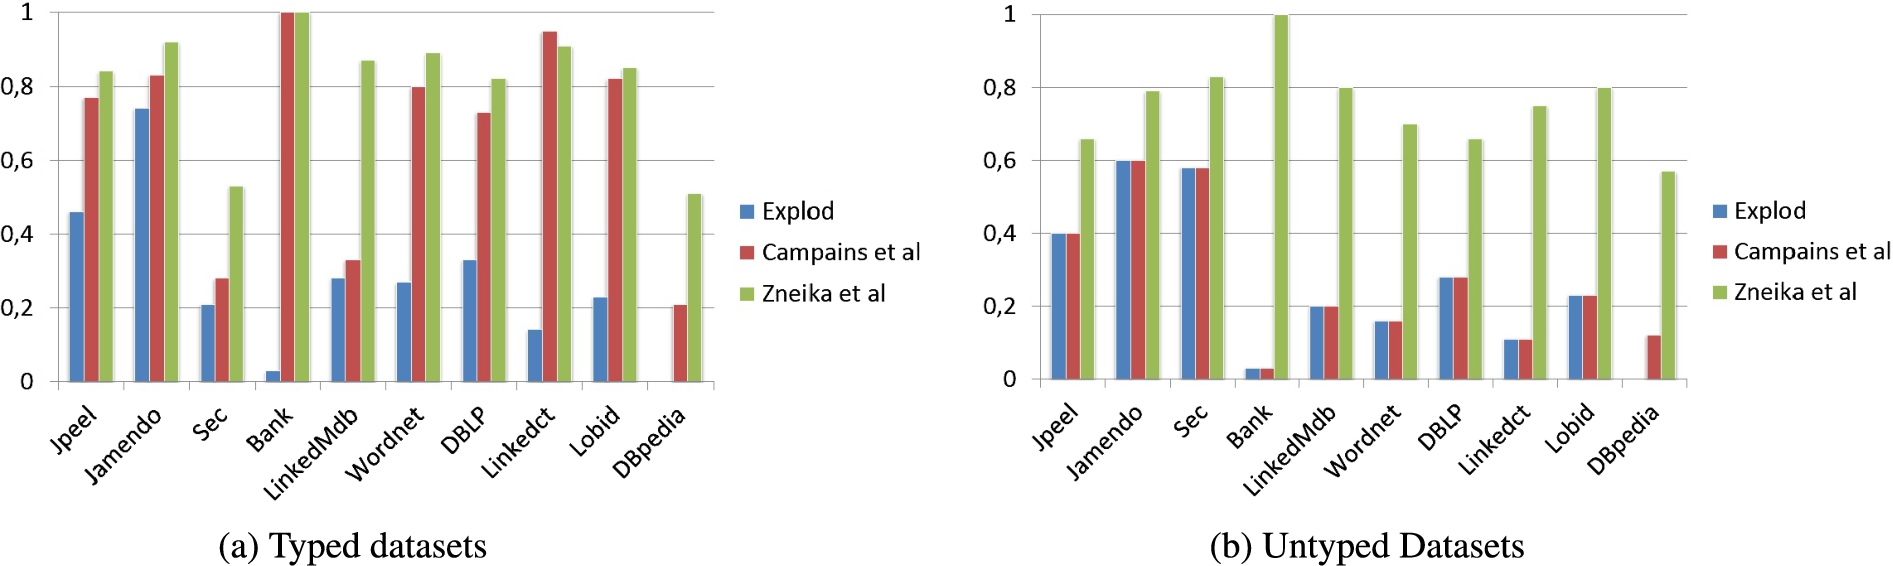
Class precision results for typed/untyped presented datasets at the schema level.
Table 13 shows well that algorithms like ExpLod do not provide quality summaries in extreme cases like the Bank dataset (where we have only one class) or in heterogeneous datasets like LinkedMDB, Linkedct and DBLP, where they report very low class precision values, because instances of the same class in these cases have quite different properties and they cannot be grouped together by ExpLod. This is because the ExpLod algorithm depends on the notion of the forward bisimulation [15] that groups the original nodes based on the existence of common typeof and property links. In other words, two nodes v and u are bisimilar and will end-up in the same equivalent class (pattern) if they have exactly the same set of types and properties. Thus, it might generate a summary where many ideal summary classes are represented by several knowledge patterns. For example, in the Bank dataset case, which contains only one class in the ideal summary, ExpLOD generated 79 knowledge patterns. And as we mentioned in Section 4.1 we have included in our framework a way to penalize these cases by introducing the W(c) exponential function (see equation (7)). Table 13 and Figs 8 and 7 also demonstrate that the Zneika et al. algorithm gives better results, when compared with the other two algorithms, over all the presented datasets, and it showcases that it works well with heterogeneous datasets like the LinkedMdb, unlike the ExpLod and Campinas et al. that give a low class precision with the heterogeneous datasets.
By comparing the results for the typed datasets case depicted in Fig. 8a and the untyped datasets depicted in Fig. 8b. We can easily observe that the behavior of Zneika et al. and ExpLod algorithms in the case of the untyped cases is the same as in the case of the typed datasets, which means that the quality of the summary is not affected by the presence (or not) of schema information in the KB. While we can easily observe the significant impact the absence of typeof schema information had for the Campinas et al. algorithm.
The discussion so far provides some insights on how we can use the proposed Quality Framework to assess the quality of the summaries produced by the different algorithms. Since we are looking at comparing the quality of the computed summary to a ground truth summary provided by an expert in general we can observe that:
the summarization algorithms usually capture correctly the properties involved in the data but miss at different levels (and for different reasons) some of the classes. The Quality Framework provides enough resolution to clearly identify the algorithms that provide a better summary in turn of the classes reported and the quality of this report (e.g. are all properties reported, is the class present as one entity in the computed summary, etc.).
the summarization algorithms do not capture well cases where the data (instances) are multiply classified or where there are quite widespread subsumption relationships.
the summarization algorithms could have quite a few differences when reporting on the contents of the KB and the quality of the summaries could greatly vary and this is mostly because of the differences in the precision of reporting the classes in the summary, including penalizing verbose descriptions (like those reported by Explod). So actually we can capture even fine differences where for example a single class in the ground truth is represented by two in the computed summary.
Table 14 reports the precision, the recall and the F-Measure of RDF summaries at the instance level, based on the same datasets and algorithms as before. The left part of Table 13 shows the results for the typed datasets while the right part shows the results for untyped datasets. For each dataset, we report the precision, the recall and the F-measure values at class and property level. We note that ExpLod produces the best results (actually perfect ones, always 1) since it is not missing any property or class instance because ExpLod works by grouping of even two instances if they have the same set of attributes and types, thus does not add any false positives. We can also note that the instance class precision and the instance recall precision reported in columns
Table 14 shows also that the behavior of Zneika et al. and ExpLod algorithms in the case of the untyped datasets is the same or approximately the same as in the case of the typed datasets, which means that the quality of the summary with regard to the coverage of the instances is not affected by the presence (or not) of schema information in the KB for these two algorithms. On the other hand, we can easily observe the great positive impact left by the absence of typeof schema information for the Campinas et al. algorithm.
Also, Tables 14s, 14t report metrics values at the instance level for the generated RDF summaries of the Campinas et al. and Zneika et al. algorithms over the DBpedia dataset for the typed and untyped cases respectively. From the Table 14t, we can note that Campinas et al. produces the perfect results since it is not missing any property or class instance because for the untyped case, Campinas et al. works by grouping of instances if they have the same set of properties, regardless of how many they are; thus does not add any false positives. On the contrary, the Table 14s shows the Campinas et al. produces a very poor value for the instance level property precision reported in column
From this discussion, we can observe that the summarization algorithms provide results of good quality concerning the coverage of the instances in the KB. The proposed quality metrics clearly show that relying only on this metric is not adequate to judge the quality of a summary since a lot of the algorithms report perfect scores in all measures. But still we have cases where we can distinguish the quality among the results based on the instances covered by the computed summary, especially when algorithms use approximative methods to compute the summary (one algorithm in our case). It is worth noting here that our Quality Framework can capture both under-coverage (when not all instances are represented in the final result) and over-coverage (when some instances are represented more than once or some fictitious instances are included) of instances. With the metrics at the instance level we can capture these fine differences for covering correctly or not and how much the instance in the KB.
Results combining schema- and instance-level metrics
By comparing the results in both cases, it becomes clear why it is important to take into consideration quality metrics that capture information both at the instance and the conceptual level. Otherwise behaviors like the one demonstrated by ExpLod cannot be captured and summaries that are flawed might be indistinguishable from better ones. Overall, we could argue that the Quality Framework introduced in Section 4 is adequate for capturing the fine differences in quality of the summaries produced by the three algorithms. We can also see that with a closer look at the results we can gain or verify insights on how specific algorithms work and the quality of the summaries they produce.
One final metric to be considered is whether the final graph is connected or not and appears as more than one connected components. This might mean that the summarization algorithm while captures correctly the important properties and classes in the KB fails to provide at the end a connected graph. This is important because this might signify whether the summary graph is usable or not for answering, for example, SPARQL queries. Table 12 reports the connectivity metric values for the summaries produced by the three discussed algorithms over all the datasets described in Table 11. It shows that the ExpLod has always high values for this metric which means it provides a disconnected summary, while the two others have always 1, which means that these two algorithms provide a connected summary (at least as connected as the ideal summary; fully connected in our examples).
Connectivity metric results

Connectivity metric results
So measuring the quality at the schema level, the instance level and the connected components of the graph can give us a detailed view of the strengths and weaknesses of a summary and decide whether to use it or not depending on the potential use and application. We avoided combining all the measures together because this might blur the final picture. The idea is not to necessarily prove an algorithm as better or worse (we can do this to a great extend through the different F-measures) but mainly to help the user understand the different qualities of the summaries and choose the best one for the different needs of the diverse use cases.
Precision, Recall and F-measure at the Schema level. The

Precision, Recall and F-measure at the instance level. The

In this paper, we introduced a quality framework by defining a set of metrics, that can be used to comprehensively evaluate any RDF summarization algorithm that is reported in the literature. The metrics proposed are independent of the algorithm, the KB (thus the data) and the existence or not of schema information within the KB. The Quality Framework proposed in the paper captures correctly various desirable properties of the original KB. So, it accounts for:
the conciseness of the summary by: Penalizing the verboseness in the form of multiple patterns representing a single class in the ideal summary Capturing the similarity of the different patterns or groups created by the summarization algorithm with the corresponding ideal summary parts, even if this similarity is not 100% the connectedness of the summary by: Introducing a metric on the connectivity of the summary, thus prioritizing connected summaries against not so connected ones the comprehensibility of the summary by: Covering the schema part and thus understanding how good a summary is at the structural level Covering the instance part and thus understanding how good a summary is at covering the instances that are in the KB Understanding how well connected the summary and thus the content of the KB is Capturing subtle differences in the result summary, like the omission of just one property or the approximation over the number of instances that allows the user to really understand why and where there is a problem the overall quality of the summary so that it can be compared with other summaries by combining the different metrics like precision, recall, F-measure at different levels with connectedness in order to allow for the overall comparison, while the different metrics still provide a more detailed idea on where there are problems with a computed summary.
We made a big effort on validating that the proposed Quality Framework correctly captures the differences present in different summaries by evaluating three different algorithms (that work in substantially different ways) over ten different and diverse datasets, showcasing that indeed the different aspects are correctly captured in terms of quality and that the results are easily matched towards the status of the KB.
To the best of our knowledge, the literature does not report any other effort that tries to capture the quality properties of RDF graph summaries both at the concept (schema) and instance level in a complete and comprehensive way. The experiments showed that using the proposed set of metrics we are able now to compare the quality at different levels of the RDF summaries produced by different algorithms found in the literature, applied on different and diverse datasets and extract useful insights for their suitability for various tasks.
We plan to extend this work by applying the framework to Linked Data sources where quality results might be different for each part of the linked datasets. We would like to explore both theoretically and experimentally whether there are ways to provide consolidated quality metrics treating the linked KBs as one, which will go beyond simply averaging the individual quality results. We would also like to use the framework to assess the quality of the results of more algorithms, in order to validate experimentally its suitability.