
Abstract
The increasing adoption of the Linked Data principles brought with it an unprecedented dimension to the Web, transforming the traditional Web of Documents to a vibrant information ecosystem, also known as the Web of Data. This transformation, however, does not come without any pain points. Similar to the Web of Documents, the Web of Data is heterogenous in terms of the various domains it covers. The diversity of the Web of Data is also reflected in its quality. Data quality impacts the fitness for use of the data for the application at hand, and choosing the right dataset is often a challenge for data consumers. In this quantitative empirical survey, we analyse 130 datasets (≈ 3.7 billion quads), extracted from the latest Linked Open Data Cloud using 27 Linked Data quality metrics, and provide insights into the current quality conformance. Furthermore, we publish the quality metadata for each assessed dataset as Linked Data, using the Dataset Quality Vocabulary (daQ). This metadata is then used by data consumers to search and filter possible datasets based on different quality criteria. Thereafter, based on our empirical study, we present an aggregated view of the Linked Data quality in general. Finally, using the results obtained from the quality assessment empirical study, we use the Principal Component Analysis (PCA) test in order to identify the key quality indicators that can give us sufficient information about a dataset’s quality.
Introduction
Since its inception, the Linked Open Data (LOD) Cloud [53] has been a point of reference to the Linked Data community, comprising a number of linked datasets crawled on the Web of Data or added to the LODCloud group in the datahub.io registry.1
See
This widespread and rapid adoption of the Linked Data principles has brought an unprecedented dimension on the Web, contributing to the transformation of the Web of Documents to a Web of Data. Thanks to links between the data, one can jump from one source to another in order to retrieve more complete information and answers. Similarly to the Web of Documents, these sources, heterogeneous with regard to their domain, have highly varying quality [30]. Document quality is often only subjectively assessable, and indirect measures such as Page Rank and HITS (hubs and authorities), which calculate the importance of a document vis-à-vis the Web (via links), give a good indication of whether a document is of good quality or a good authoritative source. In a parallel situation, resources in the Web of Data are not simply text (or other HTML components such as tables, images) and links. For LOD datasets, indirect link related quality measures are much less meaningful, (since linked datasets are prone to link spamming [26]) but at the same time a number of other more direct quality indicators exist.
Linked Data resources are usually complex structures encompassing some existing thing (an object in the real world), giving it semantics (i.e. meaning) and possibly linking to other resources, that both machines and humans can understand. According to the editors of the W3C Data on the Web Best Practices document, “data quality can affect the potentiality of the application that uses data, as a consequence, its inclusion in the data publishing and consumption pipelines is of primary importance.” – [38, §9.5]
Making data quality more transparent and easy-to-access is a key factor for the wider penetration of Linked Data and semantic technologies. In this study, the research question we aim to answer is:
Using Luzzu [17], a quality assessment framework for Linked Data, and a number of quality metrics (including some probabilistic approximation metrics), this study produces a quality metadata graph for each assessed dataset (publicly available for consumption as Linked Data resources), represented in terms of the Dataset Quality Vocabulary (daQ) [18].3
Luzzu’s underlying semantic framework uses daQ, which has existed prior to the more recent Data Quality Vocabulary (DQV) recommended by the W3C [2]. But since properties and classes from both daQ and DQV are marked as equivalent, it is easy for reasoners to transform instances from one vocabulary to another.
The remainder of this article is structured as follows. We first discuss related work regarding analysis of various aspects of Linked Data (Section 2). In Section 3 we perform a primary investigation towards the openness of the Linked Open Data, followed by the dataset acquisition description in Section 4. Following the data acquisition process, in Section 5 we assess and discuss the quality of these datasets against 27 metrics related to four different quality categories as described in [60]. We then use the assessment results in order to identify the non-informative quality metrics in Section 6, followed by the conclusions in Section 7.
Empirical studies encourage stakeholders to engage in further discussions and enable them to improve the current state of the discussed topic, in this case of the quality of linked datasets. The main contribution of this study is a large-scale analysis of the quality of linked open datasets. We assess various data dumps, SPARQL endpoints that are available and portrayed in the 2014 LOD Cloud snapshot over 27 quality metrics related to different inherent and extrinsic aspects of Linked Data. In this section, we review literature that analyse the quality of various aspects of Linked Data, as a prequel to the large-scale analysis described in this article.
Schmachtenberg et al. [54] crawled the Web of Data in order to present the 2014 version of the LOD cloud diagram. Each crawled dataset was categorised in a topical domain, whose categorisation was then used in one of our metrics, re-use of existing terms (Metric IO1). Furthermore, during this study, the authors also analysed how different best practices were adopted in the crawled linked datasets. Some of these best practices overlap with the quality metrics presented in our study, including best practices related to the adoption of vocabularies and metadata. In our work, we use the 2014 version of the LOD cloud to better understand the quality of the Web of Data.4
A more recent version of the LOD cloud was released on 20 February 2017, i.e., after we had conducted our study.
Throughout the years, a number of researchers in Linked Data quality have come up with numerous quality metrics that were consolidated in a systematic survey by Zaveri et al. in [60]. The authors of this systematic survey group 69 different quality metrics in 18 dimensions and four categories: Accessibility, Intrinsic, Contextual, and Representational. Our empirical investigation towards the quality of the Web of Data complements the survey undertaken in [60], with 27 out of the 69 described metrics being implemented and assessed over a number of datasets (cf. Section 5.1).
Based on Zaveri et al. [60] and the ISO 25012 data quality model [34], Radulovic et al. [49] present a quality model for Linked Data, where quality characteristics and their base and derived measures were semantically formalised in a comprehensive model. The model was evaluated on a subset of DBpedia; mainly instances of type Person and Place. Our contribution covers eight of the quality characteristics mentioned in [49] that are also part of [60]. However, our resulting metadata does not have the low granularity level that can be expressed with the model defined by Radulovic et al. [49], as for our study we use Luzzu [17] as our quality assessment framework and the Dataset Quality Vocabulary (daQ) [18] for metadata. Nonetheless, further discussion on the different models and frameworks is out of the scope of this study.
In [31], Hogan et al. crawled and assessed the quality of around 12 million RDF statements. The main aim was to discuss common problems found in RDF datasets, and possible solutions. More specifically, this work aimed at uncovering errors related to accessibility, reasoning, syntactical and non-authoritative contributions. The authors also provided suggestions on how publishers can improve their data, so that the consumers can find “higher quality” datasets.
In a follow up article [33], Hogan et al. conducted a larger empirical study on Linked Data conformance, with around 1 billion quads (i.e. triples + graph identifier) assessed. The aim of this study was primarily to define a number of quality metrics from various best practices and guidelines, and to assess the level of conformance of the assessed datasets against these metrics. The quality metrics considered in our work overlap with seven metrics defined in [33]: (i) avoiding blank nodes; (ii) keeping URIs short; (iii) avoiding prolix features; (iv) re-using existing terms; (v) dereferenceability of resources; (vi) usage of external URIs; and (vii) human-readable metadata. The metrics in our assessment are similar to those in [33], with some adjustments as we explain in Section 5. Apart from a larger set of quality metrics in this article, one must point out that two corpuses are different, where in [33] the authors used data crawled from the Web of Data. Nevertheless, the conclusions from [33] are more or less the same, four years later, that publishers might forgo certain quality guidelines as they might be impractical. This can be seen from the distribution of quality metric values amongst the datasets, in both studies.
Färber et al. [21], give a systematic comparison of the quality of five knowledge graphs: DBpedia, Wikidata, Freebase, OpenCyc, and Yago. These knowledge graphs were assessed over 34 quality metrics, most of which are also included in our empirical study. The study performed by Färber et al. demonstrates that the KGs perform differently across most metrics, mainly dependent on issues such as the choice of modelling. Nonetheless, there are some of the quality metrics where all KGs either conform to, for example the syntactic validity of literals, or otherwise vary in their conformance, for example in the case of the inconsistencies regarding the range of relations metric. The five KGs assessed in [21] have more or less similar problems to those described in our empirical study, however, due to the lack of depth in terms of the variety of datasets assessed in their study, it makes a comparison between studies difficult. For example, if the description of resources metric are compared, Färber et al. study with five KGs resulted in a mean value of 94% (including DBpedia which was part of both studies), whilst our study gives us a far lower value of 43.76% due to the fact that there are a larger number of low scoring datasets that penalises the overall mean value. Therefore, Färber’s et al. study can be looked as being complementary to our empirical study performed on the LOD cloud, scrutinising in more detail large cross-domain KGs, rather than giving an overview of the quality of a number of varied domain datasets. Whilst this study is of utmost importance, unfortunately the results from Färber et al. study are only available in a non-structured format; CSV.
Buil-Aranda et al. [4] conducted a number of long-term experiments, mostly related to availability quality (extrinsic) metrics on around 480 SPARQL endpoints. The authors report that only one third of the endpoints have descriptive metadata such as VoID and service descriptions,5
The quality of literals in the Web of Data was analysed in [8], by means of a toolchain that was implemented and integrated into LODLaundromat [9]. Beek et al. looked and assessed various properties of literals. The authors identified a taxonomy of literals that can be grouped in two types: datatype literals and language tagged literals. These two had various metrics implemented, two of which are (a) checking the validity of a datatype against its lexical value; and (b) checking the consistency between a literal’s string text against the given language tag using an external language identification service. These two were implemented in Luzzu with the former metric being discussed in our empirical survey on the LOD cloud datasets.
In a recent study Assaf et al. [5] shed light on the quality of the metadata of datasets available in the Linked Open Data Cloud. This metadata was used in our dataset acquisition process. In [5], the metadata is checked for general, access, ownership and provenance information. The authors concluded, that metadata quality is in a bad condition. More specifically, licensing and accessibility metadata contains noisy data, resulting in incorrect information. We discuss the quality of LOD Cloud metadata in more detail in Section 3.
Suominen and Mader [56], define a number of quality metrics in order to assess SKOS vocabularies with the aim of identifying their re-use in applications. The assessment is based on three categories: (i) labelling and documentation; (ii) structural issues (e.g. class disjointness issues); and (iii) Linked Data issues (e.g. invalid URIs). The authors reported that most of their representative SKOS vocabularies contained structural errors, and presented a set of correction algorithms to address such issues. These issues discussed in [56] are also relevant to linked datasets, which we also discuss in this article, however in Suominen and Mader’s article these intrinsic and extrinsic aspects are discussed in light of Linked Data vocabularies, more specifically SKOS-driven vocabularies.
In [24], Giménez-García et al. focus on dataset re-use to assess the trust of Linked Datasets. The authors use LOD Laundromat data dumps in order to compute PageRank values on datasets and rank these datasets based on their trustworthiness value. Results show that popular datasets such as DBpedia and Geonames feature in the top 10, however their approach also captures services such as purl.org , which hosts multiple datasets. In this paper we assess trustworthiness from a different aspect, by analysing provenance information of a dataset.
Meusel and Paulheim in [42] analyse a number of quality issues in schema.org for Microdata and compare the results with the findings using linked datasets in [31]. The metrics studied in [42] include: (i) usage of undefined types and properties; (ii) misuse of datatype or object properties; (iii) violation of datatypes; and (iv) incorrect usage of property domain and range. The analysis performed in [42] shows that the Microdata formats adopting schema.org are prone to be less problematic with regards to undefined elements than LOD, however fares worse in the other three metrics against the LOD results analysed in [31]. In this paper we will discuss these metrics and assess them against the 2014 version of the LOD cloud.
Having metadata as part of a published dataset is the first step in putting a dataset on the open data map (thus encouraging discoverability [50]), as it is generally the first access point for consumers who wish to use the published data. Metadata ensures that it complies with best practices by making it self-descriptive [29, §5.5]. Therefore, ‘doing metadata right’ is a must for any kind of published open data. In a holistic assessment of open government data initiatives, Attard et al. [6] describe a number of initiatives that had the aim to assess the quality of metadata. This shows further the importance metadata is given in open data.
Open Data, in terms of the Open Definition should be able to …be freely used, modified, and shared by anyone for any purpose [45]. have a defined open license or status – having a license is the only way to define boundaries between the publisher and the consumer (who can also re-publish the data without worrying about using the data improperly); be accessible, i.e. in the case of Linked Open Data a dataset should have some entry point such as a data dump or SPARQL endpoint (preferably referred to in dataset metadata defined by standard vocabularies); be machine readable, if possible interoperable, for example, by using RDF; have an open format.
Drawing parallels with Linked Open Data, Berners-Lee proposed the five-star open data principles, in which the first three stars are similar to the principles of the Open Definition, whilst the last two are more related to the Linked Data principles, i.e. (4th star) using URIs to identify things, and (5th star) linking between the published data and external data [11].
Heath and Bizer [29] provide a checklist for Linked Data publishing, which includes the provision of provenance metadata, licensing metadata, and dataset level metadata in terms of standard vocabularies such as VoID [3] or DCAT [40]. Schemas like DCAT and VoID enable metadata description in a semantically interoperable format and can be exchanged between various agents. Currently, there are further schema initiatives, including the Dataset Quality Vocabulary (daQ) [18] and the compatible W3C Data Quality Vocabulary (DQV) [2] to represent quality metadata for datasets, and the W3C Data Usage Vocabulary (DUV) [39] to describe various factors of a dataset such as citation and feedback from a human consumer perspective.
Our study is based on the LOD Cloud snapshot that was taken in 2014, containing about 188 million crawled triples.7
This number was taken from
For this analysis we use
application/rdf+xml (17); application/rdf xml (4);
api/sparql (368); sparql (4);
text/turtle (75); ttl (10); rdf/turtle (7); turtle (2).
RDF (187) [possibly application/rdf+xml, but this had to be verified manually];
xhtml, rdf/xml, turtle (2) [this is one tag with three possible formats];
example/* (2);
mapping/twc-conversion (5)
In order to identify which datasets had some kind of access point, an initial experiment was performed on the 2014 LOD Cloud snapshot.10
These initial experiments were performed in December 2015, prior to the actual quality assessments. This was part of the data acquisition process which is described in Section 4.
We added a validation stage which is described in Section 4.

Coloring the LOD Cloud Datasets with various Access Methods (Data Dump, VoID, SPARQL Endpoint, or a combination).
Licences are the heart of Open Data. They define whether third parties can re-use data or otherwise, and to what extent. In Linked Open Data, one would expect that such licenses are machine readable using predicates such as
?ds dcterms:license ?license .
?ds dcterms:rights ?rights .
In total, only 40.42% (230 in total) of all datasets represented in the current LOD Cloud snapshot have some kind of license (or rights) defined in a semantic manner. This is higher than the 9.96% reported by Schmachtenberg et al. in [54], where the authors searched for triples with the dataset itself as the subject and a predicate containing the string “licen” or “rights”. In Table 1, we list the licenses used within the LOD Cloud snapshot, with the Creative Commons Attribution License (cc-by) being used the most (93 instances), followed by the Creative Commons Attribution Share-Alike License (cc-by-sa; 47 instances) and the Creative Commons Attribution Non-Commercial V2.0 License (cc-by-nc 2.0; 31 instances). In spirit of the Open Data definition described in the introduction, the cc-by-nc 2.0 license is deemed as a non-conformant13
A number of data publishers declared the datasets’ license (and subsequent rights description) in a human readable manner in the textual description, for example
As identified by OpenDefinition.org
List of licenses used in the metadata, extracted by machine readable properties and from human readable descriptions (figures in brackets)

Coloring the LOD Cloud Datasets with Licence Availability extracted either via machine readable properties or using regular expressions from textual descriptions.
From our preliminary investigation on the available metadata, we have identified that approximately less than half of the datasets should not be part of the Linked
As of 2nd March 2016.
In this section we detail the process for identifying possible datasets that are used for the empirical study. Our main goal was to automate the whole process, whilst retrieving as many datasets as possible. The metadata of the 2014 LOD Cloud was taken as the primary corpus for this study. Each dataset in the LOD Cloud, grouped by their fully qualified domain name (FQDN),21
A fully qualified domain name (FQDN) is the complete name for a specific host, for example de.dbpedia.org is the FQDN for the German version of DBpedia, whilst pt.dbpedia.org is the Portuguese version of DBpedia.
For this initial experiment we retrieved the distribution resources (from the
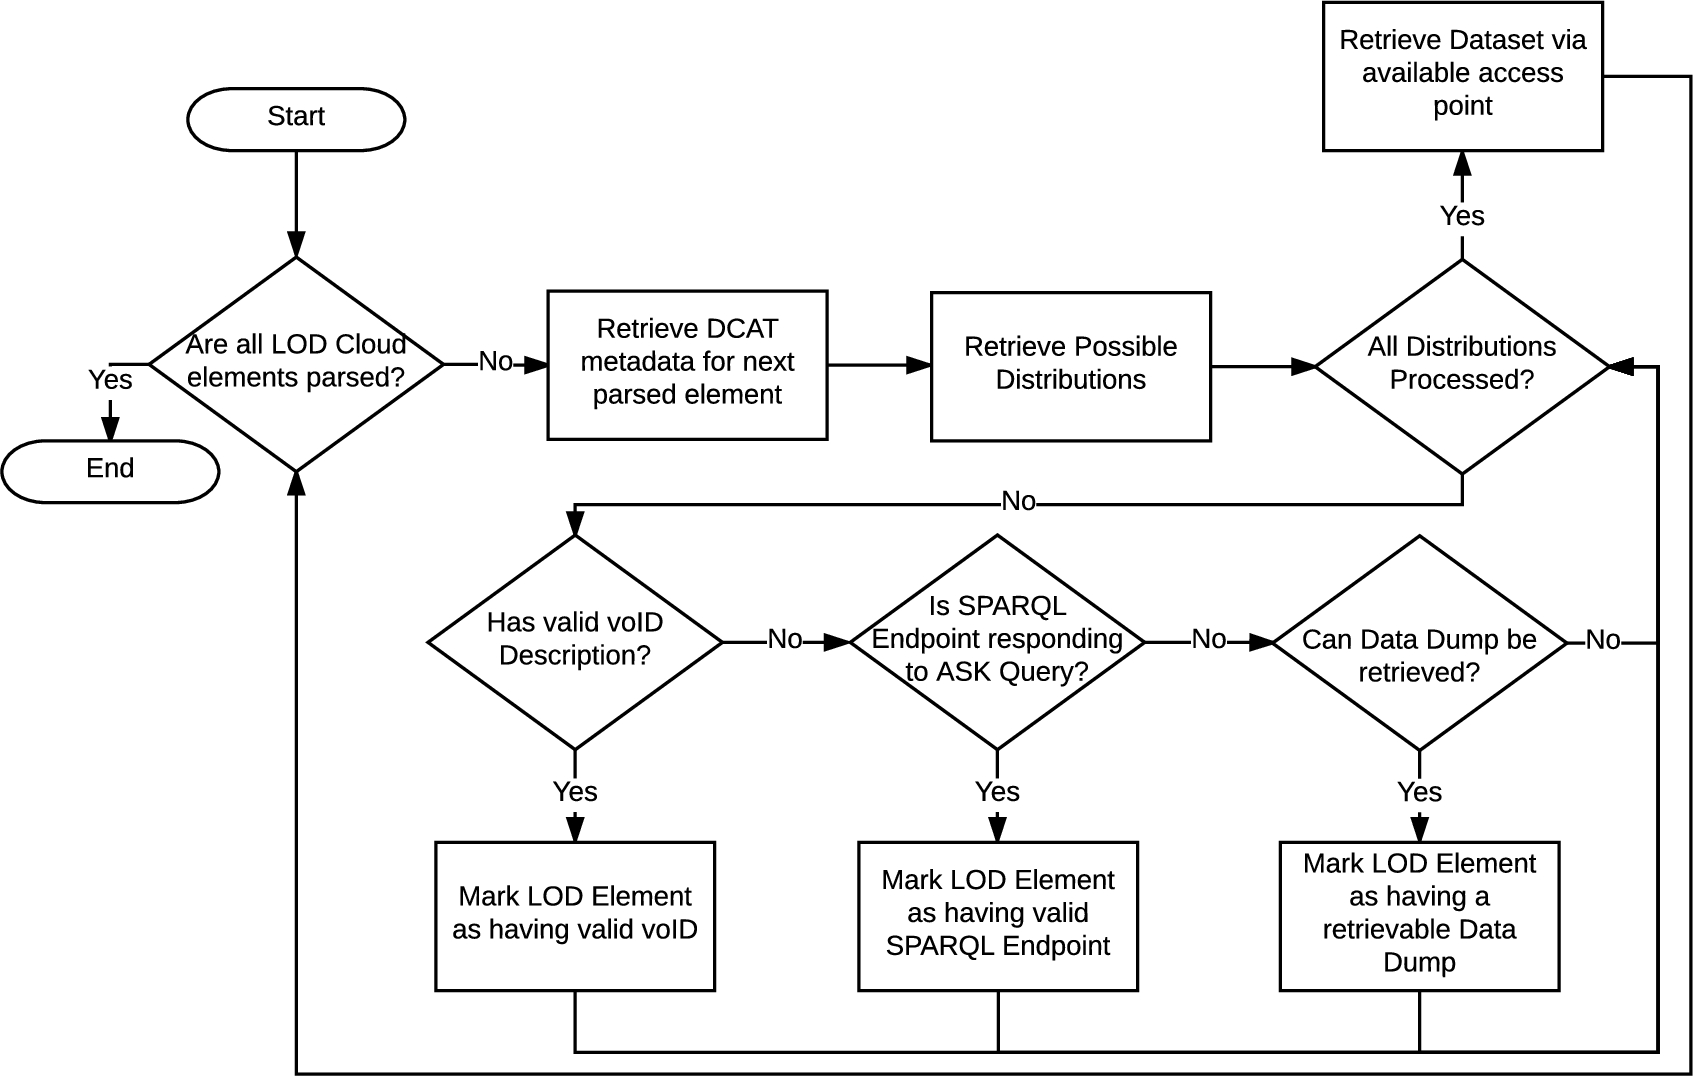
A high-level flowchart depicting the marking and retrieval process of datasets from the LOD Cloud.
With regard to data dumps, we looked for media types that are generally associated with the Semantic Web, such as
All experiments can be replicated by downloading the scripts available on GitHub:
Similarly, for SPARQL endpoints we looked at those distribution resources with an
VoID descriptions were retrieved from media types containing
Following this methodology the acquired dataset collection has a number of known bias factors:
the harvesting of datasets from the LOD Cloud was performed in December 2015 and the download of the data dumps between December 2015 and February 2016, thus the quality assessment of these datasets reflects the dumps available at the time of download (this does not apply to SPARQL endpoints);
the downloaded data dumps cover a wide range of tagged media types (also considering incorrect tags), but our assessment is limited to the following:
distributions with
SPARQL endpoints that did not respond to the ASK query were considered unavailable and thus not included in the follow-up assessment.
The downloaded data dumps require some data preparation prior to assessment. Each dataset might have multiple distributions, some defining different sub-datasets, others defining the same dataset with different media types (for different serialisations). All dumps in these distributions are downloaded, and then converted to n-quads, merged, sorted, and cleaned by removing duplicate quads. All datasets are identified using their fully qualified domain name. Figure 4 illustrates the a summary of the datasets’ access points identified during the acquisition process.

A Venn Diagram illustrating a summary of the datasets’ access points.
This study complements the work undertaken in the survey by Zaveri et al. [60] and the work that the survey refers to, by analysing the quality of a collection of LOD Cloud datasets against a number of metrics classified in the mentioned survey. In general, the assessment is done locally, meaning that no dereferencing of external resources is done, unless required by the quality metric. For each data quality metric we plot a box-and-whiskers chart to summarise metric values and display them on a single graph. Furthermore, with the box-and-whiskers plot, we describe the sample’s spread of quality values amongst the LOD Cloud datasets. During the assessment we also collect a sample of the quality problems found during assessment, in order to describe typical problems found in LOD datasets. For each assessed metric we discuss the mean, median, and standard deviation in order to describe the quality values of each dataset collectively in a statistical manner. These descriptive statistical measures present different point of view about the data. The mean and median values are used to find the central values of a set of numeric values, in our case, the quality values of a particular metric over all assessed datasets. The standard deviation value is calculated in order to measure the spread of the data, allowing us to measure the diversity of conformance to a particular metric of the assessed datasets.
Choice of data quality metrics
In this empirical study we assess the datasets against 27 quality metrics out of 69 metrics described in [60] and related literature, and two additional and novel quality metrics describing provenance information, that were identified from the recent W3C Data on the Web Best Practices guidelines [38]. The majority of the 27 metrics are objective metrics, that is, the metrics’ results will not be influenced by the assessor’s opinion. For the only subjective metric in this study (re-use of existing terms, cf. Metric IO1), we used the LOD Cloud category classification as the basis of our classification in order to limit any bias. The rest of the metrics identified in [60] were either (1) difficult to implement because of the lack of evidence, for example metric description lacked description depth; or (2) were subjective, meaning that it would be difficult to replicate. However, in the future we plan to implement more quality metrics described in [60] in a form of a Linked Data quality assessment as a service.
Since the assessed datasets come from a variety of domains, a certain quality metric might not be relevant, hence some datasets might fare poorly for these particular metrics. Following the overall quality assessment, we provided a service23
The choice of generic quality metrics was based solely on the classification in [60]. Nonetheless, there is no study confirming the usefulness of such metrics, and whether or not these quality metrics are informative in a generic assessment such as in this study. Moreover, some metrics may be highly correlated with others and hence provide no additional information. In order to examine this phenomenon, following the quality assessment of the datasets, we statistically analyse the assessment results in order to determine which of the chosen quality metrics are key quality indicators.
Prior to the quality metrics discussion, we will cover some preliminaries related to the RDF data model and common terminology used across metrics. For a full description of the RDF semantics, we refer the reader to [28].
RDF data model
RDF is a graph-based data model, in which the basic structure is a triple
A quad q is an ordered pair of
Linked Data entities
A Linked Data entity
Data-level constants
A data-level constant is defined by Hogan et al. in [33] to be the subject or the object of a triple or quad, when the predicate is not
Terms commonly used throughout the description of metrics
Terms commonly used throughout the description of metrics
List of metrics assessed in the Representational Category together with the assessed mean value (μ), median value (
We define a function
External vocabularies
A vocabulary dereferencer [52] function
Metrics terminology
In Table 2 we list and explain the terms and symbols commonly used throughout the 27 metrics. Some specific one-off terms are explained directly where used.
Representational category
In this section we look at metrics related to the design of data, or in other words: how well the data is represented in terms of common best practices and guidelines. Zaveri et al. [60] categorised a number of metrics in this category within the four dimensions Representational Conciseness, Interoperability, Interpretability and Versatility. In Table 3 we list the metrics that are assessed in this category, together with a summary of assessment results24
A visualisation of the LOD Cloud against the representation category quality values is available at
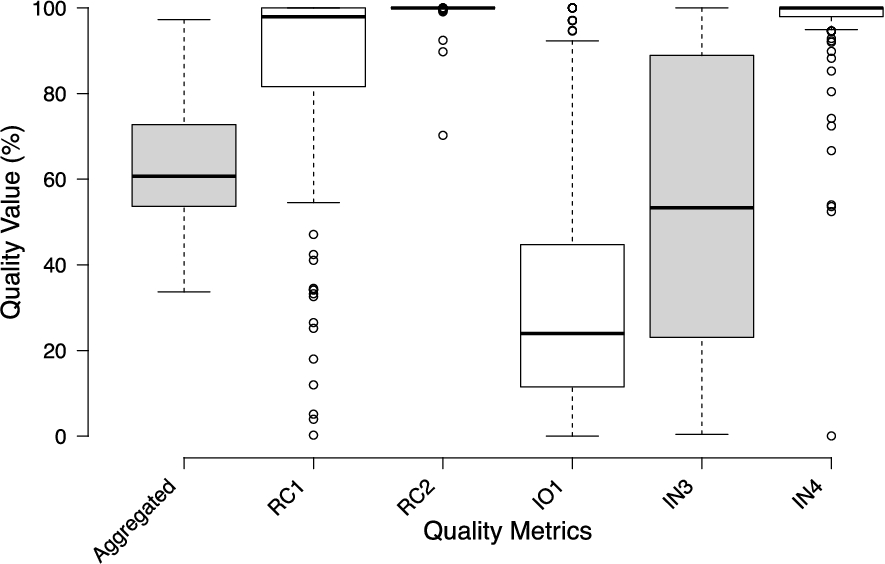
Representational category box plot. The different serialisation formats metric and usage of multiple languages metric are excluded in the plot, but their values are included in the aggregated result.
Classified in the representational-conciseness dimension, this metric observes the length of URIs. In the Cool URIs document [52], the editors remarked that apart from providing descriptions for people and machines, the best URIs are simple, stable, and manageable.
This metric focuses on the simplicity aspect of this definition, where by simplicity the editors of the same document mean that having short and mnemonic URIs are easier for humans to remember (e.g.
Metric Computation: The metric computation is based on the W3C best practices for URIs, where the editor suggests that a URI should not be longer than 80 characters [58, §1.1]. Furthermore, URIs with appended parameters are considered as bad, irrelevant of their length. The metric can be quantified as follows:
Discussion: A box plot with the quality values is illustrated in Fig. 5. The box plot for this metric (RC1) suggests that publishers tend to have quite different inclinations on how long the URI identifiers should be. The sample over the LOD Cloud is centred at a median of 97.92% with a standard deviation of 24.90%. A number of outliers (around 13% of the datasets), were detected. These are datasets that scored lower than 54.55%. We also notice that the population is negatively skewed (i.e the median is closer to the third quartile). The median quality value across the assessed datasets is around 84.07%, with 69% of the datasets scoring more than 90%, and 28% of the datasets scoring 100%. From the sample problem report we extracted during the assessment, 14.65% of the URIs were parameterised whilst the rest were URIs longer than 80 characters. This metric has two drawbacks. First, our metric takes into consideration external URIs, however, we acknowledge that the length of such external URIs cannot be influenced by the datasets’ publisher. A solution for this is that the metric looks only at locally minted URIs. The second drawback of this metric is the lack of discriminative power, since URIs with 80 characters are adequate, whilst longer ones are deemed to be non-conformant with the guidelines set in [58, §1.1]. In order to avoid this discriminatory power problem, Hogan et al. [33, §5.1 – Issue IV] calculate the metric value based on the mean length of the URIs in a dataset, rather than relying on the 80 character limit, promoting those datasets that have short URIs.
The editor of the Common HTTP Implementation guidelines [58] states that 80 character limit is not a technical limitation but rather a practical goal one should pursue. There might be various reasons for publishers to use longer URIs. For example, URIs can comprise some structure, such as a directory scheme. Moreover, in a recent article by Szász et al. [57], the authors discussed the idea of self-unfolding semantic URIs, where such URIs follow a specific pattern and template that would result into a set of RDF triples “on-demand”. These self-unfolding URIs might be longer than the 80 character limit, but the benefits of such URIs include frequent complex insertion in RDF triple stores, for example in sensor network streams. Therefore, we deem that this 80 character practical limit suggested in [58, §1.1] has its own limitations and could affect the quality value of datasets where publishers cannot do without lengthy URIs, for example having resources with a multi-level domain name such as in the case of university URIs.
(RC2) Minimal usage of RDF data structures
The usage of RDF data structure features, more specifically reification, containers, and collections, is discouraged due to their syntactic/semantic complexity. Despite the fact that a number of efforts were made in order to facilitate the use of such data structures (e.g. the introduction of property paths25
Metric Computation: This metric detects the use of standard RDF data structure features. More specifically, this metric checks quads as suggested in [33, §5.3 – Issue VIII]:
if the predicate is if the predicate is one of
The value of this metric can be quantified as follows:
Discussion: Similar to the findings of Hogan et al. [33], most publishers do not use RDF data structures. In our assessment 87.2% of the publishers use none, compared to the 78.7% reported by Hogan et al. This is reflected in the short box plot illustration for this metric (RC2 – Fig. 5), with the interquartile ranges and whiskers all being close to 100%. The mean quality value of this metric is 99.44% and the calculated standard deviation is
Nonetheless, this metric punishes datasets where ordering is essential. For example, the dataset with the lowest quality value (70.25%) for this metric is
Vocabulary re-use is widely advocated. For instance, Bizer and Heath [13] argue that re-using terms from known vocabularies makes it easier for applications to process Linked Data, thus increasing interoperability between agents. Schemas for different domains are publicly available; also via registries such as the Linked Open Vocabulary (LOV) portal.26
Metric Computation: This metric assesses if a dataset re-uses relevant terms in a particular domain. In particular, this metric checks if a property or a class (in case the predicate is
We identify overlapping classes and properties in the same manner as defined in [33, §5.3 – Issue IX], with the set of known vocabularies. The metric counts the number of external classes and properties for a particular domain:
Discussion: In this empirical study, we used the LOD Cloud classification in order to identify the domain of an assessed dataset. The LOV service was used in order to fetch vocabularies related to the datasets’ domain. With the pre-defined tags associated to each dataset, we ensured that each dataset is assessed solely based on its domain; relying on the LOV service to provide us with relevant public vocabularies. Nonetheless, using the LOV service comes with two potential pitfalls that can affect the results of this metric:
Our assessment might have either missed some vocabularies, or expected datasets to use terms from a vocabulary which has been overlooked by the publishers;
It might be the case that a dataset publisher registers the vocabulary used in that dataset, in which case the metric would return a value suggesting re-use.
The box plot for this metric (IO1 – Fig. 5) is comparatively (against the other metrics in this category) long and positively skewed, suggesting that most values are small with some larger values. This also suggests that there is a lack of conformity on the principle of re-use; only few publishers rely actively on the re-using vocabularies (≈10% of datasets have a quality value of > 90%), with 8.8% of the datasets being outliers in this case as they have a quality value larger than 92.32% (i.e. the upper whisker value). The sample is centred at a median of 24.00% with a standard deviation of 29.10%, and a mean value of 34.01%, indicating low overall re-use. One possibility is the fact that publishers (such as DBpedia) use local terms and properties with few external properties (e.g.
Our current implementation of this metric does not take into account the best practice of introducing user-defined terms by linking them existing terms using predicates such as
The invalid usage of undefined classes and properties metric is classified under the interpretability dimension [60], targetting the technical representation of the data itself. Using classes and properties without a formal definition is undesirable, as agents would not be able to understand how the data should be interpreted, for example, during reasoning. Errors leading to such invalid usage include capitalisation errors (e.g.
Metric Computation: This metric measures the number of undefined classes and properties in the assessed dataset:
In cases where slash URIs are used, dereferencing the namespace does not necessarily resolve the schema; therefore the term is used to resolve the term itself.
Discussion: The box plot for this quality metric (IN3 – Fig. 5) covers a range of 99.58%. This suggests that data publishers are using a wide range of defined and undefined classes and properties. Furthermore, the quality value is centred at a median of 53.33% with a standard deviation value of 32.18%, whilst the mean quality value is 54.48%.
A higher value means that publishers were using fewer undefined terms in their dataset. From our assessment, 30.80% of properties used were undefined. Some of the undefined terms were possibly previously defined. For example, for the rkbexplorer datasets, the publishers use terms from the aktors.org namespace, which now resolves to a personal blog. As another common pattern of undefined terms, we noticed the use of the wrong namespace for a term that did exist in a similar namespace, for example,
Blank nodes are undesirable in Linked Data because they cannot be externally referenced, which conflicts with the two Linked Data best practices interlinking and re-using. In simple terms, the scope of blank nodes is “limited to the document in which they appear” [29]. Moreover, the existence of blank nodes can cause a number of problems during Linked Data consumption and when performing certain tasks, such as deciding whether two RDF graphs are isomorphic.
Metric Computation: This metric assesses the usage of blank nodes within the subjects and objects. The metric value is assessed as suggested in [33, §5.1 – Issue I]:
Discussion: The box plot (IN4) illustrated in Fig. 5, is relatively short, suggesting that most data publishers agree to avoid blank nodes. The median value is 100%, the standard deviation is 12.15%, whilst the mean quality metric value of 96.01% confirms the generally high conformance with this metric.
Whilst the majority of data publishers use blank nodes sparsely or not at all (around 85% of the datasets score higher than 94.93%, which is the lower whisker limit), there are a number of datasets marked as outliers consequently stretching the standard deviation. In particular, the prefix.cc dataset uses blank nodes in almost every triple. This dataset affected the standard deviation significantly, which otherwise would be considerably lower than in [33, §5.1 – Issue I]. One should note that the corpus in [33] contained FOAF profiles, which traditionally, according to Hogan et al. [33], may contain many blank nodes. In certain situations, the usage of blank nodes is due to RDF data structure features and OWL axioms, as these structures and axioms use blank nodes as the encoding, though in general avoiding them means that resources in a dataset are more likely to be re-used for linking.
(V1) Different serialisation formats
An RDF data model can be serialised using a variety of formats, including RDF/XML, RDFa, Turtle, N-Triples, N-Quads, and JSON-LD. For example, Web applications prefer the JSON-LD format, rather than having to use some parser, as the JavaScript environment handles JSON data internally. The different characteristics of each serialisation brings about different pros and cons, as described in [29, §2.4.2]. The rationale of this metric is to assess whether various consumption methods are supported. Ensuring that a dataset is available in multiple serialisation formats facilitates its use. The metric is classified under the versatility dimension [60].
Metric Computation: This metric checks whether a dataset has multiple serialisation formats defined in its metadata, by verifying that multiple quads having
Discussion: In most cases, the publishers did not define any serialisation format in the metadata of their datasets. In total, only nine datasets had a serialisation format following our guideline. The standard deviation is 0.71 formats whilst the mean value is 0.18 formats per dataset. In total we had one dataset with four different serialisation formats, five datasets (four of which had a pay-level domain of psi.enakting.org) had three different serialisation formats listed, two datasets had two formats listed, whilst one dataset had only one serialisation format listed. The most common formats were N-Triples, RDFa, RDF/XML, Turtle, N-Quads, and SPARQL query results in XML format.
To compute this metric, we have assumed that datasets use the predicate
A dataset serialised in different formats, widens possible uses in different scenarios. In order to encourage multiple format serialisation, tools such as Raptor29
Catering for multiple languages ensures that the dataset reaches a wider global audience. For example, a dataset with literals having only a Maltese language tag is not suitable for Chinese speaking users. On the other hand, if the dataset has literals in both Maltese and Chinese, then the dataset is likely to be re-used more. A plain (textual) literal string can be combined with a language tag (e.g. “making the language explicit allows users to determine how readily they can work with the data and may enable automated translation services.” – [38]
List of metrics assessed in the Contextual Category together with the assessed mean value (μ), median value (
), and standard deviation (
)
List of metrics assessed in the Contextual Category together with the assessed mean value (μ), median value (
Metric Computation: This metric checks the number of languages a dataset supports. Specifically, the metric checks whether the data (in this case string literals) is evenly available in different languages. For example if resource
Discussion: In most cases, publishers describe their textual literals using only one language (≈83% of the datasets). One possible reason is that publishers target a particular audience, or do not have the resources to create multilingual datasets. The mean value for this metric is 1.72 languages, whilst the standard deviation is 2.71 languages (median: 1 language). Overall, this metric shows positive skewness as the standard deviation is almost twice of the mean and median values. In total, we had four datasets having fifteen different languages (these had a pay-level domain of psi.enakting.org), languages including Arabic, Greek, English, Italian and Spanish. Furthermore, resources where described in thirteen, eight and four different languages, in three different datasets. Finally, eleven datasets had at least resources described in two different languages for human consumption.
Figure 5 shows a box plot illustration of the aggregated quality value compared with the category’s metrics (V1 and V2 are missing as the quality value are integers used to count things, whilst the rest are float values between 0.0 and 1.0). The overall aggregated box plot shows a population which is slightly skewed to the left, with a median of 60.70% conformance. This shows that there is more variety amongst higher quality values amongst the sample. Nevertheless, the standard deviation is 14.50%, which indicates a moderate distribution, whilst the mean score is 63.60%.
Contextual category
According to Zaveri et al. [60], the contextual category groups those dimensions and metrics that are highly dependent on the task at hand. The dimensions classified in this category deal with (i) relevancy of a dataset vis-à-vis the task at hand, (ii) degree of data correctness and credibility, i.e. the trustworthiness of the dataset, (iii) understandability of the data in terms of human comprehensibility and ambiguity, and (iv) timeliness of data. In this article, we introduce a new dimension, provenance, which for quality purposes we define as the provision of information regarding the origin of the dataset and of the resources within the dataset itself. The provenance metrics we propose are similar to those classified under the trustworthiness dimension. Furthermore, in this category, we only tackle three metrics related to understandability. In Table 4 we list the metrics that are assessed in this category, together with a summary of assessment results31
A visualisation of the LOD Cloud against the contextual category quality values is available at
Data provenance is considered as one of the main assets in a Linked Data. “Data provenance becomes particularly important when data is shared between collaborators who might not have direct contact with one another either due to proximity or because the published data outlives the lifespan of the data provider projects or organisations.” – [38, §9.4]
Metric Computation: At the very least, a dataset should have a

Contextual category box plot. Outliers are represented by dots.
Discussion: A box plot with the quality values for the contextual dimension metric is given in Fig. 6. The box plot for this metric (P1) is, qualitatively speaking, positively skewed, suggesting that most of the sampled datasets contain no basic provenance information in their VoID or DCAT metadata (when available). Nonetheless, this metric has a number of outliers, amounting to around 16.27% of the datasets. From this 16.27%, 71% of the datasets have a quality value of 100%. The
Publishers might add basic provenance triples directly in a dataset rather than in the metadata, which is a drawback in terms of “understand(ing) the meaning of data” [38], as the provenance will be unknown to an automated agent looking for this information within the metadata before consuming the actual data. For example, europeana.eu attaches a
In the Data on the Web Best Practices recommendation, the editors note that “consumers need to know the origin or history of the published data, [...], data published should include or link to provenance information” – [38, §9.4]
Metric Computation: This metric checks whether each resource has provenance information related to the origin of data. With regard to the quality metric survey in [60], this metric can be related to the “trustworthiness of statements”. More specifically, this metric checks for provenance entities with the following characteristics:
Identification of an agent of an entity (quads having a predicate Identification of activities in an entity (quads having a predicate Identification of a data source in an activity (quads having a predicate Identification of an agent in an activity (quads having a predicate
In order to avoid bias, an agent and an activity in an entity are both given a weight of 0.5. Similarly, data source and agent (in an activity) are also given a weight of 0.5. Then, the metric can be computed as follows:
Discussion: Similar to Metric P1, this metric (P2 – Fig. 6) is also very positively skewed. Unlike Metric P1, the granularity level of the metadata in this case can even reach a triple level. This means that the size of the overall dataset can grow very large, therefore publishers might not be willing to trade-off size for better metadata coverage. In fact, we noticed that there is only one publisher (
The practice of tracking the origin of data is often ignored by data publishers, possibly for a myriad for reasons, such as the inflating the size of the dataset, or modelling issues. We suggest that publishers add provenance information on the activities undertaken when creating resources in their dataset, and possibly separating this metadata from the data itself by using named graphs.
(U1) Human readable labelling and comments
Data on the Web is meant to be exposed to both humans and machines. Therefore, a human information consumer should be able to comprehend and understand a Linked Data resource. Apart from human understandability, labels and comments can be used in various applications, such as keyword-based and natural-language based search [20]. A Linked Data application is dependent on labels and comments provided with each resource, as the application itself is not yet intelligent enough to try to map a resource to its real-world description. Labels can possibly be extracted from a human readable URI, e.g. extracting the fragment ‘Dublin’ from
Heath and Bizer suggest that predicates such as
A simple search on LOV resulted into 346 terms for labels (12 of which tagged as W3C recommendations) and 150 terms for comments (1 being tagged as a W3C recommendation).
They used the corpus of the 2010 Billion Triples Challenge (
Metric Computation: The aim of this metric is to calculate a dataset’s completeness in terms of human-readable labels and descriptions. The metric measures the percentage of local entities that have a label or a description. More specifically, each resource should have one (or more) of the following predicates, extracted from the top 50 vocabularies used in the LOD Cloud [54]:
A Linked Data resource is a thing of interest, or in a more practical sense, a set of triples that have the same subject URI. The metric can be computed as follows:
Discussion: The box plot for this quality metric (U1 – Fig. 6) is relatively tall, showing a uniform distribution. This suggests that data publishers follow varying practices with regard to the conformance of human-readable labels and comments. Furthermore, one must keep in mind that similar to the metric related to the usage of multiple languages (Metric V2), one might not need to label or textually describe a resource. For example, in data cube36
The quality value is centred on 33.33% with a standard deviation of 40.93%, whilst the mean quality value is 43.76%. This quality metric displays the highest dispersion from all contextual metrics as evidenced by a wide bar. Moreover, around 29.29% of the assessed datasets have a completeness value of more than 90%, whilst in total around 43% of the datasets have a value of more than 50%. This metric is similar to the one presented in Hogan et al. [33, §5.3 – Issue XI], however, in this assessment we analysed a larger variation than in that of the study in 2012. We can also draw parallels between our assessment results and the results presented in [20], as both assessments show that the community needs to work harder to ensure the completeness of human readable labels and descriptions in Linked (Open) Datasets.
One of the main purposes of the Web of Data is to be queried and explored. Structural metadata enables consumers to understand the underlying structure of a dataset. Having a regular expression defining the URI structure of a dataset enables agents to interpret resources better, for example, extracting fragments of a resource URI such as its local name, or querying a dataset to retrieve local resources according to the specified URI structure. The regular expression definition of a URI metric is classified under the understandability dimension [60].
Metric Computation: This metric checks for the identification of a URI regular expression in the dataset’s metadata, and can be quantified as follows:
Discussion: This metric reports 100% if the assessed dataset has a URI regular expression pattern defined. Our assessment showed that only ten of the datasets had such an expression, giving a total mean value of 7.75%, and a standard deviation of 26.84%. The box plot for the metric U3 in Fig. 6, illustrates this positively skewed quality indicator.
(U5) Indication of used vocabularies
Vocabularies play an important role in the structure of a dataset, since one or more of these vocabularies describe the dataset’s resources. Similar to Metric U3, indicating the vocabularies used is part of the structural metadata of a dataset. Knowing the vocabularies used in a dataset, a human consumer can query the data. This metric is also classified under the understandability dimension [60].
Metric Computation: This metric checks whether vocabularies used in the datasets, either in the predicate position or in the object position if the predicate is
Discussion: Similar to most of the contextual metrics, the box plot for this metric (U5) is, also positively skewed, suggesting that most of the population datasets have no indication of the vocabularies used. Despite having a median value is 0%, this metric has a number of outliers, amounting to around 11% of the population dataset. These outliers pushed the standard deviation to 10.62%, whilst the mean is 2.71%. This metric might also have values that are > 100%, especially when a lot of vocabularies are declared, but not all of them are used in the dataset’s triples. Nonetheless, we have not encountered this during our assessment.
From our assessment, around 2,800 different (not unique) vocabularies were used throughout the assessed dataset, whilst only 128 (around 4%) vocabularies were identified by the
Aggregated results
Figure 6 shows a box plot illustration of the aggregated quality value compared with the category’s metrics. The overall aggregated box plot shows a population with a median of 8.66%. The standard deviation is 13.84%, whilst the mean score is 13.04%. Five datasets from the whole population are “positive outliers” (since their overall quality value in this category is superior to rest of the population). These quality scores shed light on the real problems related to the contextual category. More worrying is the fact that provenance information is not given the same importance as other quality metrics. Data consumers might look at such provenance information to make informed decisions on whether to trust a particular dataset or data publisher prior to using a dataset. Lacking such information might make it hard for data consumers to re-use and adopt some dataset.
List of metrics assessed in the Intrinsic Category together with the assessed mean value (μ), median value (
), and standard deviation (
)
List of metrics assessed in the Intrinsic Category together with the assessed mean value (μ), median value (
Defined as “independent of the user’s context” [60], the intrinsic category quality indicators are related to correctness and coherence of the data. Zaveri et al. [60] classified metrics according to the following dimensions:
syntactic validity – the conformance of an RDF graph with the RDF standard;
semantic accuracy – the correctness degree of the represented values with regard to the real world;
consistency – the level of coherence in a dataset with respect to the knowledge it represents and inference mechanisms;
conciseness – the degree of redundancy in a dataset; and
completeness – the extent to which data is complete with respect to the real world.
In this section we assess a metric related to the conciseness dimension, seven metrics related to the consistency dimension, and one metric from the syntactic validity dimension. No metrics were assessed for the other two dimensions mentioned in [60], as they would have required a different experiment setup. For example, for the completeness dimensions, we would require to assess the datasets according to their domain. Furthermore, since most metrics in this category rely on external vocabularies, datasets should not be penalised for external vocabularies that are offline. In Table 5 we list the metrics that are assessed in this category, together with a summary of assessment results37
A visualisation of the LOD Cloud against the intrinsic category quality values is available at
In [14], Bleiholder and Naumann define the conciseness metric as “measure(ing) the uniqueness of object representations”. Undoubtedly, from a database point of view, data redundancy causes a dataset to be large. This issue might not be that significant anymore because of large storage devices, or distributed storage. Moreover, data redundancy can be challenging in terms of data curation. For example, a data curator has to ensure that all “replicated” resources are updated accordingly. Nonetheless, data redundancy is not always a bad thing, for example, such redundancies can lead to improvements in query rewriting in Ontology-based Data Access, although it should be avoided if the publisher does not understand how to maximise its utility [59].
At the Linked Data level, a linked dataset is concise if there are no redundant instances [41]. By redundancy, Mendes et al. [41] mean that there are two local instances with different identifiers but with the same set of properties and corresponding data values. The extensional conciseness metric is classified under the conciseness dimension in [60].
Metric Computation: The extensional conciseness metric checks for redundant resources in the assessed dataset, and thus measures the number of unique instances found in the dataset. We follow the definition of Mendes et al. [41] in order to identify where two instances with a different URI are the same or not. In [19, §5.2], we showed that a naïve implementation of this metric leads to great time complexity, therefore we suggest the use of Bloom Filters [10] as an approximation technique. Using the Bloom filter for identifying possible duplicate instances during the assessment process, we quantify this metric as:
Discussion: Our assessment estimated that overall the assessed datasets had a mean of around 7.6% redundant resources. Nevertheless, this does not mean that there is low redundancy on the whole Web of Data, since the standard deviation stands at 13.22% (median 99.34%), which suggests a moderately varied quality value overall. Around 13% of the datasets had a quality value less than the lower whisker, i.e. 78.55%. The range of quality values, including outliers, is 62.31%.
For this estimate value, we used 13 filters with a size of 5,500,000 each, ensuring efficient runtime with a low loss in precision (cf. [19, §6]). Around 76% of the datasets scored a value of 90% or more, meaning that the level of redundancy in these datasets is on the low side. Publishers should keep redundancy at a low level, and ensure that identical resources are not recurrent throughout the dataset. This can be done by creating
(CS1) Entities as members of disjoint classes
The Web Ontology Language (OWL) extends the RDFS expressivity by modelling primitives that are otherwise difficult to express in RDFS. Generally, the OWL axioms deal with restrictions that can be placed on an otherwise open world assumption. On the other hand, incorrect usage of OWL features results in inconsistencies and thus jeopardizes reasoning.
The
Instead, one would have to distinguish between a person
Metric Computation: Metric CS1 checks for disjointness between types in multi-typed resources. Moreover, each assessed type has its super-types inferred39
In this article, more specifically the consistency metrics, when we talk about inferencing we refer to the materialisation of the type hierarchy. No other reasoning mechanism is used.
Discussion: The assessment shows that, in the presence of the simple inferencing explained above, almost all of the assessed datasets observe the
RDF Schema provides property-centric mechanisms for defining classes ( “instead of defining a class in terms of the properties its instances may have, RDF Schema describes properties in terms of the classes of resource to which they apply.” – [16, §2]
The RDF data model is represented by a triple form (
Metric Computation: The misplaced classes or properties metric assesses the datasets’ statements in order to check the correct usage of classes and properties. More specifically, this quality indicator checks if the assessed dataset has defined classes placed in the triple’s predicate and defined properties in the object position. We quantify this metric as follows:
In other terms, this metric checks for triples using a class c that is in the set of properties of the vocabulary of c (as defined in Metric IN3), which would mean that c is wrongly placed as a resource type, and similarly for properties p. A high value of this metric is interpreted as conformance to usage of classes and properties in a dataset.
Discussion: The usage of classes as properties and vice-versa are not common in the assessed datasets. Overall, 83% of the datasets score a value of 100% whilst the rest score 99.99%. The
We noticed that in the iteration of this metric we did not exclude triples with properties that are also expecting a property in the object position of the triple, such as

Intrinsic category box plot. Outliers are represented by dots.
OWL differentiates between properties referring to individuals (
Metric Computation: This quality indicator assesses a dataset’s statements for the correct usage of the predicate in terms the
Discussion: Fig. 7 shows the box plot for metric CS3. Similar to the previously discussed metrics for this dimension, the datasets adhere to a high quality score (mean 98.88%) and a considerably low standard deviation value of 5.17% (median 100%). Overall, around 87% of the datasets scored 100% whilst in total 95% of the datasets scored 90% or higher. Nonetheless, the box plot shows that around 12% of the assessed datasets are outliers. The dataset with the lowest quality value scored 52.60%. Comparing this against the study on Microdata formats on the Web in [42], it is confirmed that on average datasets on the LOD cloud misuse OWL datatype and object properties less.
From our assessment the following datatype properties (top five) were used with resources:
http://rdf.myexperiment.org/ontologies/components/link-datatype (502 times), http://eunis.eea.europa.eu/rdf/species-schema.rdf#sameSpeciesRedlist (4 times), http://www.europeana.eu/schemas/edm/collectionName (50,000 times),
whilst the following are object properties (top five) with literals:
(CS4) Usage of deprecated classes or properties
Removing classes and properties from schemas renders data using them incoherent. OWL introduces the two classes
Metric Computation: This metric checks whether deprecated terms are used in a dataset. More specifically, all used classes and properties are checked if they are members of
Discussion: With around 97% of the datasets scoring a quality value of 100%, data publishers tend to avoid using deprecated classes and properties. The LOD Cloud sample that was assessed used the minimal deprecated terms in most cases, with the lowest quality score of 97.41% marked as an outlier in the box plot (CS4) in Fig. 7. The standard deviation, as in the other consistency metrics, is very low (0.23%), and the mean value is 99.97%.
(CS5) Valid usage of the inverse functional property
In the real world, a public key used for encryption is unique to every individual. If we want to represent this public key in a Linked Data document, then there should be one exactly one resource (possibly an individual of the type
This term is often used to name the process of aggregating resources based on inverse functional properties (
Metric Computation: This quality indicator checks for incoherent values within the assessed dataset’s values. More specifically, this metric checks if a value attached to a property member of
Discussion: The box plot for this metric (CS5) in Fig. 7 shows the trend in this metric where a large part of the assessed datasets have no varying quality, bar a few number of datasets that are considered as outliers. These outliers, around 18% of the assessed datasets, increased the standard deviation to 12.29%, whilst the calculated median is 100%.
One should keep in mind that not all assessed datasets made use of inverse functional properties and were thus given a 100% score (since there was no triple breaking the IFP constraint); nevertheless, these where included in the assessment. From the assessment, around 3% of the datasets got a quality score of less than 50%.
Triples with the following IFP properties (top 5) where identified with violations during our assessment:
http://rdf.myexperiment.org/ontologies/base/has-friendship (violated in 635 triples) http://eunis.eea.europa.eu/rdf/species-schema.rdf#sameSynonymGBIF (violated in 380 triples) http://eunis.eea.europa.eu/rdf/species-schema.rdf#sameSynonymITIS (violated in 328 triples) http://eunis.eea.europa.eu/rdf/species-schema.rdf#sameSynonymFaEu (violated in 215 triples)
Since each dataset is assessed individually, our assessment did not point out possible IFP violations across the assessed datasets. In order to ensure that the IFP constraint is not violated, data publishers should ensure that data values (such a email address, homepage) are validated for uniqueness before publishing, possibly across the Web of Data and not just locally in the dataset.
Hogan et al. defined ontology hijacking as the “re-definition or extension of a definition of a legacy concept […] in a non-authoritative source” [32]. s being an authoritative source for concept c means that the namespace of c coincides with that of s. For example,
Metric Computation: This metric assesses a dataset for its redefinition of third party external classes and properties. More specifically, this metric identifies if a dataset is the authoritative document for all classes and properties it defines, following the axioms identified in [32].
Along these lines, we quantify the metric as follows:
Discussion: Similar to the Metric CS5, the variation in quality within most of the assessed datasets (≈86% of the datasets) is very low, though a number of outliers (shown in Fig. 7 Metric CS6) causes a standard deviation of around 19.99% (median is 100%). Furthermore, the mean value is 93.64%. Overall, publishers tend to avoid redefining terms that they are not authoritative to do so, with around 85% scoring a quality value of 100%. In general, publishers should try to avoid redefining terms, but instead they should extend existing terms (if needed), thus avoiding the confusion that can be caused by term cross-definition.
(CS9) Usage of incorrect domain or range types
In a schema, a property can optionally have domain and range defined. The domain is the expected type (class) of the subject of a triple using the given property. The range is the expected type (class of a resource, or datatype of a literal) of the object of such a triple. Using the incorrect domain or range types makes the data incoherent, as consumers who know the underlying schemas could query the data without looking at it, making it harder to retrieve the right or all results. Zaveri et al. [60] classify this metric under consistency.
Metric Computation: This metric assesses a dataset for the compliance of the types of the subjects and objects of its statements with the domains and ranges of its predicates according to the schema of the respective predicate. In particular, the predicate of each triple is dereferenced to identify the expected domain and range types, for the subject and object respectively. Furthermore, the subject’s type should not be disjoint with any type identified as the domain of the predicate in the triple. Similarly, this applies to the object’s type with regard to the predicate’s range. At the typical scale of Linked Open Datasets it is, however, prohibitively expensive to infer all types of a resource and all disjointnesses between classes. For these reasons, we define this metric to efficiently compute the practically most relevant sub-case: checking whether the type of the subject/object of a triple or any of its superclasses matches the domain/range. For each triple being assessed, hierarchical inferencing is done on the subject and object in order to determine the parents of their.41
The hierarchical inference ignores the universal super-concepts, i.e.
This is required as we might have predicates with an abstract domain or range; for example, the
External resources are ignored as we assume a closed world during the assessment. Thus, only resources with locally defined types are included.
Discussion: This metric is implemented as a probabilistic metric using reservoir sampling as explained in [19]. Our assessment shows that data publishers tend to use incorrect domain and range types in the triples. Around 4% of the assessed datasets had a quality score of 90% or more, with the highest score being 99.51%. On the other hand, around 13% of the datasets scored less than 50%. The mean score for this metric is 60.11% whilst the standard deviation is around 13.43%. The box plot for Metric CS9 in Fig. 7 is symmetrical with the median standing at 57.14%. It also depicts a set of outliers over the top whisker and one dataset marked as outlier under the bottom whisker. It is also lower than the rest of the consistency metrics (Metrics CS1 to CS6), suggesting that Linked Data publishers might be more complacent with using the right datatypes when creating resource triples. Linked Data publishers should be aware of the domain and ranges of the properties used in their datasets by consulting with the relevant vocabularies. Furthermore, simple on-the-fly type checking scripts can be created and used throughout the publishing activities, inspecting for such schema-to-data inconsistencies.
Linked datasets often mix terms from different vocabularies to describe its resources, which might lead to predicates being used incorrectly. For example, assigning a
By “generic” we mean that these predicates are commonly used by publishers as needed, ignoring the semantic definition of the predicate itself.
Ranges with a data value (i.e. literal) are usually constrained to be of a certain datatype, for example, a property
Metric Computation: This quality indicator assesses the lexical form of the data values against the data type attached with the literal itself. Consider
Apache Jena (
Discussion: The box plot for metric SV3 in Fig. 7 shows that most of the datasets assessed adhere to a 100% quality value, though there were also a number of datasets that scored less and thus are marked as outliers. On average, the quality score of the assessed dataset is around 96.80% whilst the standard deviation is a high 14.16% (median 100%). Datasets that had no literal values were omitted from this assessment.
Similar to Meusel’s and Paulheim’s findings [42], our assessment identified literals with a lexical form of literals with a lexical form of literals with a CCYY-M-D lexical form; literals with a CCYY-MM-D lexical form; literals with a lexical form of literals with an incorrect date, e.g. 9999-99-99 or 0000-00-00.
The other violated datatypes are:
In order to reduce incompatible datatypes vis-à-vis the lexical form of a data value, publishers could publish and serialise their data using the latest Turtle 1.145
Figure 7 shows a box plot illustration of the aggregated quality value compared with the category’s metrics. The overall aggregated box plot shows a population with little dispersion (most of which results from Metric CS9) having a standard deviation of 12.89%, a median of 80.94% and mean of 77.36%. The majority of the metrics shows that a relatively high quality is adhered to by Linked Data publishers.
List of metrics assessed in the Accessibility Category together with the assessed mean value (μ), median value (
), and standard deviation (
)
List of metrics assessed in the Accessibility Category together with the assessed mean value (μ), median value (
The dimensions in the accessibility category address the ease with which machines as well as humans can (re)use Linked Data resources. Zaveri et al. classify metrics under the following dimensions [60]: (i) availability – dealing with the access methods of the data; (ii) licensing – what are the permissions (if defined) to re-use a dataset; (iii) interlinking – the degree of internal and external interlinks between data sources; (iv) security – deals with the security and authenticity of datasets; (v) performance – how does the server hosting a dataset affect the efficiency of consuming data. In this section we assess metrics related to the availability dimension (2 metrics), licensing dimension (2 metrics), interlinking dimension (1 metric), and performance (2 metrics). Metrics in this category were measured at a single point in time, meaning that datasets might report different quality results over time. This is because data servers might have planned or unplanned down time. For this analysis, we only report the quality value of a dataset at one point in time, similar to what was done for other metrics. Therefore, results reported in this empirical study for all accessibility metrics are highly time-dependent. However, in the future we plan to have a service similar to SPARQLES46
SPARQL Endpoint Status;
A visualisation of the LOD Cloud against the accessibility category quality values is available at
Dereferenceability is one of the main principles of Linked Data. HTTP URIs should be dereferenceable, i.e., HTTP clients should be able to retrieve the resources identified by the URI. According to the LOD principles, a typical web URI resource would return a 200 OK code indicating that a request is successful and a 4xx or 5xx code if the request is unsuccessful. In Linked Data, a successful request should return an RDF document containing triples that describe the requested resource. Resources should either be hash URIs or respond with a
Metric Computation: The aim of this metric is to check the number of valid dereferenceable URIs used (according to these LOD principles) in a data source. More specifically, an
This
Discussion: In [19, §5.1] we describe a probabilistic technique for this metric using reservoir sampling. In this technique, each resource URI is split into two parts: (1) the pay-level domain (PLD), and (2) the path to the resource. This is analogous to a dictionary data structure. For this metric we employ a “global” reservoir sampler for the PLDs. Furthermore, for each PLD we employ another sampler holding an evenly distributed sample list of resources to be dereferenced. However, such sampling might lead to an unbalanced representative sample. We therefore adopt a hybrid of the reservoir technique used in [19, §5.1] and the stratified sampling idea as described in [27]. Stratified sampling is a technique that can be used when the data can be partitioned into a number of disjoint subgroups [27]. The idea is that the sample is chosen per proportion of these subgroups, therefore improving the representative sample. Therefore, for each domain in the higher-level sampler, we keep track of the total number of items encountered during assessment, to simulate the size of the strata groups. A final sampler is then drawn from all lower-level sampled resources using the proportionate allocation method. The parameters used were 5,000 as the global reservoir size (i.e. the number of possible different pay-level domains (PLD) in a dataset), and a PLD size of 10,000. Nevertheless, one must keep in mind that these parameters introduce a bias in our results in a way that the sample might be under-represented.

Accessibility category box plot. Outliers are represented by dots. Machine-Readable License, Human-Readable License, and Links to External Data Providers metrics are excluded from the plot, but their values are included in the aggregated result box plot.
The box plot for metric A3 in Fig. 8 shows a large variance with values ranging 100% to 0%. The mean quality value of this metric is 36.86%, which is 33.44% lower than the mean recorded in [33, §5.1 – Issue III]. There are two reasons for this difference. First, in our study we do not just study local dereferenceable URIs, but also take into consideration the dereferenceability of external resources the publishers use. This might mean that publishers are punished if the external URIs used are not dereferenceable. Secondly, we noticed that certain hosts blacklisted our IP address during this assessment following numerous HTTP requests. The box plot for metric A3 in Fig. 8 is positively skewed, meaning that the assessment shows a high concentration of low quality values. Similar to [33, §5.1 – Issue III], our assessment shows a high variability between data producers on the dereferencability of resources. We report a standard deviation of 36.54%, with a median of 31.11%. In total our assessment attempted to dereference a total of 709,356 resources, out of which only 233,127 where valid dereferenceable resources. The rest of the resources resulted in the following problems:
Hash URIs without parsable content – five resources;
Status Code 200 – 61,922 resources;
Status Code 301 – 7,281 resources;
Status Code 302 – 13,878 resources;
Status Code 303 without parsable content – 1,293 resources;
Status Code 307 – 1 resource;
Status Code 4XX – 104,379 resources;
Status Code 5XX – 5,444 resources;
Failed Connection (either due to blacklisting or resource not online anymore) – 289,289 resources.
Surprisingly, not a lot of publishers abide by the dereferenceability guideline. Our assessment shows that only 33% of the assessed datasets have a dereferenceability value of 50% or more. Whilst this guideline is one of the Linked Data principles, one should understand the extra costs this mechanism requires, including the maintenance of content-negotiation and re-direction schemes. However, one must investigate if the need of the dereferenceability mechanism is a must in Linked Data, or if agents can be adapted to understand Linked Data URIs automatically, for example by introducing catalog mechanisms similar to those used in XML to resolve URI references. In the meantime, a possible solution is that data publishers make use of Linked Data-based content management systems (such as OntoWiki48
“It is a common assumption that content and data made publicly available on the Web can be re-used at will. However, the absence of a licensing statement does not grant consumers the automatic right to use that content/data.” – [29, §4.3.3]
Open licences, as defined by the Open Definition [45], are the heart of open data. They specify whether third parties can re-use or otherwise, and to what extent. In Linked Open Data, one would expect that such licences are either machine-readable using predicates such as
(L1) Machine-readable license
Having machine-readable license definitions (such as those in the
Metric Computation: The aim of this metric is to check if a dataset has a valid machine-readable license. By valid we mean that a license can be retrieved from a semantic resource (e.g. http://purl.org/NET/rdflicense/.*) or with an
These should be attached to one of the following “license” predicates:
We define this metric as follows:
Discussion: In Section 3.2 we discuss the licences and rights in the LOD Cloud datasets’ metadata. We show that around 41% of the whole LOD Cloud datasets have license or rights metadata, using the predicates
(L2) Human-readable license
In contrast to Metric L1, a human-readable license enables human agents to read and understand a license in textual format, rather than in terms of triple statements.
Metric Computation: The aim of this metric is to verify whether a human-readable license text, stating the licensing model attributed to the dataset, has been provided as part of the dataset itself. The difference from Metric L1 is that this metric looks for objects containing literal values and analyses the text searching licensing related terms. More specifically, we check for the following:
A license A license triple, identified by a triple with a license predicate described in Metric L1, and a URI pointing to a human-readable documents (also defined in Metric L1).
We define this metric as follows:
Discussion: Similar to Metric L1, the assessment shows a low overall level of conformance to this metric. We detected human-readable licenses in eleven (≈8.46%) datasets, four of which also had a machine-readable license. Whilst it is understandable that publishers are less inclined to having statements with large textual literals containing licensing data, we suggest that publishers should at least define the license name in the datasets’ metadata. Licenses are of utmost importance to open data [45, §1], therefore, publishers should define the license or rights either as machine-readable (preferable) or at least human-readable.
(I1) Links to external linked data providers
One of the main Linked Data principles is to “include links to other URIs, so that [agents] can discover more things.” [11]. Furthermore, Berners-Lee states that linking your data to external sources would earn the dataset the fifth star, given that the rest of the four guidelines are satisfied. Having external links in a dataset would enable data consumers to explore and understand better the data in question. Additionally, Heath and Bizer [29] emphasize the importance of external RDF links in the Web of Data since: “they are the glue that connects data islands into a global, interconnected data space and as they enable applications to discover additional data sources in a follow-your-nose fashion.” – [29, §2.5]
Metric Computation: The aim of this metric is to identify the total number of external RDF links used within the assessed dataset. An external link is identified if the object’s resource URI in a triple has a PLD different from the assessed dataset’s PLD. Furthermore, the external link should be a semantic resource that can be dereferenced and parsed by an RDF parser. For this metric we use a reservoir sampling approach [19] to estimate the number of external Linked Data providers in a dataset.49
The sampling method is the same as in the cited literature, however, we implemented the metric in a different manner in order to calculate the number of external providers instead of a ratio, as described in this article (Metric I1).
Discussion: Similar to Metric A3, this metric was assessed using a sampling technique. In this case, each external PLD has a sampler of maximum 25 items. Estimation techniques create a bias since the parameters might create an under-represented sample. In this case, we might miss out possible Linked Data documents with an external PLD. Furthermore, datasets using non-dereferenceable external PLDs will be punished by this metric. Dereferenceability is essential in this metric in order to abide by the follow-your-nose principle described by Heath and Bizer in [29, §2.5]. Table 7 shows the top five assessed datasets, the number of unique dereferenceable external PLDs linked in the dataset, and the total number of unique PLDs. In the sample acquired from the LOD Cloud, only 9 datasets had no external PLDs, whilst around 88% of the datasets had less than 50 unique external PLDs linked. In total, the number of external PLDs extracted from the assessed 3.7 billion triples amounted to 977,609. Three datasets, namely
dbpedia.org
,
Top five ranked datasets for the links to external RDF data providers metric
Considering the Linked Data principles, one would have expected a higher ratio of external RDF links. However, there is no set number of external Linked Data PLDs each dataset should have. The assessed datasets feature a large standard deviation of 183.3 Linked Data PLDs, and a mean of 27.01 Linked Data PLDs. Nevertheless, one should consider that these two statistical measures are highly influenced by the top two datasets.
Ideally, a Linked Data host can accommodate a large number of requests without affecting the consumers’ productivity. That is, a consumer is not left waiting “in a queue” until other agents have been served. Therefore, in an ideal situation, a host has the capacity to handle a large number of parallel requests.
Metric Computation: Adapting a definition by Flemming [23], the high throughput metric measures the efficiency with which a system can bind to the data source by measuring the number of HTTP requests answered by the source of the dataset per second. From the dataset we use reservoir sampling to “randomly” choose a maximum of ten local resources (i.e. whose namespace is the same as the data source namespace) that will be used for this metric. The metric estimates the number of requests served per second, computed as the ratio to the total number of requests sent to the dataset’s host. We define this metric adopting [23] as follows:
Discussion: The box plot for this metric (PE2) in Fig. 8 shows a large varying quality with values ranging from 100% to 0%. The standard deviation stands around 45.60% (median value is 29.67%) whilst the mean value is 47.78%. The box plot is positively skewed, suggesting that observations at the low end are concentrated. Around 38% of the assessed datasets gave a result of 100%, which means that more than five requests were answered in 1 second or less. Around 8.52% of the datasets scored a quality value between 50% (inclusive) and 100% (not inclusive). All quality results are dependent on the data host during the time of the assessment, therefore, such a quality assessment should be performed more frequently.
(PE3) Low latency
Latency is the amount of time an agent has to wait until the host responds with the particular request. The time taken largely depends also on how big the HTTP request is, and the number of HTTP round-trips the server has to make before serving the request. Therefore, the choice of Hash URIs and 303 redirects (i.e. Slash URIs) is also an important factor for latency [23,29]. Hash URIs would reduce the number of HTTP round-trips, as the document with the requested fragment resource description would contain descriptions of other resources in the same document. Therefore, the client would end up receiving unnecessary resources that would eventually increase the latency (since the document size will be larger). On the other hand, Slash URIs require the client to go through the whole dereferencing process for every resource, but then the client will receive exactly the required resource. Ideally, the data source should serve resource requests with the lowest possible latency, which in turn means that data publishers should choose the right strategy for publishing data (hash URIs vs. slash URIs).
Metric Computation: The low latency metric measures the efficiency with which a system can bind to the data source by measuring the delay between submitting a request for that very data source and receiving the respective response. Similar to Metric PE2, a reservoir sampler is used to sample a maximum of ten local resources from the dataset under assessment. This metric is defined as the mean time taken for ten requests to respond, normalised to a percentage value between 0 and 100 by dividing by an ideal response time defined as one second [23]. Along these lines, Metric PE3 is defined as follows:
Discussion: Similar to Metric PE2, results of these metrics rely on the data host at time of assessment. The box plot for this metric (PE3) in Fig. 8 confirms the large range varying quality, as in Metric PE2. The standard deviation is 47.12% with a mean value of 57.55%. However, unlike PE2, the metric’s values are negatively skewed, with a median value of 99.23%. This shows that there is a large concentration of very high quality values. Around 49.61% of the datasets have a quality value of 100%, meaning that at least one request is answered in one second or less.
Aggregated results
Figure 8 shows a box plot illustration of the aggregated quality value compared with the category’s metrics. The overall aggregated box plot shows a population that is moderately varied having a standard deviation of 19.00% and a median of 29.96%. The mean aggregated quality score is 33.12%, with only 19% of the assessed datasets scoring 50% or more. The aggregated value is affected by the low values of the licenses metrics (L1 and L2), which is a concerning matter considering that the assessed datasets are part of the Linked
Ranking and aggregation remarks
All categories had an aggregated value
A visualisation of the LOD Cloud against the overall quality values is available at
A total of 130 datasets were assessed in Luzzu, aggregating around 3.7 billion quads. The mean aggregated conformance score is 59.33% with a slight standard deviation of 7.63% (median value is 58.78%). Figure 9 depicts a symmetric box plot showing the spread of aggregated quality conformance scores. The box plot shows five outliers, four of which are “positive outliers”, since their quality value is superior to the rest of the population.

Aggregated Conformance Score box plot. Outliers are represented by dots.
Most of the “failing” datasets are SPARQL endpoints, whilst others contained syntactic errors. In Luzzu, quality metrics are not written and executed on SPARQL endpoints, but instead triples are streamed from the endpoint51
This is the only query the Luzzu framework does on the endpoint, until all results are retrieved.
In this section we present a statistical analysis of the quality assessment, primarily to be able to describe the quality of a dataset using the least number of metrics.
The principal component analysis
The Principal Component Analysis (PCA) [47] is a statistical variable reduction technique that transforms a set of possibly correlated variables into a new set of uncorrelated components. Given some data, PCA helps in reducing the number of dimensions used to summarise the differences (variability) within a dataset. This is done by looking at the characteristics that provide the most variation across the data itself, ensuring that the data can be differentiated. We will use PCA in order to identify which of the assessed metrics are informative for Linked Data quality (cf. Section 6.2). This technique was favoured over ANOVA, which in simple terms is a technique usually used to determine whether there is significant difference between means. However, ANOVA was used in [7,43] to identify the quality metrics that are sensitive in images, for example what are the best metric(s) that should be used for images with watermarks. Nevertheless, these statistical tests give an indication, that ideally is sustained with a subjective test.
Identifying informative quality metrics for a generic linked data quality assessment
The aim of this analysis is to study how informative are the quality metrics assessed on the Linked Open Data Cloud. Therefore, our main research question for this analysis is:
No correlation exists among different metrics, thus each separate metric gives an informative value on the overall quality of a linked dataset.
Correlation exists among different metrics; therefore there are metrics that are non-informative to the overall quality value of a linked dataset.

Quality Metric Correlation Heat Map.
KMO and Bartlett’s Tests
In Table 8 we display the results for the KMO and Bartlett’s test. The KMO results shows that our data has an adequacy of 0.96, which makes the factor analysis appropriate for our data. Kaiser recommends that values greater than 0.5 are acceptable [36]. The 0.96 value means that correlation patterns between the input values (quality assessment output values) are compact and factor analysis will produce distinct and good factors. The Bartlett’s Test of Sphericity confirms this and shows extremely strong evidence that correlation exists amongst different metrics.
The chi-square value applied for any statistical test is usually a measure of difference between an observed and expected value. In this case the chi-square is evaluated on the difference between the correlation matrix of the variables involved to the identity matrix. If there is evidence of the correlation matrix diverging significantly from the identity matrix, then then variables at hand are not orthogonal and PCA can be applied. Indeed, in this case the high chi-square value (991.81) implies extremely strong evidence of an non-orthogonal correlation matrix hence making dimension reduction possible.
Following the rejection of the null hypothesis, we use the Principal Component Analysis (PCA) in order to test the alternative hypothesis (
Total variance explained
Therefore, the total number of components extracted is eleven. In order not to give too much importance to one component over another, a rotated component matrix (Table 10) is taken into consideration, in order to determine the informative quality metrics. The rotated component matrix is the main output following a Principal Component analysis. In total, these 11 factors can explain around 72.59% of the total variance.
In Table 10 we can see the 11 extracted components and the metrics each component represents. For the factor loading we use a cut-off point if the magnitude of the factor is at least 0.5 as suggested by Hair et al. [25] as the number of datasets is 130. This table also suggests which of the quality metrics, possibly combined (as in the case for components 1–9), are informative metrics.
By rejecting
Rotated component matrix
Our initial quality assessment was generic, therefore all 130 datasets had the same 27 metrics assessed against them, irrelevantly of whether the metric is important to a particular dataset for a particular domain or not. This analysis helped us in identifying 11 orthogonal components that describe 72.59% of the variability. Hence, the results obtained after performing the PCA are just an indication of which metrics might not be informative in a generic Linked Data quality assessment. PCA is a statistical measure which groups metrics that explains most of the variance, therefore, PCA does not consider the semantics of the metrics when identifying the new components, nor the importance of a metric to a given domain, as for example the Links to External Data Providers metric (Metric I1). Therefore, it does not mean that these three metrics (Metric CS9, Metric I1, Metric A3) are irrelevant to Linked Data quality, but PCA suggests that these metrics provide no new information that describes the quality of datasets that is not provided by the other quality metrics.
In the future, this analysis can act as a starting point for assessing the quality of the Web of Data. New metrics, representing the KQIs, can be developed to represent each component identified by our PCA findings. Furthermore, future quality assessment would not require the evaluation of three computationally time-consuming metrics (Metric CS9, Metric I1, Metric A3), as the described 11 components would be enough to describe the quality of a dataset.
Quality issues in datasets have severe implications on consumers who rely on information from the Web of Data. Currently, it is difficult for a consumer to find datasets that fit their needs based on quality aspects. The semantic quality metadata produced by this empirical study fills this gap. Prospective users can now search, filter and rank datasets according to a number of quality criteria, and more easily discover the relevant, fit for use dataset according to their requirements. Nonetheless, such an assessment should not be done once, but it should be a continuous (or periodical) process to reflect the dynamic Web of Data.
Large-scale empirical studies on data quality can raise awareness on the current problems in data publishing. Such empirical analyses are important to the community as (1) they help to understand what are the current (or recurring) problems, and (2) define future research and development directions – in this case of Linked Data. In this article we quantified and analysed a number of linked datasets vis-à-vis a number of quality metrics as classified in [60]. Furthermore, in Section 6.2 we statistically analysed the quality scores and performed the Principal Component Analysis (PCA) test in order to identify the non-informative Linked Data quality metrics in a generic assessment. This statistical method shows that following our assessment three out of 27 metrics were identified as non-informative to a datasets’ quality. This empirical survey is one of the largest (in terms of triples) evaluation of LOD data quality to date. All quality metadata produced in this empirical study is published using Linked Data principles at
In Section 3, we explained the Open Data principles and, using the LOD Cloud datasets metadata, performed a primary investigation to identify how well these abide by these principles. More specifically, we looked at the datasets’ metadata in order to identify their accessibility points and licenses. We show that only around 42% had a valid Linked Data access point, whilst only 40% had a license.
In [30], Hitzler and Janowicz state that the general perception of Linked Data is that datasets are of poor quality. In line with research question described in Section 1 we looked at a number of datasets in order to understand better whether the perception label is deserved. In Section 5 we looked at the datasets themselves in order to assess their quality against a number of metrics. We have seen that data publishers are compliant to various degrees with the different Linked Data best practices and guidelines with regard to the quality metrics. Overall, if we consider the bigger picture, that is the aggregated conformance score, we see that on average the Linked Data quality is slightly below 60% (highest value of all metrics aggregated with a weight of 1 is 84.72%, lowest value is 41.41%) with a low standard deviation value of 7.63%. Whilst the general perception might be derived from various different factors, the aggregated results from the generic assessment shows that it might not be the case that Linked Data are necessarily of poor quality. However, there is no known literature that scales quality scores, therefore we cannot say that the assessed linked datasets are of high or medium quality. When we talk about the aggregate conformance scores, a high performing metric compensates for a lower one. Therefore, when we look at individual metrics, we see that there are certain aspects, more specifically quality metrics related to provenance and licenses, in which data publishers, collectively, should improve, as these are factors that can encourage Linked Data re-use. Nevertheless, this empirical study shows that there are still a number of problems related the Linked Data publishing and its conformance with a number of best practices and guidelines.
Our next step is to create a Linked Data Quality as a Service, that crawls the Web of Data and assesses its quality, providing quality metadata as Linked Data resources for consumption. For this we also plan to incorporate other objective and subjective metrics, however, we need to find methods that can enable the replicability of such metrics. Furthermore, we plan to assess the quality of the the LOD cloud periodically using the HDT[22] dataset LOD-a-lot,52
Footnotes
Acknowledgements
This research was partially supported by the Irish Research Council Government of Ireland Postgraduate Fellowship [project ID GOIPD/2017/1204] and Science Foundation Ireland and co-funded by the European Regional Development Fund through the ADAPT Centre for Digital Content Technology [grant number 13/RC/2106].