
Abstract
In 2020 the U.S. Federal Committee on Statistical Methodology (FCSM) released “A Framework for Data Quality”, organized by 11 dimensions of data quality grouped among three domains of quality (utility, objectivity, integrity). This paper addresses the use of the FCSM Framework for data quality assessments of blended data. The FCSM Framework applies to all types of data, however best practices for implementation have not been documented. We applied the FCSM Framework for three health-research related case studies. For each case study, assessments of data quality dimensions were performed to identify threats to quality, possible mitigations of those threats, and trade-offs among them. From these assessments the authors concluded: 1) data quality assessments are more complex in practice than anticipated and expert guidance and documentation are important; 2) each dimension may not be equally important for different data uses; 3) data quality assessments can be subjective and having a quantitative tool could help explain the results, however, quantitative assessments may be closely tied to the intended use of the dataset; 4) there are common trade-offs and mitigations for some threats to quality among dimensions. This paper is one of the first to apply the FCSM Framework to specific use-cases and illustrates a process for similar data uses.
Introduction
The U.S. Federal Committee on Statistical Methodology (FCSM) released its report “A Framework for Data Quality” in 2020 (referred to hereafter as the FCSM Framework) [1]. The FCSM Framework was developed as a way to address the complexity of describing data quality, to be informed by other frameworks for use in official statistics, to be applicable for different data sources, and to provide a common language across U.S. federal statistical agencies [1]. The FCSM Framework is multi-dimensional, where eleven dimensions of data quality are grouped within three domains (utility, objectivity, integrity) Fig. 1. The FCSM Framework emphasizes fitness for purpose, where the quality of data depends on the purpose to which it is applied. Within the FCSM Framework, the dimension of accuracy, the closeness of an estimate to its true value, includes many commonly used quality metrics, including measurement errors, missing data, processing errors, and other factors that affect accuracy. Other dimensions of data quality included in the FCSM Framework include relevance, timeliness, confidentiality, and scientific integrity. Data may be highly accurate but if they are not relevant, sufficiently timely, or are collected with insufficient disclosure protections they may not have sufficient quality for their intended purpose.
The FCSM Framework [1] indicates that factors that reduce data quality (“threats” to quality) along each dimension should be identified, with possible mitigations and trade-offs among them. However, the FCSM Framework is not designed to be a toolkit or template since it does not identify best practices for assessing or measuring each dimension or identifying threats to quality. However, it does standardize a way of describing the dimensions and highlight the importance of these assessments for data quality.
Blended data add another complexity to the FCSM Framework. Blended data are data created by combining two or more sources through methods like record linkage, spatial and temporal linkage, data fusion and other modeling approaches like statistical matching. The quality of blended data is dependent on the quality of each input source, the method used to combine the data, and whether the blended data are appropriate for their intended uses. Evaluating quality depends on the input source’s intended purpose. For example, administrative records and other programmatic data are collected for the purpose of administering a particular program and the quality of those records in a blended dataset may differ from the quality for their original purpose. Evaluating quality also depends on data elements used for blending. When evaluating an input source for a blended data project, its quality will depend on both the quality of the data elements needed for the intended purpose(s) and the quality of the data elements needed for blending, such as personal identifiers needed for record linkage or temporal and geographic resolutions (e.g., points, grids, areal units) for blending geographic factors.
The aims of this study were to consider the use of the FCSM Framework for the purpose of examining the quality of data used for blending, and the resulting blended data, for the purposes of health research, and to draw conclusions to inform the use of the FCSM Framework in practice. An interdepartmental workgroup of the U.S. Department of Health and Human Services was formed. For this assessment, the workgroup, including the authors, held focused discussions for each of three health-focused case studies, both separately and then in aggregate. The three case studies were chosen for specific features of the data and examined separately and collectively to identify threats to the dimensions of quality and similarities in the threats among them. The focus of this paper is on how the FCSM Framework could be utilized to assess data quality. The paper is not meant to serve as a comprehensive evaluation of the dimensions of data quality for each case study nor as a definitive guide for applying the FCSM Framework. The conclusions reached from these case studies, however, are intended to be informative for others considering their own assessments of quality for their data and uses.
The FCSM framework for data quality
The FCSM Framework considers data quality through three broad components, or domains: utility, objectivity, and integrity. Utility refers to the extent to which information is well-targeted to identified and anticipated needs; it reflects the usefulness of the information to the intended users. Objectivity refers to whether information is accurate, reliable, and unbiased, and is presented in an accurate, clear and interpretable, and unbiased manner. Integrity refers to the maintenance of rigorous scientific standards and the protection of information from manipulation or influence as well as unauthorized access or revision. The FCSM Framework builds on these three domains, nesting eleven data quality dimensions within the domains, as shown in the Fig. 1. The dimensions represent areas in which specific aspects of data quality can be considered and are defined in Table 1. Threats to data quality can be identified for all dimensions within the FCSM Framework. This identification is an essential first step toward understanding possible mitigations of threats, managing trade-offs among them, and for documenting and reporting data quality.
Dimensions of data quality
Dimensions of data quality
Source: FCSM 2020 [1].
FCSM framework for data quality. Source: FCSM 2020, FCSM-20-04 A framework for data quality.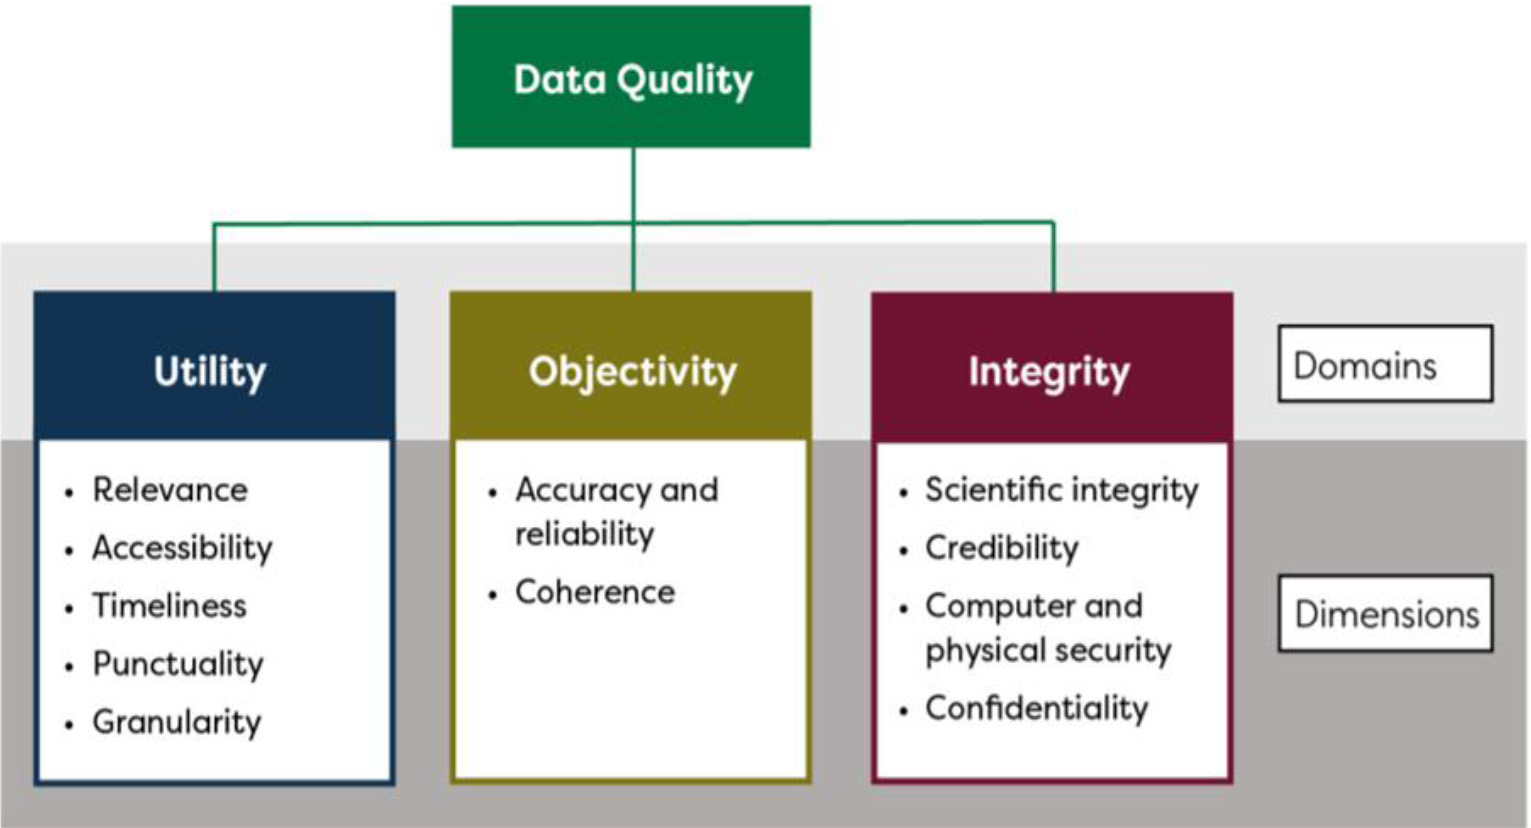
Selection of case studies
To provide examples of the use of the FCSM Framework, three case studies were identified and the data were assessed using the FCSM Framework. The case studies were selected for their potential utility to inform public health research questions, surveillance, and health policy. In addition, all case studies had sufficient information to conduct the assessment and provided a variety of types of data. The first is an already blended data source and the two others are data files that could be blended with other sources to answer key health-related research questions.
Linked National Health and Nutrition Examination Survey (NHANES) and Housing and Urban Development (HUD) data (NHANES-HUD) [2], available from the National Center for Health Statistics (NCHS) through the NCHS Research Data Center (RDC). The RDC protects the confidentiality of survey participants while providing access to restricted-use data for statistical purposes.
Ambient air quality data. Various sources of air quality data are available, including from the U.S. Environmental Protection Agency [3, 4, 5], the National Aeronautics and Space Administration [6], and the National Oceanic and Atmospheric Administration [7]. In addition, many agencies, including CDC’s National Center for Environmental Health (NCEH), have processed native air quality datasets into meaningful air quality measures for public health purposes [8].
Physical Activity Monitoring (PAM) data, as collected in the examination component of NHANES at NCHS [9, 10].
The linked NHANES-HUD data were chosen as an established linked or blended data product that provides users with comprehensive documentation on descriptions of data sources, linkage eligibility, linkage methodology and data quality assessments of linked data (e.g., reporting of linkage errors and benchmarking results). Assessment of quality focused on the blended data and not the data quality of the input sources.
The air quality data were chosen as an example of an input data source that could be used to blend with health data, including surveys and administrative records (e.g., deaths, medical records) to understand the association of poor air quality with health outcomes. Assessment of quality focused on the data quality as an input data source when blending.
The PAM data were chosen as an example of ‘big data’, given the volume of data collected through physical activity monitoring and were evaluated for data quality as an input data source for blending. The size of the data file provided an example of how a researcher might approach thinking of blending data when one of the input sources has layers of complexity. This example was chosen because linking the PAM data with other data, for example mortality data, could inform research initiatives looking at physical activity and mortality. Although the PAM data used for this case study was from an NHANES module, the focus was on the PAM components that would be generalizable to similar collections, rather than the overall NHANES data collection.
Analysis
Structured discussions for each case study were used to consider the use of the FCSM Framework for assessing data quality. For each dimension, primary threats to data quality and possible mitigations were identified, when applicable. Trade-offs among the dimensions within the FCSM Framework were considered. Each dimension in the FCSM Framework was carefully considered and then applied to the case study by reviewing all documentation and metadata, and consulting with a subject matter expert. The completeness of the dimension was discussed and descriptions of how the supporting documentation/metadata, information from the subject matter expert related to each dimension were captured, and threats to data quality were identified. For each case study, when data for a dimension were well documented and appeared to have few known threats to quality, the data quality dimension was described as high. When data for a dimension where the data documentation/metadata did not have complete information or if threats to quality could not be mitigated, the data quality dimension was described as low. To date, there is no established scorecard or process for quantitatively evaluating data quality using the FCSM Framework. For the purpose of this assessment, low and high were subjective metrics and used to illustrate how the FCSM Framework could be applied in different scenarios.
Once the case studies were complete, the findings were assessed together. General observations about the use of the FCSM Framework for assessing data quality and observations specific to each case study were identified.
Description of case studies
Linked NHANES-HUD data: The first case study, 1999–2018 NHANES data linked to HUD data through 2019, is an example of data blended through record linkage that is used primarily for research purposes. NHANES is a series of nationally representative cross-sectional surveys of the U.S. civilian, noninstitutionalized population that is selected using a complex, multistage probability design [2, 10] and consisting of about 5,000 persons from 15 different counties each year and released in two-year increments. The survey includes a standardized health examination, laboratory tests, and questionnaires that cover various health-related topics.
HUD is the primary federal agency responsible for overseeing domestic housing programs and policies and is responsible for administrating various housing and community development programs [11]. HUD administrative data systems contain housing, income, and program participation data for recipients of Housing Choice Vouchers (HCV), Public Housing (PH), and Multifamily (MF) programs.
Only NHANES participants who provided consent for person level data linkage as well as the necessary personally identifiable information (PII), such as name and date of birth, were eligible for linkage. NHANES participants under 18 years of age at the time of the survey were considered linkage eligible if they met linkage eligibility criteria and consent was provided by their parent or guardian [12].
The quality of linked data is a combination of the quality of each source, the quality of the blending method, and the quality of the resulting data for the intended purpose. For this case study, the authors focused on the quality of the blending method and the resulting linked data.
Description of three case studies and identification of potential threats to domains of data quality for each
Description of three case studies and identification of potential threats to domains of data quality for each
*Dimensions of data quality: utility (relevance, accessibility, timeliness, punctuality, and granularity); objectivity (accuracy and reliability, and coherence); integrity (scientific integrity, credibility, computer and physical security, and confidentiality). RDC
Table 2 provides information about the linked NHANES-HUD data and summarizes its identified threats to quality for the dimensions of the FCSM Framework. The quality of these data in many dimensions was considered high for research purposes, including for relevance, accuracy, scientific integrity, computer and physical security and confidentiality. Linked NHANES-HUD data have supported numerous studies ranging from blood lead levels among children receiving federal housing assistance to the association of cigarette smoking and asthma among people receiving housing assistance [13, 14] (relevance). Benchmarking measurements are in line with estimates from the full HUD population and linkage errors are low [12] (accuracy). As a result, the scientific integrity of the linked NHANES-HUD data is high. Data are available through the NCHS RDC, a secure computing environment, to protect confidentiality of respondents. However, due to the processing time to release survey data, the time to coordinate data sharing agreements and complete the linkage process, the data were considered low on timeliness. For example, as of the writing of this paper the linked NHANES-HUD data only included survey data through 2018 and administrative data through 2019, and therefore, could not be used for COVID-19 related research (see NCHS Data Linkage table [Reviewed 2022 December 28; cited 2023 May 23], Available from https://www.cdc.gov/nchs/data/datalinkage/LinkageTable_1.pdf.)
Air quality: The second case study considered was on the use of outdoor, or ambient, air quality data that could be blended with health data, including health survey data and administrative records, for conducting research to improve understanding of the association between air pollution and health. Studies have generally demonstrated a negative association of poor air quality on health and on health disparities, though specific air quality measures, health outcomes, and study designs differ among studies [15, 16].
Air quality data are collected, processed, and analyzed for many reasons. For instance, air quality measurements from monitors are routinely collected by the U.S. Environmental Protection Agency for compliance purposes and can have limitations when used for tracking individual- or community-level exposures at continuous spatiotemporal scales. Modeled predictions can augment gaps in monitoring data and can estimate exposures over an area, but prediction accuracy can vary based on several factors, including assumptions centered around meteorology and emissions. Other approaches to estimating air pollution exposures include the use of satellite-based remote sensing and low-cost sensors. Remote-sensing data, which are available in a timely manner, can be used to create measures of air quality and to develop emission inventories that support modeled estimates. Low-cost air sensors, including ‘purple’ air monitors, that are part of citizen science networks can help characterize local air quality levels with reasonable accuracy [17]. Furthermore, air pollution data collected during and after wildfires, dust storms, volcanic eruptions and other air quality events or natural disasters also provide information on air quality [18]. In addition, any or all of these individual air quality data sources can be combined with or without other environmental parameters (e.g., temperature, land use) for generating ‘fused’ or ‘blended’ air pollution data for use in public health research and surveillance [19]. Specifically, newer approaches to combining various air quality data sources, either in a statistical framework or using an artificial intelligence (AI) based framework, have gained wide-spread acceptance in the environmental health community [20].
Air quality data can be blended with health and other data by merging aforementioned air quality data sources by geography or locational attributes (e.g., municipal indicators, such as county, grids, latitude and longitude), by time (e.g., annual, monthly, daily, hourly), and by other indicators, such as whether an air pollution metric exceeds a certain threshold.
As with all blended data, the quality of air pollution data blended with health data are a combination of the quality of each source, the quality of the blending method, and the quality of the resulting data for the intended purpose. For this case study, the authors focused on the quality of the air pollution data and the derived estimates of air quality, and the geography and temporal resolutions needed for blending.
Table 2 summarizes the air pollution data as considered for this case study and their quality for the dimensions of the FCSM Framework. The quality of these data in many dimensions is high, including relevance, accuracy, and scientific integrity. Blended air quality and health data have been used in numerous studies that have informed decisions ranging from determining air quality standards to guidance for high-risk groups. As a result, the relevance of air quality data for blending was considered high. Measurements and model-based estimates are considered accurate and are typically based on current technologies for collection and processing (high scientific integrity). However, different modeling assumptions and analytic decisions may increase the threat to coherence.
Physical Activity Monitoring (PAM) data: The third case study evaluated 2013–2014 PAM data collected in NHANES (Table 2) [9]. The personal monitoring devices used in NHANES to collect the data were worn on the wrist for one week and measured body movements at the wrist, including those like the swinging of the arm during activities such as walking or jogging, intensity of movement over time, and the amount of time spent doing different levels of physical or sedentary activity.
The use of PAM data is complicated by the high dimensionality of the data, requiring very large data files that include detailed information on several dimensions of activity and movement that, as of this writing, require extensive computing resources and expertise to develop of metrics for analysis. Blending these large, high-dimensional data adds additional complexities arising from the blending methods and the planned analyses.
While the data source for this case study was the NHANES PAM data, some of the assessments provided here could apply to other sources of person-level data obtained through wearable, personal monitoring devices, not necessarily collected through NHANES. PAM data are collected for other reasons, including research studies e.g. [21, 22], and patient health monitoring.
Table 2 summarizes PAM data as considered for this case study and its quality for the dimensions of the FCSM Framework. The quality of these data in many dimensions is high, including relevance, accuracy, scientific integrity, computer and physical security, and confidentiality. NHANES PAM data were collected and processed using scientifically validated protocols and IT procedures that increase their accuracy and scientific integrity and protect confidentiality and data security [9]. Creating summary statistics or other dimension reduction approaches using scientifically sound methods, including ones that rely on machine learning, for pre-processing the PAM data can improve their accessibility. Blended PAM and mortality data have been used in studies of mortality and cognitive function [21, 22]. As a result, the relevance of PAM data for blending is high. However, timeliness may be low in the data quality assessment because of the periodic collection of some NHANES components as well as the time it takes to process and prepare the data for release. As of the writing of this manuscript the most recent collection and release of PAM data are from the NHANES 2013–2014 cycle. Measurements and model-based estimates are considered accurate and are typically based on current technologies for collection and processing.
In providing examples for using the FCSM Framework, Table 2 describes potential threats to data quality identified for the three case studies. This section provides a brief summary for each dimension of data quality.
Domain of utility
Relevance
Data from each case study were considered relevant for answering health-related research questions, and that the relevance of input sources increased when blended. Published studies directly or indirectly are one way to evaluate the data’s relevance for health research and were identified for each case study. Threats to relevance occur when data do not align with the most pertinent research questions; for example, if person-level air quality data are needed but only area-level are available and therefore are used as a proxy for person-level data. Threats to relevance may also increase as threats to other dimensions increase, including threats to timeliness, accuracy, and scientific integrity.
Accessibility
There were two types of accessibility issues considered for these case studies. The first was the complexity of the input or blended data. The more complex the input data and resulting blended data, the more difficult they are to successfully use. The complexity of linked, blended, and large monitoring data reduces their accessibility for users who may not be familiar with methods or tools for analyzing big data. This threat is reduced through interdisciplinary research teams, by thorough documentation (including but not limited to analytic guidelines and web tutorials), and through increased and varied research uses, where published examples can illustrate best-practices for analysis.
The second type of accessibility considered was how the data can be obtained and used. The data may have access restrictions due to disclosure risks and, as a result, be more difficult to obtain for analysis (e.g., analyses must be conducted in a secure RDC). Advances in synthetic blended data or the availability of public use ‘feasibility files’ (files that provide a limited set of variables that can be used to determine the maximum available sample size for each linked file) may reduce this threat for some uses by providing users with limited public use data that can be used for developing analytic plans and testing code.
Timeliness
Timeliness is the length of time between the event or phenomenon the data describe and their availability. Preparing data sharing agreements, standardizing the final adjudicated data, processing complex data, such as modeled or very large files, and performing record linkages or implementing other blending methods all add to the time it takes to release a file. This complexity in data production can cause threats to data quality for research that depends on timeliness. Innovations in data science and statistics may reduce these threats by facilitating greater automation and efficiency of these data production processes, as can advances in data sharing and governance that are being implemented throughout the federal government which may facilitate more timely and efficient data sharing [23, 24].
Punctuality
With blended data, threats to punctuality are related to delays in any of the components of blended data, from data sharing agreements and input data processing to data blending and dissemination. The multiple steps needed to produce blended data increase the risks of missing deadlines. Punctuality differs from timeliness by its focus on expected timelines for the data’s availability, rather than the correspondence between the data’s reference time and current time. Data users expect delivery of data at a given time and may plan their research accordingly. If data producers fail to deliver the data as planned, this becomes a quality issue which can negatively affect research.
Given the tremendous size of the data file (over 1 terabyte compressed), for example, the PAM data were significantly delayed in their release. Mitigations include efficiencies in processing that are realized through technology, scientific development, and subject matter experience.
Granularity
In general, threats to granularity for all data include reduced sample size and lack of detailed information available that permits analysis of small population subgroups and small-scale geographic locations. When blending data, threats to granularity from reduced sample size can result from linking or blending data, as the size of the blended data for analysis is a function of the size of the smaller data input excluding records that cannot be blended. For example, NHANES data prior to linkage have limited granularity due to sample size and degrees of freedom (only about 5,000 participants a year from 15 PSUs), compounded when samples are limited to individuals who are linkage-eligible. With only about 10 million people in the U.S. receive federal rental assistance [12], the linked NHANES-HUD data subsequently have very little granularity as the number of linked respondents can be small; see the NCHS match rate table for the NHANES-HUD linked data here:
However, blending air quality data with survey data is not dependent on linkage-eligibility requirements that are needed for person-level linkage and does not necessarily decrease granularity relative to the input sources since air quality data provide information at various geographic levels, particularly when model-based methods are employed and the data are available for all or nearly all respondents.
Domain of objectivity
Accuracy and reliability
Threats to accuracy and reliability are numerous. New tools are being developed to automate and standardize many measures of accuracy to enable regular assessments. Key threats to accuracy for the case studies include missing item or record level data; potential bias due to linkage (e.g., differential linkage eligibility or quality); insufficient metadata, lack of complete addresses for geocoding; mis-aligned geographies, including those based on administrative (e.g., U.S. Federal Information Processing Standards (FIPS)-based) identifiers that change; modeling error, and monitor disruptions (air quality data); and possible device malfunction (PAM). Threats to accuracy can also be reduced by blending, where information may be more accurate in one source compared to the other and can be used to improve the accuracy of a given item. For example, race/ethnicity data obtained by self-report in a survey may be more accurate than the race/ethnicity data collected on death certificates when mortality data are linked [25] whereas Medicaid or Social Security Administration program participation may be more accurately determined through linkage rather than survey self-report [26, 27].
Coherence
Within the domain of Objectivity, accuracy and coherence are related and threats and mitigations to accuracy identified above can also relate to coherence. For these case studies, coherence was evaluated in different ways for data alignment to related sources of information. Threats to coherence for linked data may increase with the potential of bias from linked data when not all records are eligible for linkage so the population used for estimation with the linked data may not be the same as that in the administrative data. This threat means that estimates from the linked data may not align with estimates from the administrative data. This threat for linked data could be mitigated by adjustments to sample weights or other analytic approaches but the success of the mitigation would depend on the extent of the bias and available information for adjustment. Threats to the coherence of blended air quality data arise from the use of different modeling approaches, different data processing decisions, monitor-specific data, and different blending decisions which could lead to some variation in inference among related studies. For both the linked NCHS-HUD data and the air quality data use-cases mitigations of these threats include the use of common definitions, scientifically valid statistical methods, standard approaches for modeling and other analytic processes, and the provision of detailed documentation so users can understand and interpret differences among sources.
Domain of integrity
Scientific integrity
Threats to scientific integrity can increase with outside interference and the use of outdated or insufficiently rigorous scientific methods. No threats to scientific integrity were identified for these case studies.
Credibility
Threats to credibility arise from threats to the producers’ reputations. No threats to credibility were identified for these case studies.
Computer and physical security
No threats to computer and physical security were identified for these case studies. However, evaluation of these case studies relied on the practices and standards of each data provider for assurances on threats to computer and physical security.
Confidentiality
In general, threats to confidentiality increase when using blended data by increasing the amount of information available about a survey participant, program recipient, or geographic location. Blending air quality data to person-level data, for example, increases threats of person-level disclosure even when actual locations are removed from the data file as people in areas with extreme values of air quality could be identified. Confidentiality threats are increased by information available on the internet, including historical information and information that may be collected in the future, that can be combined with person-level information. Threats are mitigated through restricted access and may be mitigated through innovations in synthetic data.
Conclusions
Four key conclusions for understanding the usefulness of the FCSM Framework were identified when assessing and synthesizing the three case studies for the purpose of health-related research.
First, data quality assessment for each dimension of data quality can be more complex in practice than anticipated. This complexity is particularly true for blended data and data being considered for blending, where the data quality of each input, the quality of the blending method, and the quality of the output should each be evaluated. Even for one data set being assessed for blending, assessing each dimension in-depth can be time consuming, particularly if information about that dimension is not available in documentation. Data quality for subpopulations may differ from that for the whole population, further complicating the quality assessment for certain data uses.
Documentation and expert guidance on data inputs and intended blending methods are critical for evaluating quality for each dimension. Evaluation of data for secondary uses, when these uses were not originally considered for the data, can be particularly challenging. For example, analyzing housing transactions with HUD administrative records is more complicated than using the data to determine if a survey participant ever received federal assisted housing [28]. Administrative data are originally collected for regulatory or program administration purposes, and not necessarily for research purposes. Air monitors, for example, are sited both for monitoring pollution from specific sources and characterizing overall trends in air quality. Information about the uses and quality of these data for research may not be considered in administrative data documentation which may hinder some aspects of the data quality assessments.
Information about threats to computer and physical security of these data through their lifecycles is not always readily available in data documentation. As a result, assessing quality for this dimension may rely on assumptions based on evaluation of other dimensions, such as the data provider’s credibility.
Second, each quality dimension may not be equally important, depending on the use of the data. We did not identify a single priority dimension when evaluating data quality for blended data for these three case studies: survey data linked to administrative data, air quality data, and PAM data. Whereas threats to granularity may be most important for research on air quality and health and health equity research that depends on accurately measuring exposures at small spatial scales and having sufficient subgroup data at those small scales, the threats to accessibility may be most important for users of the NHANES-HUD linked data and other linked data that require researchers to conduct their work in a secure RDC.
Dimensions in the domain of utility, particularly relevance, are important for deciding whether to blend data; if the potential input data are not relevant for the intended purpose, then the resources needed to obtain, blend, and analyze the data may not be cost-effective.
Third data quality assessments can be subjective and having a quantitative tool could help explain the results, however, quantitative assessments may be closely tied to the intended use of the dataset. When assessing the case-studies, the data quality for each dimension was assigned a rating of low or high. Even with this binary categorization, the assignment into one of the two levels was subjective for some dimensions. Structured tools, such as data quality scorecards, can provide a common approach to compare data across sources and communicate information [29]. However, their usefulness may depend on the intended purposes of the data and the relative importance of the quality dimensions for that purpose. They are most useful for quantitative measures for the dimension of accuracy for a single data source. To date, there is no published scorecard specifically for the FCSM Framework.
Finally, there are common trade-offs and commonalities across dimensions. While the complexity of blended data can increase its relevance for a broad array of research questions, the quality of the data can be affected by increased threats to timeliness, scientific integrity, accessibility, and confidentiality. Most generally, acquiring, processing, and blending multiple data sources takes additional time beyond the process for producing the input data sources, and the increased relevance of blended data for certain research questions is tempered by the resulting threats to timeliness. Blending and blended data evaluations cannot begin until the source data are complete and processed. In addition, blended data have higher threats to confidentiality as more information about a single entity are combined into one file, even if identifiable information is removed in the blended dataset. These increased threats to confidentiality are mitigated by restricted access or other privacy preserving techniques [30]. The NHANES-HUD linked data, and related NCHS linked datasets including those with geocodes for linking to air quality, are restricted use and available to researchers through the NCHS RDC. Granular data are more relevant for providing information about certain subpopulation and subnational geographic units, but granular data can also pose greater threats to confidentiality, resulting in lower accessibility when restricted through an RDC. Further, the quality of data for population subgroups and smaller geographic areas may differ from the overall data quality and may be particularly vulnerable to differential biases from incomplete information needed for blending.
Summary
The FCSM Framework provides a common basis for sharing information about data quality with its structure and terminology. This paper is one of the first to our knowledge to apply the domains and dimensions of the FCSM Framework to specific use cases with the purpose of understanding and illustrating how the FCSM Framework could be utilized and applied. The paper was not meant to be an exhaustive look at the quality of the three data sources but rather an illustration for those who want to implement a standardized vocabulary across disciplines to describe data quality. The synthesis of information from these case studies provides conclusions of the FCSM Framework’s use that may be applicable for other situations. Additional assessments conducted by data producers, disseminators, researchers, and analysts would provide more examples of the FCSM Framework’s utility for evaluating other types of data and for evaluating other data purposes. The three case-studies examined here are not intended to be representative of all blended data. However, the deliberate selection of these case studies was meant to capture different types of blended data, particularly as the scope of the FCSM Framework includes blended data. Developing tools, guidelines, and approaches for evaluating data quality using the FCSM Framework will be an iterative process that will gain robustness as the number and scope of case studies and other data quality assessments using the FCSM Framework increase.
This study had several strengths, including use of three different types of blended data and data for blending for the case studies: linked survey and administrative data (linked NCHS-HUD data); environmental monitoring data, including modeled data (air quality); physical activity monitoring data (PAM). Even with three case studies, several conclusions could be made: data quality assessment can be more complex in practice than anticipated, particularly for blended data; each quality dimension may not be equally important, depending on the use of the data; assessment tools would be helpful but having multiple uses for the data and a mix of quantitative and qualitative measures among the quality dimensions may reduce the usefulness of such tools; and there are common trade-offs and commonalities across dimensions.
This study was not designed to be a comprehensive assessment of the Framework’s utility or to develop tools and guidelines for evaluating data quality; rather it was designed to illustrate how the FCSM Framework could be used for these three health-related case studies and to inform future applications of the Framework by researchers interested in assessing data quality. The case studies included micro-data sources only; tables, summary measures, visualizations, and other data products are not included. While the selected case studies were identified to capture different types of data, there are only three of them. Results could differ for different data types and purposes. The four main conclusions described herein, however, will likely be observed in other use cases relying on similar types of data (administrative, survey, environmental).
Other approaches to assessing the use of the FCSM Framework may uncover additional insights. Independent evaluations with formal testing would provide information on how different assessors would approach the question and evaluate the data. This could be informative as decisions are made about mitigating threats. The independent evaluations were out of scope for this project.
The quality of blended data includes the quality of each input, the quality of blending methods, and the resulting quality of the outputs. The complexity of addressing all components of blended data for each case study was beyond the scope of this paper. Rather, we focused on the most salient components for our purpose. In addition, this work did not focus on data quality for other data uses. Use of blended data for real-time decisions or public health surveillance was considered early on but not pursued because of the increased complexities and general lack of timeliness of blended data.
This work supports the importance of assessing data quality and conceptualizes it in a qualitative assessment. Going forward, researchers and federal agencies may consider having an overall summary of data quality as part of their metadata and methods documentation. As more blended data are used for evidence-based policymaking, understanding and communicating their quality is vital to their appropriate use and interpretation.
Footnotes
Acknowledgments
The authors recognize Alexa Limeres, Susan Queen, and the HHS Data Council for their participation and input into the project.
This research was conducted while Lisa B. Mirel was employed at the National Center for Health Statistics, Centers for Disease Control and Prevention prior to becoming an employee at the National Center for Science and Engineering Statistics within the National Science Foundation.
This research was conducted while Ryan Mintz was employed in the Office of the Assistant Secretary for Planning and Evaluation, U.S. Department of Health and Human Services.