
Abstract
The development and standardization of Semantic Web technologies has resulted in an unprecedented volume of data being published on the Web as Linked Data (LD). However, we observe widely varying data quality ranging from extensively curated datasets to crowdsourced and extracted data of relatively low quality. In this article, we present the results of a systematic review of approaches for assessing the quality of LD. We gather existing approaches and analyze them qualitatively. In particular, we unify and formalize commonly used terminologies across papers related to data quality and provide a comprehensive list of 18 quality dimensions and 69 metrics. Additionally, we qualitatively analyze the 30 core approaches and 12 tools using a set of attributes. The aim of this article is to provide researchers and data curators a comprehensive understanding of existing work, thereby encouraging further experimentation and development of new approaches focused towards data quality, specifically for LD.
Introduction
The development and standardization of Semantic Web technologies has resulted in an unprecedented volume of data being published on the Web as Linked Data (LD). This emerging Web of Data comprises of close to 188 million facts represented as Resource Description Framework (RDF) triples (as of 20141
). Although gathering and publishing such massive amounts of data is certainly a step in the right direction, data is only as useful as its quality. Datasets published on the Data Web already cover a diverse set of domains such as media, geography, life sciences, government etc.2 However, data on the Web reveals a large variation in data quality. For example, data extracted from semi-structured sources, such as DBpedia [39,47], often contains inconsistencies as well as misrepresented and incomplete information.Data quality is commonly conceived as fitness for use [33,35,63] for a certain application or use case. Even datasets with quality problems might be useful for certain applications, as long as the quality is in the required range. For example, in the case of DBpedia the data quality is perfectly sufficient for enriching Web search with facts or suggestions about general information, such as entertainment topics. In such a scenario, DBpedia can be used to show related movies and personal information, when a user searches for an actor. In this case, it is rather neglectable, when in relatively few cases, a related movie or some personal facts are missing.
The quality of data is crucial when it comes to taking far-reaching decisions based on the results of querying multiple datasets. For developing a medical application, for instance, the quality of DBpedia is probably insufficient, as shown in [65], since data is extracted via crowdsourcing of a semi-structured source. It should be noted that even the traditional, document-oriented Web has content of varying quality but is still perceived to be extremely useful by most people. Consequently, a key challenge is to determine the quality of datasets published on the Web and make this quality information explicit. Assuring data quality is particularly a challenge in LD as the underlying data stems from a set of multiple autonomous and evolving data sources. Other than on the document Web, where information quality can be only indirectly (e.g. via page rank) or vaguely defined, there are more concrete and measurable data quality metrics available for structured information. Such data quality metrics include correctness of facts, adequacy of semantic representation and/or degree of coverage.
There are already many methodologies and frameworks available for assessing data quality, all addressing different aspects of this task by proposing appropriate methodologies, measures and tools. Data quality is an area researched long before the emergence of Linked Data, some quality issues are unique to Linked Data, while others were looked at before. In particular, the database community has developed a number of approaches [4,38,51,62]. In this survey, we focus on Linked Data Quality and hence, we primarily cite works dealing with Linked Data. Where the authors adopted definitions from general data quality literature, we indicated this in the survey. The novel data quality aspects original to Linked Data include, for example, coherence via links to external datasets, data representation quality or consistency with regard to implicit information. Furthermore, inference mechanisms for knowledge representation formalisms on the Web, such as OWL, usually follow an open world assumption, whereas databases usually adopt closed world semantics. Additionally, there are efforts focused on evaluating the quality of an ontology either in the form of user reviews of an ontology, which are ranked based on inter-user trust [42] or (semi-) automatic frameworks [60]. However, in this article we focus mainly on the quality assessment of instance data.
Despite LD quality being an essential concept, few efforts are currently in place to standardize how quality tracking and assurance should be implemented. Moreover, there is no consensus on how the data quality dimensions and metrics should be defined. Furthermore, LD presents new challenges that were not handled before in other research areas. Thus, adopting existing approaches for assessing LD quality is not straightforward. These challenges are related to the openness of the Linked Data, the diversity of the information and the unbounded, dynamic set of autonomous data sources and publishers.

Number of articles retrieved during the systematic literature search.
Therefore, in this paper, we present the findings of a systematic review of existing approaches that focus on assessing the quality of LD. We would like to point out to the readers that a comprehensive survey done by Batini et al. [5] already exists which focuses on data quality measures for other structured data types. Since there is no similar survey specifically for LD, we undertook this study. After performing an exhaustive survey and filtering articles based on their titles, we retrieved a corpus of 118 relevant articles published between 2002 and 2014. Further analyzing these 118 retrieved articles, a total of 30 papers were found to be relevant for our survey and form the core of this paper. These 30 approaches are compared in detail and unified with respect to:
commonly used terminologies related to data quality, 18 different dimensions and their formalized definitions, 69 total metrics for the dimensions and an indication of whether they are measured quantitatively or qualitatively and comparison of the 12 proposed tools used to assess data quality.
Our goal is to provide researchers, data consumers and those implementing data quality protocols specifically for LD with a comprehensive understanding of the existing work, thereby encouraging further experimentation and new approaches.
This paper is structured as follows: In Section 2, we describe the survey methodology used to conduct this systematic review. In Section 3, we unify and formalize the terminologies related to data quality and in Section 4 we provide (i) definitions for each of the 18 data quality dimensions along with examples and (ii) metrics for each of the dimensions. In Section 5, we compare the selected approaches based on different perspectives such as, (i) dimensions, (ii) metrics, (iii) type of data and also distinguish the proposed tools based on a set of eight different attributes. In Section 6, we conclude with ideas for future work.
Two reviewers, from different institutions (the first two authors of this article), conducted this systematic review by following the systematic review procedures described in [34,46]. A systematic review can be conducted for several reasons [34] such as: (i) the summarization and comparison, in terms of advantages and disadvantages, of various approaches in a field; (ii) the identification of open problems; (iii) the contribution of a joint conceptualization comprising the various approaches developed in a field; or (iv) the synthesis of a new idea to cover the emphasized problems. This systematic review tackles, in particular, problems (i)–(iii), in that it summarizes and compares various data quality assessment methodologies as well as identifying open problems related to LD. Moreover, a conceptualization of the data quality assessment field is proposed. An overview of our search methodology including the number of retrieved articles at each step is shown in Fig. 1 and described in detail below.
Related surveys. In order to justify the need of conducting a systematic review, we first conducted a search for related surveys and literature reviews. We came across a study [35] conducted in 2005, which summarizes 12 widely accepted information quality frameworks applied on the World Wide Web. The study compares the frameworks and identifies 20 dimensions common between them. Additionally, there is a comprehensive review [4], which surveys 13 methodologies for assessing the data quality of datasets available on the Web, in structured or semi-structured formats. Our survey is different since it focuses only on structured (linked) data and on approaches that aim at assessing the quality of LD. Additionally, the prior review (i.e. [35]) only focused on the data quality dimensions identified in the constituent approaches. In our survey, we not only identify existing dimensions but also introduce new dimensions relevant for assessing the quality of LD. Furthermore, we describe quality assessment metrics corresponding to each of the dimensions and also identify whether they are quantitatively or qualitatively measured.
Research question. The goal of this review is to analyze existing methodologies for assessing the quality of structured data, with particular interest in LD. To achieve this goal, we aim to answer the following general research question:
How can one assess the quality of Linked Data employing a conceptual framework integrating prior approaches?
We can divide this general research question into further sub-questions such as:
What are the data quality problems that each approach assesses?
Which are the data quality dimensions and metrics supported by the proposed approaches?
What kinds of tools are available for data quality assessment?
Eligibility criteria. As a result of a discussion between the two reviewers, a list of eligibility criteria was obtained as listed below. The articles had to satisfy the first criterion and one of the other four criteria to be included in our study.
Inclusion criteria:
Must satisfy:
Studies published in English between 2002 and 2014.
and should satisfy any one of the four criteria:
Studies focused on data quality assessment for LD
Studies focused on trust assessment of LD
Studies that proposed and/or implemented an approach for data quality assessment in LD
Studies that assessed the quality of LD or information systems based on LD principles and reported issues
Exclusion criteria:
Studies that were not peer-reviewed or published except theses
Assessment methodologies that were published as a poster abstract
Studies that focused on data quality management
Studies that neither focused on LD nor on other forms of structured data
Studies that did not propose any methodology or framework for the assessment of quality in LD
Search strategy. Search strategies in a systematic review are usually iterative and are run separately by both members to avoid bias and ensure complete coverage of all related articles. Based on the research question and the eligibility criteria, each reviewer identified several terms that were most appropriate for this systematic review, such as: data, quality, data quality, assessment, evaluation, methodology, improvement, or linked data. These terms which were used as follows:
linked data and (quality OR assessment OR evaluation OR methodology OR improvement) (data OR quality OR data quality) AND (assessment OR evaluation OR methodology OR improvement)
As suggested in [34,46], searching in the title alone does not always provide us with all relevant publications. Thus, the abstract or full-text of publications should also potentially be included. On the other hand, since the search on the full-text of studies results in many irrelevant publications, we chose to apply the search query first on the title and abstract of the studies. This means a study is selected as a candidate study if its title or abstract contains the keywords defined in the search string.
After we defined the search strategy, we applied the keyword search in the following list of search engines, digital libraries, journals, conferences and their respective workshops:
Search Engines and digital libraries: Google Scholar ISI Web of Science ACM Digital Library IEEE Xplore Digital Library Springer Link Science Direct Journals: Semantic Web Journal (SWJ) Journal of Web Semantics (JWS) Journal of Data and Information Quality (JDIQ) Journal of Data and Knowledge Engineering (DKE) Theoretical Computer Science (TCS) International Journal on Semantic Web and Information Systems’ (IJSWIS) Special Issue on Web Data Quality (WDQ) Conferences and Workshops: International World Wide Web Conference (WWW) International Semantic Web Conference (ISWC) European Semantic Web Conference (ESWC) Asian Semantic Web Conference (ASWC) International Conference on Data Engineering (ICDE) Semantic Web in Provenance Management (SWPM) Consuming Linked Data (COLD) Linked Data on the Web (LDOW) Web Quality (WQ) I-Semantics (I-Sem) Linked Science (LISC) On the Move to Meaningful Internet Systems (OTM) Linked Web Data Management (LWDM)
Thereafter, the bibliographic metadata about the 118 potentially relevant primary studies were recorded using the bibliography management platform Mendeley3
Titles and abstract reviewing. Both reviewers independently screened the titles and abstracts of the retrieved 118 articles to identify the potentially eligible articles. In case of disagreement while merging the lists, the problem was resolved either by mutual consensus or by creating a list of articles to go under a more detailed review. Then, both the reviewers compared the articles and based on mutual agreement obtained a final list of 73 articles to be included.
Retrieving further potential articles. In order to ensure that all relevant articles were included, the following additional search strategies were applied:
Looking up the references in the selected articles Looking up the article title in Google Scholar and retrieving the “Cited By” articles to check against the eligibility criteria Taking each data quality dimension individually and performing a related article search
After performing these search strategies, we retrieved four additional articles that matched the eligibility criteria.
Compare potentially shortlisted articles among reviewers. At this stage, a total of 73 articles relevant for our survey were retrieved. Both reviewers then compared notes and went through each of these 73 articles to shortlist potentially relevant articles. As a result of this step, 30 articles were selected.
List of the selected papers
Comparison perspective of selected approaches. There exist several perspectives that can be used to analyze and compare the selected approaches, such as:
the definitions of the core concepts the dimensions and metrics proposed by each approach the type of data that is considered for the assessment the comparison of the tools based on several attributes
This analysis is described in Sections 3 and 4.
Quantitative overview. Out of the 30 selected approaches, eight (26%) were published in a journal, particularly in the Journal of Web Semantics, International Journal on Semantic Web and Information Systems and Theoretical Computer Science. On the other hand, 21 (70%) approaches were published in international conferences such as WWW, ISWC, ESWC, I-Semantics, ICDE and their associated workshops. Only one (4%) of the approaches was a master thesis. The majority of the papers were published in an even distribution between the years 2010 and 2014 (four papers on average each year – 73%), two papers were published in 2008 and 2009 (6%) and the remaining six between 2002 and 2008 (21%).
There exist a number of discrepancies in the definition of many concepts in data quality due to the contextual nature of quality [4]. Therefore, we first describe and formally define the research context terminology (in this section) as well as the LD quality dimensions along with their respective metrics in detail (in Section 4).
In terms of the Semantic Web, there exist different means of assessing data quality. The process of measuring data quality is supported by quality related metadata as well as data itself. On the one hand, provenance (as a particular case of metadata) information, for example, is an important concept to be considered when assessing the trustworthiness of datasets [40]. On the other hand, the notion of link quality is another important aspect that is introduced in LD, where it is automatically detected whether a link is useful or not [24]. It is to be noted that data and information are interchangeably used in the literature.
Thus, the term data quality problem refers to a set of issues that can affect the potentiality of the applications that use the data.
There are a number of studies, which have identified, defined and grouped data quality dimensions into different classifications [4,7,32,49,52,61,63]. For example, Bizer et al. [7], classified the data quality dimensions into three categories according to the type of information that is used as a quality dimension: (i) Content Based – information content itself; (ii) Context Based – information about the context in which information was claimed; (iii) Rating Based – based on the ratings about the data itself or the information provider. However, we identify further dimensions (defined in Section 4) and classify the dimensions into the (i) Accessibility (ii) Intrinsic (iii) Contextual and (iv) Representational groups.
Linked Data quality dimensions
After analyzing the 30 selected approaches in detail, we identified a core set of 18 different data quality dimensions that can be applied to assess the quality of LD. We grouped the identified dimensions according to the classification introduced in [63]:
Accessibility dimensions Intrinsic dimensions Contextual dimensions Representational dimensions
An initial list of data quality dimensions was obtained from [6]. Thereafter, the problem addressed by each approach was extracted and mapped to one or more of the quality dimensions. We further re-examine the dimensions belonging to each group and change their membership according to the LD context. In this section, we unify, formalize and adapt the definition for each dimension according to LD. For each dimension, we identify metrics and report them too. In total, 69 metrics are provided for all the 18 dimensions. Furthermore, we classify each metric as being quantitatively or qualitatively assessed. Quantitatively (QN) measured metrics are those that are quantified or for which a concrete value (score) can be calculated. Qualitatively (QL) measured metrics are those which cannot be quantified and depend on the users perception of the respective metric.
Data quality metrics related to accessibility dimensions (type QN refers to a quantitative metric, QL to a qualitative one)
Data quality metrics related to accessibility dimensions (type QN refers to a quantitative metric, QL to a qualitative one)
The dimensions belonging to this category involve aspects related to the access, authenticity and retrieval of data to obtain either the entire or some portion of the data (or from another linked dataset) for a particular use case. There are five dimensions that are part of this group, which are availability, licensing, interlinking, security and performance. Table 2 displays metrics for these dimensions and provides references to the original literature.
Availability
Flemming [17] referred to availability as the proper functioning of all access methods. The other articles [29,30] provide metrics for this dimension. Availability of a dataset is the extent to which data (or some portion of it) is present, obtainable and ready for use. The metrics identified for availability are:
A1: checking whether the server responds to a SPARQL query [17] A2: checking whether an RDF dump is provided and can be downloaded [17] A3: detection of dereferenceability of URIs by checking: (i) for dead or broken links [29], i.e. that when an HTTP-GET request is sent, the status code (ii) that useful data (particularly RDF) is returned upon lookup of a URI [29] (iii) for changes in the URI, i.e. compliance with the recommended way of implementing redirections using the status code A4: detect whether the HTTP response contains the header field stating the appropriate content type of the returned file, e.g. A5: dereferenceability of all forward links: all available triples where the local URI is mentioned in the subject (i.e. the description of the resource) [30] Let us consider the case in which a user looks up a flight in our flight search engine. She requires additional information such as car rental and hotel booking at the destination, which is present in another dataset and interlinked with the flight dataset. However, instead of retrieving the results, she receives an error response code (Availability).
Licensing is a new quality dimensions not considered for relational databases but mandatory in the LD world. Flemming [17] and Hogan et al. [30] both stated that each RDF document should contain a license under which the content can be (re)used, in order to enable information consumers to use the data under clear legal terms. Additionally, the existence of a machine-readable indication (by including the specifications in a VoID8
Licensing is defined as the granting of permission for a consumer to re-use a dataset under defined conditions.
The metrics identified for licensing are:
Since our flight search engine aggregates data from several existing data sources, a clear indication of the license allows the search engine to re-use the data from the airlines websites. For example, the LinkedGeoData dataset is licensed under the Open Database License9
Interlinking is a relevant dimension in LD since it supports data integration. Interlinking is provided by RDF triples that establish a link between the entity identified by the subject with the entity identified by the object. Through the typed RDF links, data items are effectively interlinked. Even though the core articles in this survey do not contain a formal definition for interlinking, they provide metrics for this dimension [24,29,30]. Interlinking refers to the degree to which entities that represent the same concept are linked to each other, be it within or between two or more data sources. The metrics identified for interlinking are:
(b) clustering coefficient: how dense is the network [24] (c) centrality: indicates the likelihood of a node being on the shortest path between two other nodes [24] (d) whether there are open sameAs chains in the network [24] (e) how much value is added to the description of a resource through the use of sameAs edges [24] I2: detection of the existence and usage of external URIs (e.g. using I3: detection of all local in-links or back-links: all triples from a dataset that have the resource’s URI as the object [30] (Interlinking).
In our flight search engine, the instance of the country
Flemming [17] referred to security as “the possibility to restrict access to the data and to guarantee the confidentiality of the communication between a source and its consumers”. Additionally, Flemming referred to the verifiability dimension as the means a consumer is provided with to examine the data for correctness. Thus, security and verifiability point towards the same quality dimension i.e. to avoid alterations of the dataset and verify its correctness. Security is the extent to which data is protected against alteration and misuse. The metrics identified for security are:
S1: using digital signatures to sign documents containing an RDF serialization, a SPARQL result set or signing an RDF graph [17] S2: verifying authenticity of the dataset based on provenance information such as the author and his contributors, the publisher of the data and its sources (if present in the dataset) [17] In our use case, if we assume that the flight search engine obtains flight information from arbitrary airline websites, there is a risk for receiving incorrect information from malicious websites. For instance, an airline or sales agency website can pose as its competitor and display incorrect flight fares. Thus, by this spoofing attack, this airline can prevent users to book with the competitor airline. In this case, the use of standard security techniques such as digital signatures allows verifying the identity of the publisher. (Security).
Performance is a dimension that has an influence on the quality of the information system or search engine, not on the dataset itself. Flemming [17] states “the performance criterion comprises aspects of enhancing the performance of a source as well as measuring of the actual values”. Also, response-time and performance point towards the same quality dimension. Performance refers to the efficiency of a system that binds to a large dataset, that is, the more performant a data source is the more efficiently a system can process data. The metrics identified for performance are:
P2: low latency:12 Latency is the amount of time from issuing the query until the first information reaches the user [49]. (Performance).
P3: high throughput: (maximum) number of answered HTTP-requests per second [17]
P4: scalability: detection of whether the time to answer an amount of ten requests divided by ten is not longer than the time it takes to answer one request [17]
In our use case, the performance may depend on the type and complexity of the query by a large number of users. Our flight search engine can perform well by considering response-time when deciding which sources to use to answer a query.
The dimensions in this group are related with each other as follows: performance (response-time) of a system is related to the availability dimension. A dataset can perform well only if it is available and has low response time. Also, interlinking is related to availability because only if a dataset is available, it can be interlinked and these interlinks can be traversed. Additionally, the dimensions security and licensing are related since providing a license and specifying conditions for re-use helps secure the dataset against alterations and misuse.
Intrinsic dimensions
Data quality metrics related to intrinsic dimensions (type QN refers to a quantitative metric, QL to a qualitative one)
Data quality metrics related to intrinsic dimensions (type QN refers to a quantitative metric, QL to a qualitative one)
Data quality metrics related to intrinsic dimensions (type QN refers to a quantitative metric, QL to a qualitative one) continued
Fürber et al. [18] classified accuracy into syntactic and semantic accuracy. They explained that a “value is syntactically accurate, when it is part of a legal value set for the represented domain or it does not violate syntactical rules defined for the domain”. Flemming [17] defined the term validity of documents as “the valid usage of the underlying vocabularies and the valid syntax of the documents”. We thus associate the validity of documents defined by Flemming to syntactic validity. We similarly distinguish between the two types of accuracy defined by Fürber et al. and form two dimensions: Syntactic validity (syntactic accuracy) and Semantic accuracy. Additionally, Hogan et al. [29] identify syntax errors such as RDF/XML syntax errors, malformed datatype literals and literals incompatible with datatype range, which we associate with syntactic validity. The other articles [1,16,36,64,65] provide metrics for this dimension. Syntactic validity is defined as the degree to which an RDF document conforms to the specification of the serialization format. The metrics identified for syntactic validity are:
SV1: detecting syntax errors using (i) validators [17,29], (ii) via crowdsourcing [1,65] SV2: detecting use of: (i) explicit definition of the allowed values for a certain datatype [18] (ii) syntactic rules (type of characters allowed and/or the pattern of literal values) [18] (iii) detecting whether the data conforms to the specific RDF pattern and that the “types” are defined for specific resources [36] (iv) use of different outlier techniques and clustering for detecting wrong values [64] SV3: detection of ill-typed literals, which do not abide by the lexical syntax for their respective datatype that can occur if a value is (i) malformed, (ii) is a member of an incompatible datatype [16,29] In our use case, let us assume that the ID of the flight between Paris and New York is A123 while in our search engine the same flight instance is represented as A231. Since this ID is included in one of the datasets, it is considered to be syntactically accurate since it is a valid ID (even though it is incorrect). (Syntactic validity).
Fürber et al. [18] classified accuracy into syntactic and semantic accuracy. They explained that values are semantically accurate when they represent the correct state of an object. Based on this definition, we also considered the problems of spurious annotation and inaccurate annotation (inaccurate labeling and inaccurate classification) identified in Lei et al. [41] related to the semantic accuracy dimension. The other articles [1,7,9,13,16,36,50,65] provide metrics for this dimension. Semantic accuracy is defined as the degree to which data values correctly represent the real world facts. The metrics identified for semantic accuracy are:
SA1: detection of outliers by (i) using distance-based, deviation-based and distribution-based methods [7,16], (ii) using the statistical distributions of a certain type to assess the statement’s correctness [50] SA2: detection of inaccurate values by (i) using functional dependencies13 Functional dependencies are dependencies between the values of two or more different properties. SA3: detection of inaccurate annotations,14 Where an instance of the semantic metadata set can be mapped back to more than one real world object or in other cases, where there is no object to be mapped back to an instance. Where mapping from the instance to the object is correct but not properly labeled. In which the knowledge of the source object has been correctly identified by not accurately classified. Balanced distance metric is an algorithm that calculates the distance between the extracted (or learned) concept and the target concept [43]. (Semantic accuracy).
SA4: detection of misuse of properties18
Properties are often misused when no applicable property exists.
SA5: ratio of the number of semantically valid rules19
Valid rules are generated from the real data and validated against a set of principles specified in the semantic network.
Let us assume that the ID of the flight between Paris and New York is A123, while in our search engine the same flight instance is represented as A231 (possibly manually introduced by a data acquisition error). In this case, the instance is semantically inaccurate since the flight ID does not represent its real-world state i.e. A123.
Hogan et al. [29] defined consistency as “no contradictions in the data”. Another definition was given by Mendes et al. [45] that “a dataset is consistent if it is free of conflicting information”. The other articles [9,16,17,29,36,48,65] provide metrics for this dimension. However, it should be noted that for some languages such as OWL DL, there are clearly defined semantics, including clear definitions of what inconsistency means. In description logics, model based semantics are used: A knowledge base is a set of axioms. A model is an interpretation, which satisfies all axioms in the knowledge base. A knowledge base is consistent if and only if it has a model [3]. Consistency means that a knowledge base is free of (logical/formal) contradictions with respect to particular knowledge representation and inference mechanisms. A straightforward way to check for consistency is to load the knowledge base into a reasoner and check whether it is consistent. However, for certain knowledge bases (e.g. very large or inherently inconsistent ones) this approach is not feasible. Moreover, most OWL reasoners specialize in the OWL (2) DL sublanguage as they are internally based on description logics. However, it should be noted that Linked Data does not necessarily conform to OWL DL and, therefore, those reasoners cannot directly be applied. Some of the important metrics identified in the literature are:
CS1: detection of use of entities as members of disjoint classes using the formula: CS2: detection of misplaced classes or properties20 For example, a URI defined as a class is used as a property or vice-a-versa. CS3: detection of misuse of For example, attribute properties used between two resources and relation properties used with literal values. (Consistency).
CS4: detection of use of members of
CS5: detection of bogus
CS6: detection of the re-definition by third parties of external classes/properties (ontology hijacking) such that reasoning over data using those external terms is not affected [29]
CS7: detection of negative dependencies/correlation among properties using association rules [9]
CS8: detection of inconsistencies in spatial data through semantic and geometric constraints [48]
CS9: the attribution of a resource’s property (with a certain value) is only valid if the resource (domain), value (range) or literal value (rdfs ranged) is of a certain type – detected by use of SPARQL queries as a constraint [36]
CS10: detection of inconsistent values by the generation of a particular set of schema axioms for all properties in a dataset and the manual verification of these axioms [65]
Let us assume a user looking for flights between Paris and New York on the 21st of December, 2013. Her query returns the following results:
The results show that the flight number
Under the assumption that we can infer that
Mendes et al. [45] classified conciseness into schema and instance level conciseness. On the schema level (intensional), “a dataset is concise if it does not contain redundant attributes (two equivalent attributes with different names)”. Thus, intensional conciseness measures the number of unique schema elements (i.e. properties and classes) of a dataset in relation to the overall number of schema elements in a schema. On the data (instance) level (extensional), “a dataset is concise if it does not contain redundant objects (two equivalent objects with different identifiers)”. Thus, extensional conciseness measures the number of unique objects in relation to the overall number of objects in the dataset. This definition of conciseness is very similar to the definition of ‘uniqueness’ defined by Fürber et al. [18] as the “degree to which data is free of redundancies, in breadth, depth and scope”. This comparison shows that uniqueness and conciseness point to the same dimension. Redundancy occurs when there are equivalent schema elements with different names/identifiers (in case of intensional conciseness) and when there are equivalent objects (instances) with different identifiers (in case of extensional conciseness) present in a dataset [41]. Kontokostas et al. [36] provide metrics for this dimension. Conciseness refers to the minimization of redundancy of entities at the schema and the data level. Conciseness is classified into (i) intensional conciseness (schema level) which refers to the case when the data does not contain redundant schema elements (properties and classes) and (ii) extensional conciseness (data level) which refers to the case when the data does not contain redundant objects (instances). The metrics identified for conciseness are:
(Conciseness).
In our flight search engine, an example of intensional conciseness would be a particular flight, say
Fürber et al. [18] classified completeness into: (i) Schema completeness, which is the degree to which classes and properties are not missing in a schema; (ii) Column completeness, which is a function of the missing property values for a specific property/column; and (iii) Population completeness, which refers to the ratio between classes represented in an information system and the complete population. Mendes et al. [45] distinguished completeness on the schema and the data level. On the schema level, a dataset is complete if it contains all of the attributes needed for a given task. On the data (i.e. instance) level, a dataset is complete if it contains all of the necessary objects for a given task. The two types of completeness defined in Mendes et al. can be mapped to the two categories (i) Schema completeness and (iii) Population completeness provided by Fürber et al. Additionally, we introduce the category interlinking completeness, which refers to the degree to which instances in the dataset are interlinked [24]. Albertoni et al. [2] define interlinking completeness as “linkset completeness as the degree to which links in the linksets are not missing.” The other articles [16,50,53] provide metrics for this dimension. Completeness refers to the degree to which all required information is present in a particular dataset. In terms of LD, completeness comprises of the following aspects: (i) Schema completeness, the degree to which the classes and properties of an ontology are represented, thus can be called “ontology completeness”, (ii) Property completeness, measure of the missing values for a specific property, (iii) Population completeness is the percentage of all real-world objects of a particular type that are represented in the datasets and (iv) Interlinking completeness, which has to be considered especially in LD, refers to the degree to which instances in the dataset are interlinked. The metrics identified for completeness are:
CM2: property completeness (i) CM4: interlinking completeness (i) In our use case, the flight search engine contains complete information to include all the airports and airport codes such that it allows a user to find an optimal route from the start to the end destination (even in cases when there is no direct flight). For example, the user wants to travel from Santa Barbara to San Francisco. Since our flight search engine contains interlinks between these close airports, the user is able to locate a direct flight easily. (Completeness).
It should be noted that in this case, users should assume a closed-world-assumption where a gold standard dataset is available and can be used to compare against the converted dataset.
The dimensions in this group are related to each other as follows: Semantic accuracy of a dataset is related to the consistency dimension. If we merge semantically accurate datasets, we will most likely get fewer inconsistencies than merging inaccurate datasets. However, data can be semantically accurate by representing the real world state but still can be inconsistent. On the other hand, being syntactically valid does not necessarily mean that the value is semantically accurate. Moreover, the completeness dimension is related to the syntactic validity, semantic accuracy and consistency dimensions. if a dataset is complete, tests for syntactic validity, semantic accuracy and consistency checks need to be performed to determine if the values have been completed correctly. Additionally, the conciseness dimension is related to the completeness dimension since both point towards the dataset having all, however unique (non-redundant) information. However, if data integration leads to duplication of instances, it may lead to contradictory values thus leading to inconsistency [8].
Contextual dimensions
Data quality metrics related to contextual dimensions (type QN refers to a quantitative metric, QL to a qualitative one)
Data quality metrics related to contextual dimensions (type QN refers to a quantitative metric, QL to a qualitative one)
Data quality metrics related to contextual dimensions (type QN refers to a quantitative metric, QL to a qualitative one) continued
Flemming [17] defined amount-of-data as the “criterion influencing the usability of a data source”. Thus, since the amount-of-data dimension is similar to the relevancy dimension, we merge both dimensions. Bonatti et al. [10] provides a metric for this dimension. The other articles [1,65] provide metrics for this dimension. Relevancy refers to the provision of information which is in accordance with the task at hand and important to the users’ query. The metrics identified for relevancy are:
R1: obtaining relevant data by: (i) ranking (a numerical value similar to PageRank), which determines the centrality of RDF documents and statements [10]), (ii) via crowdsourcing [1,65] R2: measuring the coverage (i.e. number of entities described in a dataset) and level of detail (i.e. number of properties) in a dataset to ensure that the data retrieved is appropriate for the task at hand [17] When a user is looking for flights between any two cities, only relevant information i.e. departure and arrival airports, starting and ending time, duration and cost per person should be provided. Some datasets, in addition to relevant information, also contain much irrelevant data such as car rental, hotel booking, travel insurance etc. and as a consequence a lot of irrelevant extra information is provided. Providing irrelevant data distracts service developers and potentially users and also wastes network resources. Instead, restricting the dataset to only flight related information simplifies application development and increases the likelihood to return only relevant results to users. (Relevancy).
Trustworthiness is a crucial topic due to the availability and the high volume of data from varying sources on the Web of Data. Jacobi et al. [31], similar to Pipino et al., referred to trustworthiness as a subjective measure of a user’s belief that the data is “true”. Gil et al. [20] used reputation of an entity or a dataset either as a result from direct experience or recommendations from others to establish trust. Ciancaglini et al. [14] state “the degree of trustworthiness of the triple will depend on the trustworthiness of the individuals involved in producing the triple and the judgement of the consumer of the triple.” We consider reputation as well as objectivity as part of the trustworthiness dimension. Other articles [10,14,16,19,21–23,26,45,59] provide metrics for assessing trustworthiness. Trustworthiness is defined as the degree to which the information is accepted to be correct, true, real and credible. The metrics identified for trustworthiness are:
T1: computing statement trust values based on: (i) provenance information which can be either unknown or a value in the interval [−1,1] where 1: absolute belief, −1: absolute disbelief and 0: lack of belief/disbelief [16,26] (ii) opinion-based method, which use trust annotations made by several individuals [21,26] (iii) provenance information and trust annotations in Semantic Web-based social-net- works [22] (iv) annotating triples with provenance data and usage of provenance history to evaluate the trustworthiness of facts [14] T2: using annotations for data to encode two facets of information: T3: using trust ontologies that assigns trust values that can be transferred from known to unknown data [31] using: (i) content-based methods (from content or rules) and (ii) metadata-based methods (based on reputation assignments, user ratings, and provenance, rather than the content itself) T4: computing trust values between two entities through a path by using: T5: computing trustworthiness of the information provider by: T6: checking content trust24 Content trust is a trust judgement on a particular piece of information in a given context [20]. T7: assignment of explicit trust ratings to the dataset by humans or analyzing external links or page ranks [45] (Trustworthiness).
In our flight search engine use case, if the flight information is provided by trusted and well-known airlines then a user is more likely to trust the information than when it is provided by an unknown travel agency. Generally information about a product or service (e.g. a flight) can be trusted when it is directly published by the producer or service provider (e.g. the airline). On the other hand, if a user retrieves information from a previously unknown source, she can decide whether to believe this information by checking whether the source is well-known or if it is contained in a list of trusted providers.
Flemming [17] related understandability to the comprehensibility of data i.e. the ease with which human consumers can understand and utilize the data. Thus, comprehensibility can be interchangeably used with understandability. Hogan et al. [30] specified the importance of providing human-readable metadata “for allowing users to visualize, browse and understand RDF data, where providing labels and descriptions establishes a baseline”. Feeney et al. [16] provide a metric for this dimension. Understandability refers to the ease with which data can be comprehended without ambiguity and be used by a human information consumer. The metrics identified for understandability are:
U1: detection of human-readable labelling of classes, properties and entities as well as indication of metadata (e.g. name, description, website) of a dataset [16,17,30] U2: detect whether the pattern of the URIs is provided [17] U3: detect whether a regular expression that matches the URIs is present [17] U4: detect whether examples of SPARQL queries are provided [17] U5: checking whether a list of vocabularies used in the dataset is provided [17] U6: checking the effectiveness and the efficiency of the usage of the mailing list and/or the message boards [17] Let us assume that a user wants to search for flights between Boston and San Francisco using our flight search engine. From the data related to Boston in the integrated dataset for the required flight, the following URIs and a label is retrieved:
“Boston Logan Airport”@en (Understandability).
For the first two items no human-readable label is available, therefore the machine is only able to display the URI as a result of the users query. This does not represent anything meaningful to the user besides perhaps that the information is from Freebase. The third entity, however, contains a human-readable label, which the user can easily understand.
Gamble et al. [19] defined timeliness as “a comparison of the date the annotation was updated with the consumer’s requirement”. The timeliness dimension is motivated by the fact that it is possible to have current data that is actually incompetent because it reflects a state of the real world that is too old for a specific usage. According to the timeliness dimension, data should ideally be recorded and reported as frequently as the source values change and thus never become outdated. Other articles [16,18,27,45,56] provide metrics for assessing timeliness. Measuring currency of arbitrary documents or statements in LD presents several challenges. As shown in a recent study [55], there are different approaches used for representing temporal metadata associated with statements or documents and a scarce availability of these temporal metadata which impact the assessment of currency. In [57] the authors propose a first generic approach for enriching knowledge bases with temporal metadata. Timeliness measures how up-to-date data is relative to a specific task. The metrics identified for timeliness are:
TI1: detecting freshness of datasets based on currency and volatility using the formula:
TI2: detecting freshness of datasets based on their data source by measuring the distance between the last modified time of the data source and last modified time of the dataset [18] Consider a user checking the flight timetable for her flight from city A to city B. Suppose that the result is a list of triples comprising of the description of the resource A such as the connecting airports, the time of departure and arrival, the terminal, the gate, etc. This flight timetable is updated every 10 minutes (volatility). Assume there is a change of the flight departure time, specifically a delay of one hour. However, this information is communicated to the control room with a slight delay. They update this information in the system after 30 minutes. Thus, the timeliness constraint of updating the timetable within 10 minutes is not satisfied which renders the information out-of-date.
The dimensions in this group are related to each other as follows: Data is of high relevance if data is current for the user needs. The timeliness of information thus influences its relevancy. On the other hand, if a dataset has current information, it is considered to be trustworthy. Moreover, to allow users to properly understand information in a dataset, a system should be able to provide sufficient relevant information.
Representational dimensions
Data quality metrics related to representational dimensions (type QN refers to a quantitative metric, QL to a qualitative one)
Data quality metrics related to representational dimensions (type QN refers to a quantitative metric, QL to a qualitative one)
Hogan et al. [29,30] provide benefits of using shorter URI strings for large-scale and/or frequent processing of RDF data thus encouraging the use of concise representation of the data. Moreover, they emphasized that the use of RDF reification should be avoided “as the semantics of reification are unclear and as reified statements are rather cumbersome to query with the SPARQL query language”. Representational-conciseness refers to the representation of the data, which is compact and well formatted on the one hand and clear and complete on the other hand. The metrics identified for representational-conciseness are:
Our flight search engine represents the URIs for the destination compactly with the use of the airport codes. For example, LEJ is the airport code for Leipzig, therefore the URI is (Representational-conciseness).
Hogan et al. [30] state that the re-use of well-known terms to describe resources in a uniform manner increases the interoperability of data published in this manner and contributes towards the interoperability of the entire dataset. The definition of “uniformity”, which refers to the re-use of established formats to represent data as described by Flemming [17], is also associated to the interoperability of the dataset. Interoperability is the degree to which the format and structure of the information conforms to previously returned information as well as data from other sources. The metrics identified for interoperability are:
Let us consider different airline datasets using different notations for representing the geo-coordinates of a particular flight location. While one dataset uses the WGS 84 geodetic system, another one uses the GeoRSS points system to specify the location. This makes querying the integrated dataset difficult, as it requires users and the machines to understand the heterogeneous schema. Additionally, with the difference in the vocabularies used to represent the same concept (in this case the co-ordinates), consumers are faced with the problem of how the data can be interpreted and displayed. (Interoperability).
Hogan et al. [29,30] specify that the ad-hoc definition of classes and properties as well use of blank nodes makes the automatic integration of data less effective and forgoes the possibility of making inferences through reasoning. Thus, these features should be avoided in order to make the data much more interpretable. The other articles [16,17] provide metrics for this dimension. Interpretability refers to technical aspects of the data, that is, whether information is represented using an appropriate notation and whether the machine is able to process the data. The metrics identified for interpretability are:
IN1: identifying objects and terms used to define these objects with globally unique identifiers [16] IN2: detecting the use of appropriate language, symbols, units, datatypes and clear definitions [17] IN3: detection of invalid usage of undefined classes and properties (i.e. those without any formal definition) [29] IN4: detecting the use of blank nodes25 Blank nodes are not recommended since they cannot be externally referenced. (Interpretability).
Consider our flight search engine and a user that is looking for a flight from
Flemming [17] defined versatility as the “alternative representations of the data and its handling.” Versatility refers to the availability of the data in different representations and in an internationalized way. The metrics identified for versatility are:
Consider a user who does not understand English but only Chinese and wants to use our flight search engine. In order to cater to the needs of such a user, the dataset should provide labels and other language-dependent information in Chinese so that any user has the capability to understand it. (Versatility).
The dimensions in this group are related as follows: Interpretability is related to the interoperability of data since the consistent representation (e.g. re-use of established vocabularies) ensures that a system will be able to interpret the data correctly [15]. Versatility is also related to the interpretability of a dataset as the more different forms a dataset is represented in (e.g. in different languages), the more interpretable a dataset is. Additionally, concise representation of the data allows the data to be interpreted correctly.
Inter-relationships between dimensions
The 18 data quality dimensions explained in the previous sections are not independent from each other but correlations exist among them. In this section, we describe the inter-relations between the 18 dimensions, as shown in Fig. 2. If some dimensions are considered more important than others for a specific application (or use case), then favouring the more important ones will result in downplaying the influence of others. The inter-relationships help to identify which dimensions should possibly be considered together in a certain quality assessment application. Hence, investigating the relationships among dimensions is an interesting problem, as shown by the following examples.
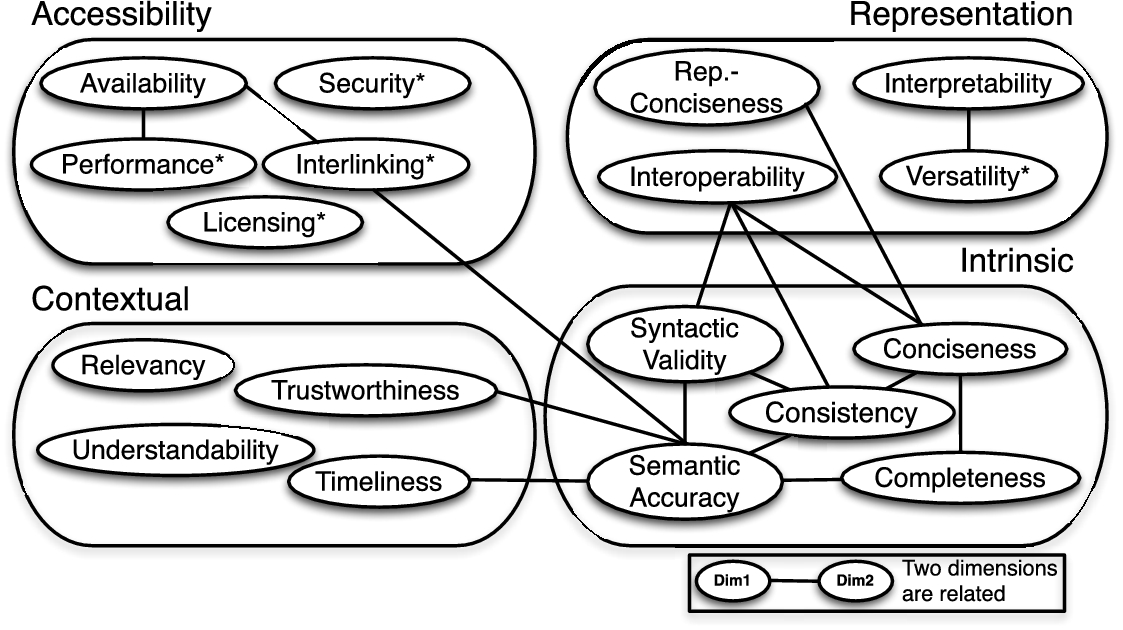
Linked Data quality dimensions and the relations between them. The dimensions marked with ‘*’ are specific for Linked Data.
First, relationships exist between the dimensions trustworthiness, semantic accuracy and timeliness. When assessing the trustworthiness of a LD dataset, the semantic accuracy and the timeliness of the dataset should be assessed. Frequently the assumption is made that a publisher with a high reputation will produce data that is also semantically accurate and current, when in reality this may not be so.
Second, relationships occur between timeliness and the semantic accuracy, completeness and consistency dimensions. On the one hand, having semantically accurate, complete or consistent data may require time and thus timeliness can be negatively affected. Conversely, having timely data may cause low accuracy, incompleteness and/or inconsistency. Based on quality preferences given by an application, a possible order of quality can be as follows: timely, consistent, accurate and then complete data. For instance, a list of courses published on a university website might be first of all timely, secondly consistent and accurate, and finally complete. Conversely, when considering an e-banking application, first of all it is preferred that data is accurate, consistent and complete as stringent requirements and only afterwards timely since delays are allowed in favour of correctness of data provided.
The representational-conciseness dimension (belonging to the representational group) and the conciseness dimension (belonging to the intrinsic group) are also closely related with each other. On the one hand, representational-conciseness refers to the conciseness of representing the data (e.g. short URIs) while conciseness refers to the compactness of the data itself (no redundant attributes and objects). Both dimensions thus point towards the compactness of the data. Moreover, representational-conciseness not only allows users to understand the data better but also provides efficient processing of frequently used RDF data (thus affecting performance). On the other hand, Hogan et al. [30] associated performance to the issue of “using prolix RDF features” such as (i) reification, (ii) containers and (iii) collections. These features should be avoided as they are cumbersome to represent in triples and can prove to be expensive to support in data intensive environments.
Additionally, the interoperability dimension (belonging to the representational group) is inter-related with the consistency dimension (belonging to the intrinsic group), because the invalid re-usage of vocabularies (mandated by the interoperability dimension) may lead to inconsistency in the data. The versatility dimension, also part of the representational group, is related to the accessibility dimension since provision of data via different means (e.g. SPARQL endpoint, RDF dump) inadvertently points towards the different ways in which data can be accessed. Additionally, versatility (e.g. providing data in different languages) allows a user to understand the information better, thus also relates to the understandability dimension. Furthermore, there exists an inter-relation between the conciseness and the relevancy dimensions. Conciseness frequently positively affects relevancy since removing redundancies increases the proportion of relevant data that can be retrieved.
The interlinking dimension is associated with the semantic accuracy dimension. It is important to choose the correct similarity relationship such as same, matches, similar or related between two entities to capture the most appropriate relationship [25] thus contributing towards the semantic accuracy of the data. Additionally, interlinking is directly related to the interlinking completeness dimension. However, the interlinking dimension focuses on the quality of the interlinks whereas the interlinking completeness focus on the presence of all relevant interlinks in a dataset.
These sets of non-exhaustive examples of inter-relations between the dimensions belonging to different groups indicates the interplay between them and show that these dimensions are to be considered differently in different data quality assessment scenarios.
In this section, we compare the 30 selected approaches based on the different perspectives discussed in Section 2. In particular, we analyze each approach based on (i) the dimensions (Section 5.1), (ii) their respective metrics (Section 5.2), (iii) types of data (Section 5.3), and (iv) compare the proposed tools based on several attributes (Section 5.4).
Dimensions
Linked Data touches upon three different research and technology areas, namely the Semantic Web to generate semantic connections among datasets, the World Wide Web to make the data available, preferably under an open access license, and Data Management for handling large quantities of heterogeneous and distributed data. Previously published literature provides a thorough classification of the data quality dimensions [11,32,49,52,61,63]. By analyzing these classifications, it is possible to distill a core set of dimensions, namely accuracy, completeness, consistency and timeliness. These four dimensions constitute the focus of most authors [58]. However, no consensus exists which set of dimensions defines data quality as a whole or the exact meaning of each dimension, which is also a problem occurring in LD.
As mentioned in Section 3, data quality assessment involves the measurement of data quality dimensions that are relevant for the user. We therefore gathered all data quality dimensions that have been reported as being relevant for LD by analyzing the 30 selected approaches. An initial list of data quality dimensions was obtained from [6]. Thereafter, the problem addressed by each approach was extracted and mapped to one or more of the quality dimensions. For example, the problems of dereferenceability, the non-availability of structured data and misreporting content types as mentioned in [30] were mapped to the availability dimension.
Occurrences of the 18 data quality dimensions in each of the included approaches
Occurrences of the 18 data quality dimensions in each of the included approaches
Table 6 shows the complete list of 18 LD quality dimensions along with their respective occurrence in the included approaches. This table can be intuitively divided into the following three groups: (i) a set of approaches focusing only on trust [10,14,19–23,26,31,59]; (ii) a set of approaches covering more than four dimensions [7,16–18,29,30,36,45,65] and (iii) a set of approaches focusing on very few and specific dimensions [1,9,13,24,29,41,48,50,53,56,64].
Overall, it is observed that the dimensions trustworthiness, consistency, completeness, syntactic validity, semantic accuracy and availability are the most frequently used. Additionally, the categories intrinsic, contextual, accessibility and representational groups rank in descending order of importance based on the frequency of occurrence of dimensions. Finally, we can conclude that none of the approaches cover all the data quality dimensions.
As defined in Section 3, a data quality metric is a procedure for measuring an information quality dimension. We notice that most of the metrics take the form of a ratio, which measures the occurrence of observed entities out of the occurrence of the desired entities, where by entities we mean properties or classes [41]. For example, for the interoperability dimension, the metric for determining the re-use of existing vocabularies takes the form of the ratio:
For some of the surveyed articles, the problem, its corresponding metric and a dimension were clearly mentioned [7,17]. However, for other articles, we first extracted the problem addressed along with the way in which it was assessed (i.e. the metric). Thereafter, we mapped each problem and the corresponding metric to a relevant data quality dimension. For example, the problem related to keeping URIs short (identified in [30]) measured by the presence of long URIs or those containing query parameters, was mapped to the representational-conciseness dimension. On the other hand, the problem related to the re-use of existing terms (also identified in [30]) was mapped to the interoperability dimension.
Additionally, we classified the metrics as being either quantitatively (QN) or qualitatively (QL) assessable. Quantitative metrics are those for which a concrete value (score) can be calculated. For example, for the completeness dimension, the metrics such as schema completeness or property completeness are quantitatively measured. The ratio form of the metrics is generally applied to those metrics, which can be measured objectively (quantitatively). Qualitative metrics are those which cannot be quantified but depend on the users perception of the respective metric (e.g. via surveys). For example, metrics belonging to the trustworthiness dimension, detection of the trustworthiness of a publisher or a data source can be measured subjectively.
It is worth noting that for a particular dimension there are several metrics associated with it but each metric is only associated with one dimension. Additionally, there are several ways of measuring one dimension either individually or by combining different metrics.
Type of data
The goal of a data quality assessment activity is the analysis of data in order to measure the quality of datasets along relevant quality dimensions. Therefore, the assessment involves the comparison between the obtained measurements and the references values, in order to enable a diagnosis of quality. The assessment considers different types of data that describe real-world objects in a format that can be stored, retrieved, and processed by a software procedure and communicated through a network.
Thus, in this section, we distinguish between the types of data considered in the various approaches in order to obtain an overview of how the assessment of LD operates on such different levels. The assessment is associated with small-scale units of data such as assessment of RDF triples to the assessment of entire datasets, which potentially affect the whole assessment process.
In LD, we distinguish the assessment process operating on three types of data:
RDF triples, which focus on individual triple assessment.
RDF graphs, which focus on entities assessment (where entities are described by a collection of RDF triples [28]).
Datasets, which focus on dataset assessment where a dataset is considered as a set of default and named graphs.
Qualitative evaluation of the 30 core frameworks included in this survey
Qualitative evaluation of the 30 core frameworks included in this survey
Qualitative evaluation of the 30 core frameworks included in this survey (continued)
Comparison of quality assessment tools according to several attributes
In most cases, if the assessment is provided at the triple level, this assessment can usually be propagated at a higher level such as the graph or dataset level. For example, in order to assess the rating of a single source, the overall rating of the statements associated to the source can be used [21].
On the other hand, if the assessment is performed at the graph level, it is further propagated either to a more fine-grained level, that is, the RDF triple level or to a more generic one, that is, the dataset level. For example, the evaluation of trust of a data source (graph level) is propagated to the statements (triple level) that are part of the Web source associated with that trust rating [59]. However, there are no approaches that perform an assessment only at the dataset level (see Table 7). A reason is that the assessment of a dataset always involves the assessment of a fine-grained level (such as triple or entity level) and this assessment is then propagated to the dataset level.
Out of the 30 core articles, 12 provide tools (see Table 7). Hogan et al. [29] only provide a service for validating RDF/XML documents, thus we do not consider it in this comparison. In this section, we compare these 12 tools based on eight different attributes (see Table 8).
Accessibility/Availability. In Table 8, only the tools marked with a ✔ are available to be used for quality assessment. The URL for accessing each tool is available in Table 7. The other tools are either available26
We consider all tools with a working link, through which the tool can either be used, downloaded or viewed as a demo to be accessible.
Licensing. Most of the tools are available using a particular software license, which specifies the restrictions with which they can be redistributed. The Trellis and LinkQA tools are open-source and as such by default they are protected by copyright, which is All Rights Reserved. Also, WIQA, Sieve, RDFUnit and TripleCheckMate are all available with open-source license: the Apache Version 2.027
Automation. The automation of a system is the ability to automatically perform its intended tasks thereby reducing the need for human intervention. In this context, we classify the 12 tools into semi-automated and automated approaches. As seen in Table 8, all the tools are semi-automated except for LinkQA, which is completely automated, as there is no user involvement. LinkQA automatically selects a set of resources, information from the Web of Data (i.e. SPARQL endpoints and/or dereferenceable resources) and a set of triples as input and generates the respective quality assessment reports.
On the other hand, the WIQA, Sieve and RDFUnit require a high degree of user involvement. Specifically in Sieve, the definition of metrics has to be done by creating an XML file, which contains specific configurations for a quality assessment task. In case of RDFUnit, the user has to define SPARQL queries as constraints based on SPARQL query templates, which are instantiated into concrete quality test queries. Although it gives the users the flexibility of tweaking the tool to match their needs, it requires much time for understanding the required XML file structure and specification as well as the SPARQL language.
The other semi-automated tools, Trellis, TrurstBot, tSPARQL, ProLOD, Flemming’s tool, DaCura, TripleCheckMate and LiQuate require a minimum amount of user involvement. TripleCheckMate provides evaluators with triples from each resource and they are required to mark the triples, which are incorrect as well as map it to one of the pre-defined quality problem. Even though the user involvement here is higher than the other tools, the user-friendly interface allows a user to evaluate the triples and map them to corresponding problems efficiently.
For example, Flemming’s Data Quality Assessment Tool requires the user to answer a few questions regarding the dataset (e.g. existence of a human-readable license) or they have to assign weights to each of the pre-defined data quality metrics via a form-based interface.
Collaboration. Collaboration is the ability of a system to support co-operation between different users of the system. From all the tools, Trellis, DaCura and TripleCheckMate support collaboration between different users of the tool. The Trellis user interface allows several users to express their trust value for a data source. The tool allows the users to add and store their observations and conclusions. Decisions made by users on a particular source are stored as annotations, which can be used to analyze conflicting information or handle incomplete information.
In case of DaCura, the data-architect, domain expert, data harvester and consumer collaborate together to maintain a high-quality dataset. TripleCheckMate, allows multiple users to assess the same Linked Data resource and therefore allowing to calculate the inter-rater agreement to attain a final quality judgement.
Customizability. Customizability is the ability of a system to be configured according to the users’ needs and preferences. In this case, we measure the customizability of a tool based on whether the tool can be used with any dataset that the user is interested in. Only LinkQA and LiQuate cannot be customized since the user cannot add any dataset of her choice. The other ten tools can be customized according to the use case. For example, in TrustBot, which is an IRC bot that makes trust recommendations to users (based on the trust network it builds), the users have the flexibility to submit their own URIs to the bot at any time while incorporating the data into a graph. Similarly, Trellis, tSPARQL, WIQA, ProLOD, Flemming’s tool, Sieve, RDFUnit, DaCura and TripleCheckmate can be used with any dataset.
Scalability. Scalability is the ability of a system, network, or process to handle a growing amount of work or its ability to be enlarged to accommodate that growth. Out of the 12 tools only five, the tSPARQL, LinkQA, Sieve, RDFUnit and TripleCheckMate tools are scalable, that is, they can be used with large datasets. Flemming’s tool and TrustBot are reportedly not scalable for large datasets [17,23]. Flemming’s tool, on the one hand, performs analysis based on a sample of three entities whereas TrustBot takes as input two email addresses to calculate the weighted average trust value. Trellis, WIQA, ProLOD, DaCura and LiQuate do not provide any information on the scalability.
Usability/documentation. Usability is the ease of use and learnability of a human-made object, in this case the quality assessment tool. We assess the usability of the tools based on the ease of use as well as the complete and precise documentation available for each of them thus enabling users to find help easily. We score them based on a scale from 1 (low usability) to 5 (high usability). TripleCheckMate is the easiest tool with a user-friendly interface and a screencast explaining its usage. Thereafter, TrustBot, tSPARQL and Sieve score high in terms of usability and documentation followed by Flemming’s tool and RDFUnit. Trellis, WIQA, ProLOD and LinkQA rank lower in terms of ease of use since they do not contain useful documentation of how to use the tool. DaCura and LiQuate do not provide any documentation except for a description in the paper.
Maintenance/last updated. With regards to the current status of the tools, while TrustBot, Trellis and WIQA have not been updated since they were first introduced in 2003, 2005 and 2006 respectively, ProLOD and Flemming’s tool have been updated in 2010. The recently updated tools are LinkQA (2011), tSRARQL and Sieve (2012), DaCura, TripleCheckMate, LiQuate (2013) and RDFUnit (2014) are currently being maintained.
In this paper, we have presented, to the best of our knowledge, the most comprehensive systematic review of data quality assessment methodologies applied to LD. The goal of this survey is to obtain a clear understanding of the differences between such approaches, in particular in terms of quality dimensions, metrics, type of data and tools available.
We surveyed 30 approaches and extracted 18 data quality dimensions along with their definitions and corresponding 69 metrics. We also classified the metrics into either being quantitatively or qualitatively assessed. We analyzed the approaches in terms of the dimensions, metrics and type of data they focus on. Additionally, we identified tools proposed by 12 (out of the 30) and compared them using eight different attributes.
We observed that most of the publications focusing on data quality assessment in Linked Data are presented at either conferences or workshops. As our literature review reveals, this research area is still in its infancy and can benefit from the possible re-use of research from mature, related domains. Additionally, in most of the surveyed literature, the metrics were often not explicitly defined or did not consist of precise statistical measures. Moreover, only few approaches were actually accompanied by an implemented tool. Also, there was no formal validation of the methodologies that were implemented as tools. We also observed that none of the existing implemented tools covered all the data quality dimensions. In fact, the best coverage in terms of dimensions was achieved by Flemming’s data quality assessment tool with 11 covered dimensions.
Our survey shows that the flexibility of the tools, with regard to the level of automation and user involvement, needs to be improved. Some tools required a considerable amount of configuration while some others were easy-to-use but provided results with limited usefulness or required a high-level of interpretation.
Meanwhile, there is much research on data quality being done and guidelines as well as recommendations on how to publish “good” data are currently available. However, there is less focus on how to use this “good” data. Moreover, the quality of datasets should be assessed and an effort to increase the quality aspects that are amiss should be performed thereafter. We deem our data quality dimensions to be very useful for data consumers in order to assess the quality of datasets. As a consequence, query answering can be increased in effectiveness and efficiency using data quality criteria [49]. As a next step, we have started to integrate the various data quality dimensions into a comprehensive methodological framework [54] for data quality assessment comprising the following steps:
Requirements analysis, Data quality checklist, Statistics and low-level analysis, Aggregated and higher level metrics, Comparison, Interpretation.
We aim to further develop this framework for data quality assessment allowing a data consumer to select and assess the quality of suitable datasets according to this methodology. In the process, we also expect new metrics to be defined and implemented.