
Abstract
Large amounts of geo-spatial information have been made available with the growth of the Web of Data. While discovering links between resources on the Web of Data has been shown to be a demanding task, discovering links between geo-spatial resources proves to be even more challenging. This is partly due to the resources being described by the means of vector geometry. Especially, discrepancies in granularity and error measurements across data sets render the selection of appropriate distance measures for geo-spatial resources difficult. In this paper, we survey existing literature for point-set measures that can be used to measure the similarity of vector geometries. We then present and evaluate the ten measures that we derived from literature. We evaluate these measures with respect to their time-efficiency and their robustness against discrepancies in measurement and in granularity. To this end, we use samples of real data sets of different granularity as input for our evaluation framework. The results obtained on three different data sets suggest that most distance approaches can be led to scale. Moreover, while some distance measures are significantly slower than other measures, distance measure based on means, surjections and sums of minimal distances are robust against the different types of discrepancies.
Introduction
The Web of Data has grown significantly over the last years. In particular, very large data sets pertaining to different domains such as bio-medicine (e.g., LinkedTCGA with now 20+ billion triples [40]) and geo-locations (e.g., LinkedGeoData with approximately 30 billion triples [4]) have been made available. Implementing the fourth Linked Data principle (i.e., the creation of links between these knowledge bases and other knowledge bases) for these knowledge bases has been shown to be a difficult problem in previous works [5]. Most of the existing solutions (see [29] for an overview) address this problem by using a complex similarity or distance function to compare instances from two (not necessarily distinct) knowledge bases. The result of the function is then compared to a threshold. The result of the comparison is finally used to suggest the existence of a link between instances.
While previous works have compared a large number of measures with respect to how well they perform in the link discovery task [12], measures for linking geo-spatial resources have been paid little attention to. Previous works have yet shown that domain-specific measures and algorithms are required to tackle the problem of geo-spatial link discovery [31]. For example, 20,354 pairs of cities in DBpedia 2014 share exactly the same label. For villages in LinkedGeoData 2014, this number grows to 3,946,750. Consequently, finding links between geo-spatial resources requires devising means to distinguish them using their geo-spatial location. On the Web of Data, the geo-spatial location of resources is most commonly described using either points or more generally by means of vector geometry. Thus, devising means for using geo-spatial information to improve link discovery requires providing means to measure distances between such vector geometry data.
Examples of vector geometry descriptions for the country of Malta are shown in Fig. 1. As displayed in the examples, two types of discrepancies occur when one compares the vector descriptions of the same real-world entity (e.g., Malta) in different data sets: First, the different vector descriptions of a given real-world entity often comprise different points across different data sets. For example, Malta’s vector description in DBpedia contains the point with latitude 14.46 and longitude 35.89. In LinkedGeoData, the same country is described by the point of latitude 14.5 and longitude 35.9. We dub the discrepancy in latitude and longitude for points in the vector description measurement discrepancy. A second type of discrepancy that occurs in the vector description of geo-spatial resources across different data sets are discrepancies in granularity. For example, Malta is described by one polygon in DBpedia, two polygons in NUTS and a single point in LinkedGeoData.

Vector description of the country of Malta. The blue polygons shows the vector geometry for Malta in the NUTS data set, the red polygon shows the same for the DBpedia, while the black point shows the location of the same real-world entity according to LinkedGeoData.
Analysing the behaviour of different measures with respect to these two types of discrepancies is of central importance to detect the measures that should be used for geo-spatial link discovery. In this paper, we address this research gap by first surveying existing measures that can be used for comparing point sets. We then compare these measures in series of experiments on samples extracted from three real data sets with the aim of answering the questions introduced in Section 3.
Note that throughout the paper, we model complex representations of geo-spatial objects as point sets. While more complex representations can be chosen, comparing all corresponding measures would go beyond the scope of this paper. In addition, we are only concerned with atomic measures and do not consider combinations of measures. Approaches that allow combining measures can be found in [29].
The remainder of this paper is structured as follows: Section 2 introduces some basic assumption and notations that will be used all over the rest of the paper. Section 3 introduces our systematic survey methodology. Then, in Section 4 we give a detailed description of each of point set distance functions, as well as their mathematical formulation and different implementations. Thereafter, in Section 5 we introduce evaluation of our work for both scalability and robustness. Finally, we conclude the paper with a brief overview of related work (Section 6), as well as a conclusion and future work (Section 7). All measures and algorithms presented herein were integrated into the LIMES framework.1
We assume the link discovery (LD) problem as being formulated in a way akin to [31]: Given two sets S and T of resources as well as a predicate p, compute the set
In addition to bearing properties similar to those bared by other types of resources (label, country, etc.), geo-spatial resources are commonly described by means of vector geometry.2
Most commonly encoded in the WKT format, see
Here, we assume the planet to be a perfect sphere.
Alternatively, the distance between two points
Computing the distance between sets of points is yet a more difficult endeavor. Over the last years, several measures have been developed to achieve this task. Most of these approaches regard vector descriptions as ordered set of points. In the following sections, we present such measures and evaluate their robustness against different types of discrepancies.
We carried out a systematic study of the literature on distance measures for point sets according to the approach presented in [24,28]. In the following, we present our survey approach in more detail.
Research question formulation
We began by defining research questions that guided our search for measures. These questions were as follows:
Which of the existing measures is the most time-efficient measure? Which measure generates mappings with a high precision, recall, or F-measure? How well do the measures perform when the data sets have different granularities? How sensitive are the measures to measurement discrepancies? How robust are the measures when both types of discrepancy occur?
Eligibility criteria
To direct our search process towards answering our research questions, we created two lists of inclusion/exclusion criteria for papers. Papers had to abide by all inclusion criteria and by none of the exclusion criteria to be part of our survey:
Inclusion Criteria Work published in English between 2003 and 2013. Studies on geographic terms based link discovery. Algorithms for finding distance between point sets. Techniques for improving performance of some well-known point sets distance Algorithms. Exclusion Criteria Work that were not peer-reviewed or published. Work that were published as a poster abstract. Distance functions that focused on finding distances only between convex point sets.
Search strategy
Based on the research question and the eligibility criteria, we defined a set of most related keywords. There were as follows: Linked Data, link discovery, record linkage, polygon, point set, distance, metric, geographic, spatial, non-convex. We used those keywords as follows:
Linked Data AND (Link discovery OR record linkage) AND (geographic OR spatial)
Non-convex AND (polygon OR point set) AND (distance OR metric)
A keyword search was applied in the following list of search engines, digital libraries, journals, conferences and their respective workshops:
Search Engines and digital libraries: Google Scholar4
ACM Digital Library5
Springer Link6
Science Direct7
ISI Web of Science8
Journals:
In order to conduct our systematic literature review, we applied a six-phase search methodology:
Apply keywords to the search engine using the time frame from 2003–2013. Scan article titles based on inclusion/exclusion criteria. Import output from phase 2 to a reference manager software to remove duplicates. Here, we used Mendeley12
Review abstracts according to include/exclude criteria.
Read through the papers, looking for some approaches that fits the inclusion criteria and exclude papers that fits the exclusion criteria. Also, retrieve and analyze related papers from references.
Implement point sets distance functions found in phase 5.
Number of retrieved articles during each of the search methodology phases
In the following, we present each of the distance measures derived from our systematic survey and exemplify it by using the DBpedia and NUTS descriptions of Malta presented in Fig. 1. The input for the distance measures consists of two point sets
Mean distance function
The mean distance is one of the most efficient distance measures for point sets [16]. First, a mean point is computed for each point set. Then, the distance between the two means is computed by using the orthodromic distance. Formally:
Max distance function
The idea behind this measure is to compute the overall maximal distance between points
Min distance function
The main idea of the Min is akin to that of Max and is formally defined as
Average distance function
For computing the average point sets distance function, the orthodromic distance measures between all the source-target points pairs is cumulated and divided by the number of point source-target point pairs:
Sum of minimums distance function
This distance function was first proposed by [33] and is computed as follows: First, the closest point
Going back again to our example, the sum of minimum distances from each of DBpedia points describing Malta to the ones of NUTS is
Surjection distance function
The surjection distance function introduced by [37] defines the distance between two point sets as follows: The minimum distance between the sum of distances of the surjection of the larger set to the smaller one. Formally, the Surjection distance is defined as:
Fair surjection distance function
In order to fix the bias of the surjection distance function, [37] introduces an extension of the surjection function which is dubbed fair surjection. The surjection between sets S and t is said to be fair if
Link distance function
The link distance introduced by [17] defines distance between two point sets s and t as a relation For all For all
Formally, The minimum link distance between two point sets s and t is defined by
Hausdorff distance function
The Hausdorff distance is a measure of the maximum of the minimum distances between two sets of points. Hausdorff is one of the commonly used approach for determining the similarity between point sets [22]. Formally, the Hausdorff distance is defined as
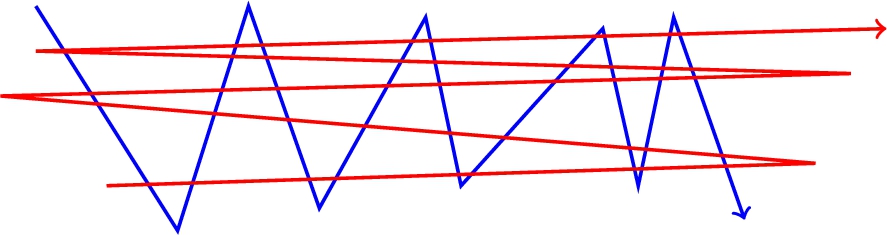
Fréchet vs other distance approaches.
Most of the distance measures presented before have a considerable common disadvantage. Consider the two curves shown in Fig. 2, Any point on one of the curves has a nearby point on the other curve. Therefore, many of the measures presented so far (incl. Hausdorff, min, sum of mins) return a low distance. However, these curves are intuitively quite dissimilar: While they are close on a point-wise basis, they are not so close if we try to map the curves continuously to each other. A distance measure that captures this intuition is the Fréchet [19] distance.
The basic idea behind the Fréchet distance is encapsulated in the following example:13
Adapted from [1].
In order to drive a formal definition of Fréchet distance, First we define A curve as a continuous mapping
Overall, the distance measures presented above return partly very different values ranging from
The goal of our evaluation was to answer the five questions mentioned in Section 3.1. To this end, we devised four series of experiments. First, we evaluated the use of different point-to-point geographical distance formulas together with the point set distance introduced in Section 4. Next, we evaluated the scalability of the ten measures with growing data set sizes. Then, we measured the robustness of these measures against measurement and granularity discrepancies as well as combinations of both. Finally, we measured the scalability of the measures when combined with the
Experimental setup
In this section, we describe the experimental setup used throughout our experiments. We focus on datasets of geo-spatial regions for all experiments as they were the major motivation behind this study. Other experiments with varying object densities (e.g., buildings) go beyond the scope of this paper.
Datasets
We used three publicly available data sets for our experiments. The first data set, NUTS14
Version 0.91 available at
We used version 3.8 as available at
We used the RelevantWays data set (version of April 26th, 2011) of LinkedGeoData as available at
To the best of our knowledge, there is no gold standard benchmark geographic data set that can be used to evaluate the robustness of geo-spatial distance measures. We thus adapted the benchmark generation approach proposed by [18] to geo-spatial distance measures. In order to generate our benchmark data sets, we implemented two modifiers dubbed as granularity and measurement error. The implemented geo-spatial modifiers are analogous with the data sets generation algorithms from the field cartographic generalisation [25]. The granularity modifier implements the most commonly used simplification operator [27], while the measurement error modifier is akin with the displacement operator [32]. Both modifiers take a point set s and a threshold as input and return a point set
The granularity modifier
The measurement error modifier
To measure how well each of the distance measures performed w.r.t. to the modifiers, we first created a reference mapping
Comparison of the orthodromic and great elliptic distances using 200 randomly selected resources from each data set, where precision (P), recall (R), F-measure (F) and run time (T) are presented. Note that all run times are in milliseconds
Comparison of the orthodromic and great elliptic distances using 200 randomly selected resources from each data set, where precision (P), recall (R), F-measure (F) and run time (T) are presented. Note that all run times are in milliseconds
All experiments were carried out on a server running OpenJDK 64-Bit Server 1.6.0_27 on Ubuntu 14.04.2 LTS. The processors were 64-core AuthenticAMD clocked at 2.3 GHz. Unless stated otherwise, each experiment was assigned 8 GB of memory and was ran 5 times.
Point-to-point geographic distance evaluation
To evaluate the effect of the basic point-to-point geographic distance

Scalability evaluation on the NUTS data set.
The results (see Table 2) show that both the orthodromic and elliptic curve distances achieved the same precision, recall and F-measure when applied to the same resources. Moreover, the elliptic distance (in average) was 3.9 times slower than the orthodromic distance. Given that the great elliptic curve distance is known to be more accurate than the orthodromic distance [13], these observations emphasise that (1) the distance error of the orthodromic distance did not affect the link discovery results and that (2) the orthodromic distance has a lower time complexity than the great elliptic distance. Therefore, we rely on the orthodromic distance throughout the rest of experiments in this paper.
It is important to notice that the setting mentioned above could also be used with planar spaces. To this end, one would only have to replace the Orthodromic distance with the Euclidean distance. One could also consider computing the point-to-point geographic distance
To quantify how well the measures scale, we measured the runtime of the measures on fragments of growing size of each of the input data sets. This experiment emulates a naive deduplication on data sets of various sizes. The results achieved on NUTS are shown in Fig. 3. We chose to show NUTS because it is the smallest and most fine-granular of our data sets. Thus, the measures achieved here represent an upper bound for the runtime behaviour of the different approaches.

Comparison of different point set distance measures against granularity discrepancies.
We carried out three types of evaluations to measure the robustness of the measures at hand. First, we measured their robustness against discrepancies in granularity. Then, we measured their robustness against measurement discrepancies. Finally, we combined discrepancies in measurement and granularity and evaluated all our measures against these. We chose to show only a portion of our results for the sake of space. All results can be found at
Robustness against discrepancies in granularity
We measured the effect of changes in granularity on the measures at hand by using the five granularity thresholds 1,
The answer to
Robustness against measurement discrepancies
The evaluation of the robustness of the measures at hand against discrepancies in measurement are shown in Fig. 5. Interestingly, the results differ across the different data sets. On the NUTS data, where the regions are described with high granularity, five of the measures (mean, fair surjection, link, sum of mins and surjection) perform well. On LinkedGeoData, the number of points pro resources is considerably smaller. Moreover, the resources are partly far from each other. Here, the Hausdorff distance is the poorest while max and mean perform comparably well. Finally, on the DBpedia data set, all measures apart from Fréchet are comparable. Our results thus suggest that the answer to

Comparison of different point set distance measures against measurement discrepancies.

Comparison of different point set distance measures against granularity and measurement discrepancies.
We emulated the differences across various real geographic data sets by combining the granularity and the measurement modifiers. Given a data set S, we generated a modified data set

Scalability evaluation with
Overall, our results suggest that the following answer to
We aimed to know how far the runtime of measures such as mean, surjection and sum of mins can be reduced so as to ensure that these measures can be used on large data sets. We thus combined these measures with the
We used the default settings of the implementation provided in the LIMES framework and the distance threshold of
Overall, we can conclude that all measures apart from the Fréchet distance are amenable to being used for link discovery. While mean performs best overall, surjection-based and minimum-based measures are good candidates to use if mean returns unsatisfactory results. The Fréchet distance on the other hand seems inadequate for link discovery. This can yet be due to the point set approach chosen in this paper. An analysis of the Fréchet distance on the description of resources as polygons remains future work. Note that the high Fréchet distances computed when minor discrepancies between representations of geo-spatial objects occurred can be of importance when carrying out other tasks such as analyzing the quality of RDF datasets.
Experiment on real datasets
We were interested in knowing whether the mean function performs well on real data. Validating link discovery results on geo-spatial data is difficult due to the lack of reference data sets. We thus measured the increase in precision and recall achieved by using geo-spatial information by sampling 100 links from the results of real link discovery tasks and evaluating these links manually. The links were evaluated by the authors who reached an agreement of 100%.
In the first experiment, we computed links between cities in DBpedia and LinkedGeoData by comparing solely their labels by means of an exact match string similarity. No geo-spatial similarity metric was used, leading to cities being linked if they have exactly the same name. Overall only 74% of the links in our sample were correct. The remaining 26% differed in country or even continent. We can assume that a recall of 1 would be achieved by using this approach as a particular city will most probably have the same name across different geo-spatial data sets. Thus, in the best case, linking geo-spatial resources in DBpedia to LinkedGeoData would only lead to an F-measure of 0.85.
In our second experiment, we extended the specification described above by linking two cities if their names were exact matches (which was used in the first experiment) and the mean distance function between their geometry representation returned a value under 100 km. In our sample, we achieved a perfect accuracy and thus an F-measure of 1. While this experiment is small, it clearly demonstrates the importance of using geo-spatial information for linking geo-spatial resources. Moreover, it suggest that the mean distance is indeed reliable on real data. More experiments yet need to be carried out to ensure that the empirical results we got in this experiment are not just a mere artifact in the data. We will achieve this goal by creating a benchmark for geo-spatial link discovery in future work.
Related work
This paper is related to distance measures for point sets and link discovery. Several reviews on distance measures for point sets have been published. For example, [17] reviews some of the distance functions proposed in the literature presents efficient algorithms for the computation of these measures. Also, [3] presents parallel implementation of some distance functions between convex and non-convex (possibly intersecting) polygons.
Ramon et al. [39] introduce a metric computable in polynomial time for measuring the similarity between sets of points, while [45] presents an approach to compute the similarity between multiple polylines and a polygon using dynamic programming. Barequet et al. [6] show how to compute the respective nearest- and furthest-site Voronoi diagrams of point sites in the plane, [7] provides near-optimal deterministic time algorithms to compute the corresponding nearest- and furthest-site Voronoi diagrams of point sites.
Hausdorff distances are commonly used in fields such as object modelling, computer vision and object tracking. [2] focuses on the Hausdorff distance and presents an approach for its efficient computation between convex polygons. While the approach is quasi-linear in the number of nodes of the polygons, it cannot deal with non-convex polygons as commonly found in geographic data. [46] presents a similar approach that allows approximating Hausdorff distances within a certain error bound, while [8] presents an exact approach. [36] proposes an approach to compute Hausdorff distances between trajectories using R-trees within an
Fréchet distance is basically used in piecewise curve similarity detection like in case of hand writing recognition. For example, [1] introduces an algorithm for computing Fréchet distance between two polygonal curves, while [11] presents a polynomial-time algorithm to compute the homotopic Fréchet distance between two given polygonal curves in the plane avoiding a given set of polygonal obstacles. [15] provides an approximation of Fréchet distance for realistic curves in near linear time. Dealing with non-flat surfaces, [14] presented three different methods to adapt the original Fréche distance in non-flat surfaces.
There are number of techniques presented in literature that -if applied in combination with the presented distance approaches- can achieve better performance. In order to limit the number of polygons to be compared in deduplication problems, [23] proposed a dissimilarity function for clustering geospatial polygons. A kinematics-based method proposed in [41] approximates large polygon using less number of points is proposed, thus requires less execution time for distance measurement. Yet, another algorithm presented by [38] models non-convex polygons as the union of a set of convex components, the algorithm construct a hierarchical bounding representation based on spheres. [21] shows an approach for the comparison of 3D models represented as triangular meshes. The approach is based on a subdivision sampling algorithm that makes used of octrees to approximate distances.
The problem of time-efficient LD has been addressed by several frameworks such as
Conclusion and future work
In this paper, we presented an evaluation of point set distance measures for link discovery on geo-spatial resources. We evaluated these distances on sample from three different data sets. Our results suggest that while different measures perform best on the data sets we used, the mean distance measure is the most time-efficient and overall best measure to use for link discovery. We also showed that all measures apart from the Fréchet distance can scale even on large data sets when combine with an approach such as
Footnotes
Acknowledgements
This work has been supported by H2020 projects SLIPO (GA no. 731581) and HOBBIT (GA no. 688227) as well as the DFG project LinkingLOD (project no. NG 105/3-2), the eurostars project SAGE (GA no. E!10882) and the BMWI Project GEISER (project no. 01MD16014E).