
Abstract
There is a large number of datasets published as Linked (Open) Data (LOD/LD). At the same time, there is also a multitude of tools for publication of LD. However, potential LD consumers still have difficulty discovering, accessing and exploiting LD. This is because compared to consumption of traditional data formats such as XML and CSV files, there is a distinct lack of tools for consumption of LD. The promoters of LD use the well-known 5-star Open Data deployment scheme to suggest that consumption of LD is a better experience once the consumer knows RDF and related technologies. This suggestion, however, falls short when the consumers search for an appropriate tooling support for LD consumption. In this paper we define a LD consumption process. Based on this process and current literature, we define a set of 34 requirements a hypothetical Linked Data Consumption Platform (LDCP) should ideally fulfill. We cover those requirements with a set of 94 evaluation criteria. We survey 110 tools identified as potential candidates for an LDCP, eliminating them in 3 rounds until 16 candidates for remain. We evaluate the 16 candidates using our 94 criteria. Based on this evaluation we show which parts of the LD consumption process are covered by the 16 candidates. Finally, we identify 8 tools which satisfy our requirements on being a LDCP. We also show that there are important LD consumption steps which are not sufficiently covered by existing tools. The authors of LDCP implementations may use this survey to decide about directions of future development of their tools. LD experts may use it to see the level of support of the state of the art technologies in existing tools. Non-LD experts may use it to choose a tool which supports their LD processing needs without requiring them to have expert knowledge of the technologies. The paper can also be used as an introductory text to LD consumption.
Introduction
The openness of data is often measured using the now widely accepted and promoted 5-star Open Data deployment scheme introduced by Sir Tim Berners-Lee.1
make your stuff available on the Web (whatever format) under an open license
make it available as structured data (e.g., Excel instead of image scan of a table)
make it available in a non-proprietary open format (e.g., CSV instead of Excel)
use URIs to denote things, so that people can point at your stuff
link your data to other data to provide context
The last star is also denoted as Linked Open Data (LD/LOD). More and more data publishers are convinced that the additional effort put into the last 2 stars, i.e. LD in RDF as opposed to CSV files, will bring the promised benefits to the users of their data. The publishers rightfully expect that the users will appreciate the 5-star data much more than, e.g., the 3-star CSV files given that the proper publication of 5-star data is considerably harder and more costly to achieve. In particular, they expect that the users will appreciate benefits such as better described and understandable data and its schema, safer data integration thanks to the global character of the IRIs and shared vocabularies, better reuse of tools, more context thanks to the links and the ability to (re)use only parts of the data.
Open Data users are familiar with 3-star publication formats and principles but it is hard to encourage them to use 5-star data. Often they do not know LD technologies, most notably the RDF data model, its serialization formats and the SPARQL query language. They refuse to learn them because they do not see the difference between 3-star and 5-star representations. For example, our initiative OpenData.cz has re-published 77 2-star and 3-star datasets published by Czech public bodies in 5-star representation.2
There are also other resources reporting that learning LD technologies is a problem. For example, [117] describes a toolset for accessing LD by users without the knowledge of LD technologies. A recent blog post “Why should you learn SPARQL? Wikidata!”6
Checked on 09.03.2018.
In this paper we do not aim at surveying and evaluating the problems of data availability, performance and quality as these are separate topics on their own. We are rather interested in the question of whether there are software tools or platforms available which would support Open Data users, both with and without expert LD knowledge, in consuming LD. It is not so important whether such platform is a single software tool or a set of compatible and reusable software tools integrated together. The need for building such a platform is also identified in [117].
We call such a hypothetical platform a Linked Data Consumption Platform (LDCP). In the broadest sense, an LDCP should support users in discovering, loading and processing LD datasets with the aim of getting some output useful for users without the knowledge of LD technologies. However, it would not be practical to require each LDCP to support all these tasks. In the minimal sense, an LDCP should have the following properties:
It is able to load a given LD dataset or its part.
Its user interface does not presume the knowledge of LD technologies so that users without such knowledge can use the tool. Most notably this includes the knowledge of the RDF data model, its serializations and the SPARQL query language.
It provides some non-RDF output the users can further work with. The output can be a visualization or a machine-readable output in a non-RDF format, e.g. a CSV file.
In the first part of the paper, we describe the LD consumption process and we identify requirements which specify how individual activities in the LD consumption process could be supported by an LDCP. The individual requirements are identified either based on existing W3C Recommendations, or based on research areas and approaches published in recent scientific literature related to some parts of the LD consumption process. Therefore, the individual proposed requirements are not novel. For each requirement we define a set of criteria to be used to decide whether a given software tool fulfills the requirement or not. In total, the paper presents 34 requirements covered by 94 evaluation criteria. The requirements and their evaluation criteria constitute a framework we use to evaluate the tools.
In the second part of the paper we present our contribution – a survey of existing software tools which can be used as LDCPs. To identify LDCP candidates we do a systematic review of recent scientific literature. We search for papers which describe software tools for LD consumption, visualization, discovery, exploration, analysis or processing. For each candidate we search for its on-line instance or demo or we install our own instance and we try to load our testing LD datasets to the instance. If we are successful the candidate is selected for further evaluation. As a result, we select 16 software tools. Each tool is evaluated using the whole set of criteria to determine the fulfilled requirements introduced in the first part of the paper. The individual requirements are neither disqualifying nor intended to select the best tool for LD consumption. They represent different LD consumption features. We show how each considered tool supports these features.
We distinguish two kinds of users in the evaluation. First, there are 3-star data consumers who are not familiar with LD technologies. These users initially motivated our work. We call them non-LD experts. Second, there are experts in LD principles and related technologies. We call them LD experts. When evaluating a tool we therefore distinguish whether the tool fulfills a requirement for LD experts only, or whether even a non-LD expert can use it. We consider a tool suitable for a non-LD expert when its user interface does not presume the knowledge of LD technologies. The evaluation is not a user based study and therefore it does not evaluate the usability of the tools beyond distinguishing the LD expert and non-LD expert usage.
Based on the evaluation, we show tools which are LDCPs – either in the minimal sense specified above or with some additional features represented by our requirements. Moreover, we show tools which offer something relevant for LD consumption in terms of our requirements even though they provide only RDF output. These tools do not fulfill condition 3 of the minimal LDCP defined above. However, their RDF output can be used as input for any LDCP and, therefore, they can be integrated with any LDCP and extend its LD consumption features.
Let us also note that the evaluation requirements are not defined by non-LD experts. They are LD expert requirements based on the current state of the art in the field of LD consumption. Our evaluation shows how the current state of the art in different parts of the LD consumption process is reflected in the 16 evaluated tools in a way usable by non-LD experts or at least by LD experts. LD experts will find interesting the details of the evaluation of the individual requirements or even the individual criteria. Moreover, we also aggregate the evaluation results to show to which extent the evaluated tools cover different parts of the LD consumption process. This result will help non-LD experts in selecting the tool they can use to consume LD depending on their specific needs.
This paper is based on our introductory study of the problem [74]. Since then, we have better defined requirements, better defined survey methodology and we survey considerably more tools which are also more recent, which we present here.
This paper is structured as follows. In Section 2 we provide a motivating example of a user scenario in which journalists want to consume LD and expect to have a platform that will enable them to enjoy the promised LD benefits. In Section 3 we describe our evaluation methodology. In Section 4 we define the LD consumption process, describe the identified requirements and cover them with evaluation criteria. In Section 5 we identify existing tools and evaluate them using the evaluation criteria. In Section 6 we survey related studies of LD consumption and in Section 7 we conclude.
To motivate our work, let us suppose a team of data journalists. For their article they need to collect data about the population of cities in Europe and display an informative map. The intended audience are statisticians, who are used to working with CSV files, so the journalists also want to publish the underlying data for them as CSV files attached to the articles.
The journalists are used to working with 3-star open data, i.e. they have to know where to find the necessary data sources, e.g. population statistics and descriptive data about cities including their location, they have to download them, integrate them and process them to get the output, i.e. a visualization and a CSV file.
There are several examples of such articles available on-line. For instance, there is the pan-European European Data Journalism Network9
The journalists now want to use LD because they heard that it is the highest possible level of openness according to the 5-star Open Data deployment scheme. They expect that the experience of working with LD will be somehow better than the experience of working with 3-star data. Naturally, they expect a tool they can use to work with such data and benefit from LD principles. On the other hand, they expect that they will be able to use the tool even without the knowledge of LD technologies such as RDF serialization formats or SPARQL. Such user expectations are described also in the literature. For example, [117] presents a scenario where non-LD experts search and analyze LD indexed in Open Data portals such as the Open Data portal of the EU commission11
In the rest of this section, we show how a LD consumption tool may enable our journalists to benefit from LD in different steps of the consumption process without having to know the LD technologies.
First, the journalists need to find data about cities in Europe, i.e. their description and location so that they can be placed on a map, and data about their population. Here, LD can help already. Recently, a number of national open data catalogs emerged and are being harvested by the European Data Portal (EDP),12
After identifying candidate datasets the journalists need to choose the ones that contain information needed for their goal. A helpful functionality of an LDCP could be various kinds of summaries of the candidate datasets and characterizations based on both the metadata of the dataset and the actual data in the dataset. Here we suppose that the metadata loaded from a catalog contain correct access information for each candidate dataset. For example, for each candidate dataset, the LDCP could offer human-readable labels and descriptions, vocabularies used, numbers of instances of individual classes and their interlinks, previews tailored to the vocabularies used or to the current use case (visual or textual, readable to non-LD experts), datasets linked form the candidate, datasets linking to the candidate, spatial and time coverage, etc. Using this information, the journalists would be able to choose a set of datasets containing the required information more easily.
Another feature that could help at this time is recommendation of related datasets. Based on available information about datasets already selected, the LDCP could suggest similar datasets. Given a set of datasets to be integrated, they can be further analyzed in order to find out whether they have a non-empty intersection, e.g. whether the population information specified in one dataset actually links to the cities and their locations present in another dataset.
There could be an interoperability issue between selected datasets caused by the existence of multiple vocabularies describing the same domain. In our example, it could be that the dataset containing locations of the cities could have the geocoordinates described using the schema:GeoCoordinates14
Our journalists now have to choose the entities and properties from those datasets that are needed for their goal. This could be done in a graphical way used e.g. by graphical SPARQL query builders such as SPARQLGraph [122], but not necessarily complicated by the full expressiveness of SPARQL.
Finally, the data should be prepared for further processing, and the journalists need to decide, in which data formats they will publish the results of their work. Since their readers, given the focus of the article, will typically be non-LD experts, a suitable format is one of the 3-star data ones, i.e. XML or CSV, so that readers can open the data for instance in their favorite spreadsheet editor. This format is also suitable for people simply used to using legacy tools. This would require assisted export to tabular data in CSV, tree data in XML, or perhaps generic graph data, e.g. in CSV for Gephi [14]. Another option is to publish the data as-is in the platform, i.e. in 5-star RDF. This would be the preferred way for experts, who could then use their favorite RDF processing tools, and for users with access to an LDCP, which, as we show in this survey, is still far from available. This could enable the readers to exploit for example some RDF enabled visualizations such as LinkedPipes Visualization [71]. Naturally, the journalists may decide to publish both versions of their data to satisfy the widest possible audience.
Users such as our journalists will never be able to exploit these features only using basic technologies like IRI dereferencing and SPARQL. They need a software tool, an LDCP, which will help them to use and to benefit from these features even without the knowledge of LD technologies.
The goal of the paper is to evaluate tools classified as LDCP candidates using a predefined list of requirements. In this section we describe our methodology for identification of the requirements, identification of the tools to be evaluated, for conducting their evaluation and for aggregation of their scores.
Requirements identification
To identify requirements to be used, we first define the LD consumption process based on existing literature which also introduces a similar process. For each step of the process we identify requirements that we see as crucial for an LDCP. We focus on requirements which can be satisfied by exploiting the benefits of consuming LD compared to consuming 3-star data. We then cover each requirement with a set of evaluation criteria which we later use to evaluate existing tools and decide if and to which extend they fulfill the requirement.
We identified each requirement based on the following existing resources:
An existing software tool which satisfies the requirement.
A technical specification (e.g., W3C Recommendation) which defines the requirement.
A published research paper which at least theoretically proposes a method fulfilling the requirement.
A published research paper which expresses the need for such a requirement.
These resources are evidence that requirements are meaningful and relevant. For each of the introduced requirements it must hold that it is supported by at least one of these types of evidence. The evidence identified to support a requirement by one author was then verified by another author, and possible conflicts were addressed in a discussion leading to a consensus.
In Section 4, we describe the evidence for each identified requirement. The evidence is not a complete survey of software tools, technical specifications and literature supporting the requirement. It only describes some relevant resources which support the requirement. If there is a research paper surveying resources relevant to the requirement available, we refer to it in the evidence.
Tools selection and evaluation
In this section, we describe the publication venues investigated, search engines used and the method used to identify tools which we classify as LDCP candidates, i.e. tools described in recent scientific literature as potentially relevant to LD consumption. Then we describe the method for selecting final candidates from the potential ones and the tool evaluation methodology.
Publication venues investigated
We have identified the most important venues where publications about relevant tools could appear. For each venue we investigated its main sessions and especially the posters and demo tracks. In addition, the workshops listed below have been considered. We investigated publications since 2013 (published till July 13th 2017). The relevant venues were:
World Wide Web Conference (WWW) 2013–2017
International Semantic Web Conference (ISWC) 2013–2016
Extended Semantic Web Conference (ESWC) 2013–2017
SEMANTiCS 2013–2016
OnTheMove Federated Conferences (OTM) 2013–2016
International Conference on Web Engineering (ICWE) 2013–2016
Linked Data on the Web workshop (LDOW) 2013–2017
International Workshop on Consuming Linked Data (COLD) 2013–2016
International Conference on Information Integration and Web-based Applications & Services (iiWAS) 2013–2016
In addition, we investigated the following journals for papers no older than 2013, the newest ones being accepted for publication on July 13th 2017:
Semantic Web journal (SWJ)
Journal of Web Semantics (JWS)
Based on titles and abstracts, two of the authors independently went through the investigated venues and picked potentially interesting candidate papers. Then they read the full text of the candidate papers. In the full text they searched for any mentions of an existing tool which could be used for any of the identified requirements. This resulted in 82 tools identified as potential candidates.
Search engines used
In addition to going through the above mentioned publication venues, we used the Scopus search engine17
For keywords, we used
The query returned 1416 candidate papers. Two of the authors independently went through the search result and identified additional potentially interesting candidate papers based on their title and abstract. In the full text of the candidate papers they searched for mentions of relevant tools. This resulted into 28 additional tools. All conflicts between the authors in this phase were resolved by a discussion leading to a consensus.
The list of potential candidates was iteratively filtered in 3 elimination rounds using preliminary criteria described below, to limit the number of tools to be later evaluated according to all our 94 criteria from Section 4. The list of all tools which passed round 1, and their progress through rounds 2 and 3 can be seen in Table 9, Table 10 and Table 11 in Appendix B.
First elimination round In the first elimination round, we eliminated potential candidates based on the following exclusion criteria, using the formula
Out of the 110 potential candidates, 65 were left after the first elimination round.
Second elimination round In the second elimination round, we eliminated potential candidates based on the following exclusion criteria, using the formula
Out of the 65 potential candidates, 40 were left after the second elimination round. For each of the 40 candidates we had its running instance available which was tested in the following elimination rounds. These criteria may seem too restrictive, however, it is crucial for the evaluated tools to be easily and freely usable or installable, e.g. without registration, so that they can be assessed and used without the need for interaction with their maintainers.
Third elimination round In the third elimination round, we eliminated potential candidates based on the following exclusion criteria, using the formula
For testing
Out of the 40 potential candidates, 16 were left after the third elimination round.
The 16 candidates were evaluated thoroughly based on all 94 of our criteria from Section 4. The evaluation results are presented in Section 5.
Each criterion was evaluated from the point of view of a non-LD expert and then from the point of view of an LD expert according to the scenario, which can be seen in Appendix C. When the scenario was passed without expert knowledge of LD technologies, we assigned “✓✓” to the tool for this criterion. If the scenario could be passed only with expert knowledge of LD technologies, we assigned “✓” to the tool for this criterion. Finally, if the scenario could not be done in any way, we assigned “–” to the tool for this criterion.
When evaluating a tool given a criterion and its scenario, we first studied the user interface of the tool for any indication of support for that scenario in that tool. Next, we searched for evidence of support for that criterion in the available tool documentation, i.e. articles and web. Only after we failed to find any mention of the desired functionality this way, we said that the tool failed the criterion.
For criteria dealing with dataset search, when the tool allowed us to search for individual RDF resources and we were able to identify the datasets the found resources belonged to, we considered the criteria passed.
Tool score aggregation and interpretation
Once a tool is evaluated, it has a non-LD expert pass “✓✓”, LD expert pass “✓” or a fail “–” mark assigned for each criterion. These detailed results can be seen in Table 6, Table 7 and Table 8 in Table A. Next, its requirement score is computed as percentage of passed criteria of each requirement. These can be seen in Table 3 for non-LD experts and in Table 4 for LD experts in Section 5. Finally, its requirement group score for each group of requirements is computed as an average of scores of requirements in the group. These can be seen in Table 1 for non-LD experts and in Table 2 for LD experts in Section 5. The purpose of the score aggregation is to show the focus of each particular tool regarding the steps of the LD consumption process, both for non-LD and LD experts.
Requirements and evaluation criteria
We define the following steps of the LD consumption process:
discovery of candidate datasets available on the web based on a given user’s intent and selection of relevant datasets needed to fulfill the intent,
extraction of data from the relevant datasets,
manipulation of the extracted data, e.g. cleansing, linking, fusion, and structural and semantic transformation,
output of the resulting data into a required format.
Similar processes are considered in the related literature. For example, in [34] the authors describe the following process:
correctly identify relevant resources,
extract data and metadata that meet the user’s context and the requirements of their task or end goal,
pre-process this data to feed into the visualization tool available and the analysis required,
carry out initial exploratory analysis, using analytical and/or mining models.
Compared to our definition of the data consumption process, the process proposed in [34] concentrates more on data visualization and analysis. Nevertheless, it is comparable to ours. Step (a) corresponds to our step 1. Step (b) corresponds to our steps 1 and 2. Step (c) corresponds to our steps 3 and 4. Finally, step (d) is not covered by our process. We consider that the user works with the data as described in (d). However, this is out of the scope of an LDCP as it is performed in an external tool. Therefore, we do not evaluate this step.
There is also non-scientific literature describing the LD consumption process. In [15], the authors specify the following process:
specify concrete use cases,
evaluate relevant data sets,
check the respective licenses,
create consumption patterns,
manage alignment, caching and updating mechanisms,
create mash ups, GUIs, services and applications on top of the data
This process can also be aligned with ours. Steps (a) and (b) correspond to our step 1 – in (a) the users formulate their intent, in (b) they search for relevant datasets. Step (c) is a part of our step 3 (see Section 4.2.4). In step (d) the users identify and select relevant data from the datasets which corresponds to our step 2. Step (e) is a part of our step 3. Step (f) contains our step 4 and extends it with the actual creation of a service on top of the data. We expect that the users work with the data created in step 4 of our process in the same way as in step (f) from [15] but it is out of the scope of our process.
Our described process is generic and any data consumption process may be described in these steps, not only the LD consumption process. However, an LDCP may benefit from the LD principles in each step.
In the rest of this section, we describe the requirements for each of the described steps. In this paper, we aim explicitly at the requirements which may somehow benefit from LD principles and related technologies. For each requirement, we further specify evaluation criteria. The requirements are split into 5 requirement groups.
Therefore, there are no efficiency or performance requirements specified here. Once enough tools implement at least the minimal requirements identified here, their efficiency and performance may be evaluated.
We also do not evaluate how well a certain criterion is implemented regarding the user interface of the tool. What we evaluate is simply whether or not the tool implements at least some approach to address the criterion and whether LD expert knowledge is required or not.
We identified 34 requirements based on the existing tools and literature, split further into 94 fine grained criteria.
Dataset discovery
The consumption process starts with the user’s intent to discover datasets published on the web which contain the required data. Therefore, an LDCP should be able to gather metadata about available datasets and provide a search user interface on top of the metadata.
Gathering metadata
The primary goal of dataset discovery is to provide the users with information about existence of datasets which correspond to their intent. The provided information should consist of metadata characterizing the datasets, such as title, description, temporal and spatial information, URL where it can be accessed, etc. In this section, we define requirements on how an LDCP should gather such metadata.
The most natural way of gathering such information is loading dataset metadata from existing data catalogs. They usually provide a machine readable API, which an LDCP can use. Currently, the most wide-spread open data catalog API is the proprietary non-RDF CKAN API.21
Besides the proprietary CKAN API metadata representation, more or less standardized RDF vocabularies for representing dataset metadata exist. First, there is the DCAT [46] vocabulary, a W3C Recommendation, and DCAT-AP v1.1, the DCAT application profile for European data catalogs recommended by European Commission, providing the vocabulary support for dataset metadata. There are existing data catalogs utilizing these vocabularies for providing access to dataset metadata. Examples of such data catalogs are the European Data Portal, integrating dataset metadata from various national data catalogs and the European Union Open Data Portal providing information about the datasets from the institutions and other bodies of the European Union. Besides DCAT, there is also the VoID [2] vocabulary, a W3C interest group note for representation of metadata about LD datasets. The metadata using these vocabularies is then accessible by the usual LD ways, i.e. in a data dump, in a SPARQL endpoint or using IRI dereferencing.
An LDCP should therefore support loading dataset metadata using a data catalog API and/or the LD principles and vocabularies. This leads us to our first requirement, Req. 1.
Support for loading dataset metadata from wide-spread catalogs like CKAN and from standardized metadata in DCAT, DCAT-AP and VoID using dereferencable dataset IRIs, data dumps and SPARQL endpoints which provide the metadata.
(CKAN API).
Given a URL of a CKAN instance, e.g.
The detailed information about a dataset typically contains, among others, a link for downloading the data and information about its data format, i.e. a MIME-type, in case of downloadable files.
Therefore, LDCP can consume such API in a way which allows it to directly access the cataloged data without unnecessary user interaction. SPARQL endpoints can be discovered in a similar fashion.
(DCAT-AP).
In the European Union, the DCAT-AP standard for data portals prescribes that dataset metadata should be represented in RDF, and lists classes and properties to be used. Therefore, LDCP can consume an RDF metadata dump or access a SPARQL endpoint, e.g. the European Data Portal endpoint,24
The evaluated tool is able to load dataset metadata from a CKAN API.
(RDF metadata in dump).
The evaluated tool can exploit VoID, DCAT, DCAT-AP and/or Schema.org dataset metadata stored in RDF dumps.
(Metadata in SPARQL endpoint).
The evaluated tool can exploit VoID, DCAT, DCAT-AP and/or Schema.org dataset metadata stored in SPARQL endpoints.
(Metadata from IRI dereferencing).
The evaluated tool can dereference a
The previous requirement assumes that metadata about datasets already exists provided through APIs of existing data catalogs. However, there is a more advanced way of gathering metadata. It is through implementation or support of a custom crawling and indexing service not necessarily relying solely on metadata found in data catalogs. Such a service can build its own index of datasets comprising automatically computed metadata based on the content of the datasets using so called dataset profiling techniques [44]. The computed metadata of a dataset is then called a dataset profile. Profiles may encompass structure of the datasets, i.e. the used classes and predicates [30], semantically related labels [113] or topics which characterize the content [1] where a topic is a resource from a well-known and highly reused LD data source, e.g. DBpedia [81] or Wikidata.25
Examples of services which build dataset profiles automatically from the content of the datasets are Sindice [101] or LODStats [11]. The resulting Req. 2 can be viewed as a parallel to the development witnessed in the Web of Documents where first, there were web page catalogs and later came full-text search engines such as Google.
Support for automated extraction of dataset profiles from the web based on the dataset content, without using a catalog.
(Sindice).
Sindice [101] was an LD indexing service which then allowed to search the index data using the Sig.MA tool, which facilitated discovering the data sources of the search results. The service is, however, currently unavailable.
(Dataset profiling).
The evaluated tool is able to discover datasets without a catalog and compute their profile of any kind.
Search user interface
A user interface (UI) enables users to express their intent to search for datasets in the form of dataset search queries. In this section, we define requirements on the query language the users may use to express their dataset search queries and the assistance provided by LDCP to the users when writing such search queries. The way how search queries may be evaluated by an LDCP is discussed later in Section 4.1.3.
Most users are familiar with UIs provided by dominating dataset discovery services - open data catalogs (e.g., CKAN). They enable the users to express their intent as a list of keywords or key phrases. The users may also restrict the initial list of datasets discovered using keywords with facets. A facet is associated with a given metadata property, e.g. publisher or date of publication, and enables the users to restrict the list only to datasets having given values of this property. The provided facets are determined by the structure of the collected metadata. Alternatively, a UI may provide a search form structured according to the structure of collected metadata about datasets.
These features are independent of the methods of gathering the metadata described in Section 4.1.1 and they can be offered without building on top of the LD principles. However, there exist many approaches in the literature which show how the UI may benefit from the LD principles to better support the user. Even though they are primarily intended for querying the content of datasets, they could be directly used by an LDCP for dataset discovery. We show examples of these works in the rest of this section and formulate requirements on the LDCP based on them.
Supported query language. As argued in [128], expressing the user’s intent with a keyword-based query language may be inaccurate when searching for data. It shows that building the search user interface on top of the LD principles may help with increasing the accuracy of the queries. Theoretically, it would be possible to offer SPARQL, a query language for RDF data, as a search query language. However, this language is too complex and hard to use for common users [24], including our intended users such as data journalists.
There are two approaches to this problem in the literature. The first approach tries to provide the users with the power of SPARQL while hiding its complexity and enables them to express their intent in a natural language. The query is then translated to a SPARQL expression. For example, in [136], the authors parse a natural language expression to a generic domain independent SPARQL template which captures its semantic structure and then they identify domain specific concepts, i.e. classes, predicates, resources, combining NLP methods and statistics. In [42], the authors propose a natural language syntactical structure called Normalized Query Structure and show how a natural language query can be translated to this normalized structure and from here to SPARQL. In SimplePARQL [40], parts of the SPARQL query can be written as keywords, which are later rewritten into pure SPARQL.
The second approach offers search query languages which do not aim to be as expressive as SPARQL, but they somehow improve the expressive power of the keywords based languages. They achieve this by extending them with additional concepts. For example, [128] proposes a search query language which supports so called predicate-keyword pairs where a keyword may be complemented by RDF predicates which are related to the keywords in the searched datasets. In [52], the authors propose a novel query language NautiLOD which enables to specify navigation paths which are then searched in the datasets. A navigation path expression is simpler and easier to specify than a SPARQL query even though NautiLOD navigation paths are more powerful then SPARQL navigation paths.
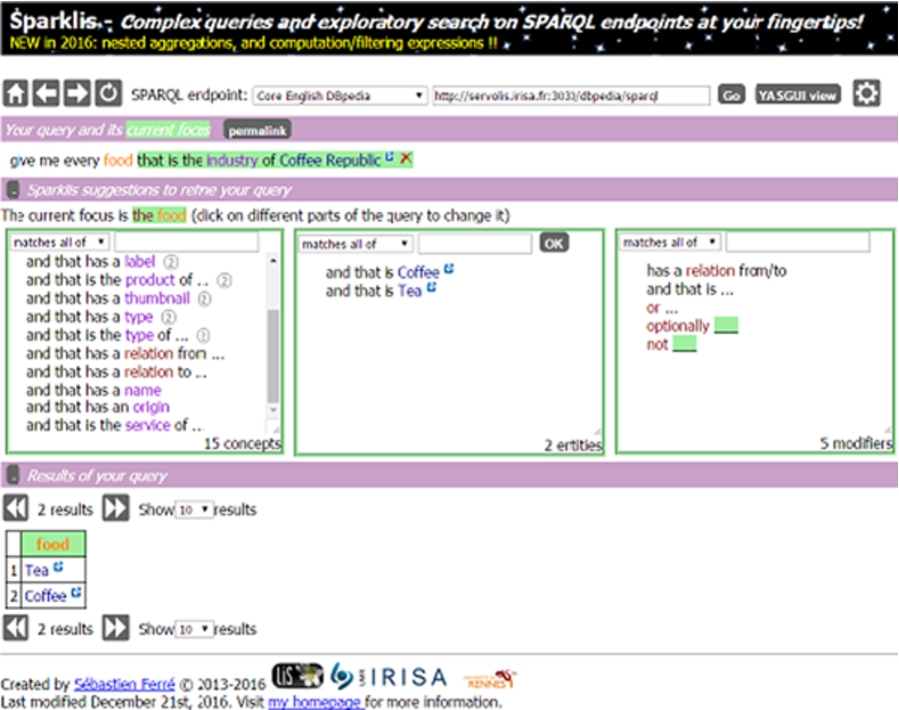
SPARKLIS user interface for formulating SPARQL queries.
Provide a user friendly search interface.
(Sparklis).
The evaluated tool provides a form structured according to the structure of metadata considered by the tool where the user’s intent can be expressed by restricting possible values in metadata profiles of searched datasets.
(Fulltext search).
The evaluated tool provides an input field where the user’s intent can be expressed as a set of keywords or key phrases.
(Natural language based intent expression).
The evaluated tool supports expressing user’s intent in a natural language.
(Formal language based intent expression).
The evaluated tool supports expressing user’s intent in a formal language less complex than SPARQL.
Assistance provided to the user when writing the query. Most users are familiar with behavior of common search engines which auto-suggest parts of queries to assist the users when expressing their intent. Also, facets may be considered as a way of assisting the users when formulating their intent. Similar assistance can also be provided in the scenario of dataset discovery. For example, [128] auto-suggests predicates relevant for a given keyword in the searched datasets. In [124], the authors show how it is possible to assist users when formulating a natural language query by auto suggesting the query not based on query logs (which is a method used by conventional web search engines) but based on the predicates and classes in the searched RDF datasets. In [50], auto-suggestions are provided by the tool automatically, based on the chosen SPARQL endpoint with a knowledge base. Faceted search over LD is studied in [6] where the authors present a tool which generates facets automatically based on the contents of indexed datasets. A detailed survey of faceted exploration of LD is provided in [135].
(Search query formulation assistance).
Assist the user when formulating search query with auto-suggestion of parts of the query or with facets derived automatically from the contents of indexed datasets.
(Search query formulation assistance).
The user interface provided by Sparklis (see Fig. 1) assists the user with formulating a graph pattern expressed in a restricted natural English by providing labels of classes, labels of their individuals as well as their predicates.
(Seach query automated suggestions).
The evaluated tool assists the user when formulating a search query with automated suggestions of parts of the query.
(Faceted search).
The evaluated tool assists the user when formulating a search query with facets.
Search query evaluation
In this section we define requirements on how an LDCP can evaluate the user’s intent expressed as a search query using the provided search user interface. The evaluation means that the LDCP identifies a list of datasets corresponding to the intent. The simplest solution is provided by the existing open data catalogs. Keywords or other metadata values filled in a search form are matched against metadata records. Further restrictions expressed by the user using facets are evaluated by filtering of the metadata records of the datasets.
The current literature shows how this basic evaluation can be extended based on LD. The first possibility is to interpret the semantics of keywords or key phrases in the search query against given knowledge bases. The keywords are represented with semantically corresponding resources, i.e. individuals, concepts, classes or properties, from the given knowledge bases, possibly including their context. In [24], the authors first discover the semantics of entered keywords by consulting a given pool of ontologies to find a syntactical match of keywords and labels of resources in these ontologies. Then they automatically formulate a formal query based on the semantics. In [146], the authors discover semantics of keywords by matching them to extraction ontologies, i.e. linguistically augmented ontologies, to enable the system to extract information from texts. An LDCP may use these approaches in two ways – it may add semantically similar concepts to the search query or it may add semantically related ones as discussed in [145]. Both possibilities mean that the query provided by the user is expanded. Therefore, we speak about query expansion. A query expansion may improve precision and recall if considered carefully, which is studied in [80].
An LDCP may also benefit from approaches for computing semantic relatedness of resources. For example, [39] shows how the semantic relatedness may be computed in a scalable way based on graph distance between two resources, i.e. average length of paths connecting the resources in a graph.
(Search query expansion).
Support for expanding search queries with additional semantically related resources.
(Search query expansion).
Using a knowledge base such as Wikidata, an LDCP may recognize terms in the search query as concepts from the knowledge base. For instance, it may recognize that the term Czech Republic represents a country.27
The evaluated tool is able to expand a search query provided by a user with additional resources which are semantically related to the resources in the original search query.
Another possibility is to extend the discovered list of datasets. It means that after the search query is evaluated, and either expanded or not, the resulting list of discovered datasets is extended with additional semantically related datasets. By the term “semantically related” we mean various kinds of semantic relationships among datasets. A simpler solution is to search for additional datasets which provide statements about the same resources, use the same vocabularies or link their resources to the resources in the already discovered datasets. These relationships are explicitly specified as RDF statements in the datasets. A more complex solution is to derive semantic relationships among datasets based on the similarity of their content [141].
An LDCP may also profit from approaches which recommend datasets for linking based on dataset similarity. For example, [45] introduces a dataset recommendation method based on cosine similarity of sets of concepts present in datasets. Similarly, the authors of [86] recommend datasets based on the similarity of resource labels present in the datasets. Having discovered a dataset, an LDCP may use such an approach to recommend other semantically similar datasets. Instead of recommending them for linking, they could be recommended as additional datasets possibly interesting to the user. We may also get back to simpler solutions and consider metadata profiles which may also contain some explicitly expressed semantic relationships between datasets. E.g., DCAT-AP discussed in Section 4.1.1 enables data publishers to specify semantic relationships between datasets in their metadata descriptions.
The discovery of related datasets is understood as one of the key features an LDCP should have for example in [79], where the authors show how a possibility of recommending additional semantically related datasets may improve the quality of scientific research in domains such as medicine or environmental research by supporting interdisciplinary research.
(Search results extension).
Support for recommendation of additional datasets semantically related to already discovered datasets.
(Search results extension).
DCAT-AP considers the following predicates from the Dublin Core Vocabulary which can be used to express semantic relationships between datasets:
(Search results extension).
The tool is able to extend the list of datasets discovered by evaluating the search query provided by a user with additional semantically related datasets.
Displaying search results
An LDCP needs to display the discovered list of datasets to the user. For this, it needs to order the discovered list and display some information about each dataset. The current dataset discovery solutions, i.e. data catalogs, order the discovered list according to the keywords based similarity of the intent of the user and the metadata descriptions of the discovered datasets. Usually, they display an ordered list of datasets with basic metadata such as the name, description, publication date, and formats in which the dataset is available. However, there are more advanced ways of displaying the search results which can be built on top of LD.
First, the discovered datasets may be ranked and their list may be ordered according to this ranking. For example, in [38], the authors modify a well-known PageRank algorithm for ranking datasets. Dataset ranking can also be based on their quality scores surveyed in [144]. In [80], the authors also propose an algorithm based on PageRank but they moreover consider the relevance to the intent of the user. A review of ranking approaches is available in [63].
(Dataset ranking).
Support for dataset ranking based on their content.
(Dataset ranking).
For example, an LDCP may combine a PageRank score of a dataset with the relevance of publishers of datasets where datasets published by public authorities are ranked higher than datasets published by other organizations.
(Content-based dataset ranking).
The evaluated tool supports ranking of datasets based on their content.
(Context-based dataset ranking).
The evaluated tool supports ranking of datasets based on their context.
(Intent-based dataset ranking).
The evaluated tool supports ranking of datasets based on the intent of the user.
Second, it is possible to show a (visual) preview or summary of the discovered datasets [20] to help the user select the appropriate datasets. For example, a timeline showing the datasets according to their creation dates, the dates of their last modification, their accrual periodicities or their combination. Other types of previews are a map showing their spatial coverage, a word cloud diagram from their keywords, etc.
The techniques which would allow an LDCP to create such previews of the datasets include support for the appropriate RDF vocabularies. Some of the LD vocabularies recently became W3C Recommendations,29
Support for dataset preview based on well-known vocabularies used to represent the dataset content or metadata.
(Preview using the RDF Data Cube Vocabulary).
Given a statistical dataset modeled using the RDF Data Cube Vocabulary, a dataset preview (Req. 8) could contain a list of dimensions, measures and attributes or a list of concepts represented by them, based on its Data Structure Definition (DSD). In addition, the number of observations could be displayed and, in the case of simpler data cubes such as time series, a graphical line graph or bar chart can be shown automatically, as in LinkedPipes Visualization [70].
(Preview – W3C vocabularies).
The evaluated tool provides a dataset preview based on used vocabularies that are W3C Recommendations.
(Preview – LOV vocabularies).
The evaluated tool provides a dataset preview based on used well-known vocabularies registered at Linked Open Vocabularies.
(Preview metadata).
The evaluated tool previews dataset description and statistics metadata recorded in DCAT, DCAT-AP, Schema.org and/or VoID.
The user may also require a dataset preview compiled not based on descriptive and statistical metadata provided by the publisher but based on metadata automatically computed from the dataset contents. This metadata include descriptive metadata (e.g., important keywords or spatial and temporal coverage), statistical metadata (e.g., number of resources or numbers of instances of different classes) and a schema. It is important to note that schemas are often very complex and their summaries are more useful for users. [103,134] propose techniques for schema summarization which create a subset of a given dataset schema which contains only the most important nodes and edges. Therefore, it is a reasonable requirement that an LDCP should be able to generate metadata independently of what is contained in the manually created metadata records.
(Data preview).
Provide dataset description, statistics and schema based on automatic querying of the actual contents of the dataset.
(Data preview).
A preview of data based on the data itself instead of relying on the metadata can be seen in the LODStats [11] dataset. From statistics such as the number of triples, entities, classes, languages and class hierarchy depth, one can get a better information contributing to the decision on whether or not to use such a dataset.
(Schema extraction using SPARQL).
For RDF datasets, the list of used vocabularies can be attached using the
and this one for predicates among classes with number of their occurences:
The evaluated tool provides dataset description and statistics based on automatic querying of the actual dataset.
(Schema extraction).
The evaluated tool provides a schema automatically extracted from the given dataset.
Besides metadata, statistics and used vocabularies there are many other criteria regarding data quality that should also be presented to the user to support his decision making. We do not aim at specific quality indicators. The following requirement related to data quality is generic and it considers any meaningful LD quality indicator. A recent survey of such indicators and techniques for their computation is available [144].
(Quality indicators).
Provide quality measurements based on LD quality indicators.
(Checking of availability).
One of the quality dimensions surveyed in [144] is availability. An LDCP could support its users by periodically checking the availability of known datasets by trying to access dumps or by querying SPARQL endpoints and dereferencing IRIs. The data gathered this way could be presented e.g. as availability percentage. The SPARQLES service [137]32
Provide quality measurements based on LD quality indicators.
Data manipulation
A common problem of LD tools out there is their limited support for standards of representation and access to LD. An LDCP should support all existing serialization standards such as Turtle, JSON-LD, etc. and it should support loading the input in different forms such as dump files, SPARQL endpoints, etc. In this section, we motivate and define requirements on data input, its transformations, provenance and licensing support and we emphasize existing web standards.
Data input
An LDCP should support all the standard ways of accessing LD so that there are no unnecessary constraints on the data to be consumed. These include IRI dereferencing (Req. 11), SPARQL endpoint querying (Req. 12 and the ability to load RDF dumps in all standard RDF 1.1 serializations.33
There are at least two ways of how an LDCP should support IRI dereferencing. First, an LDCP should be able to simply access a URL and download a file in any of the standard RDF serializations, which we deal with later in Req. 13. Second, an LDCP should be able to use HTTP Content Negotiation37
Ability to load RDF data by dereferencing IRIs using HTTP content negotiation and accepting all RDF 1.1 serializations.
(Usage of IRI dereferencing).
One of the possible data inputs can be a single RDF resource, e.g. the representation of Prague in DBpedia, for which the user might want to monitor, some property, e.g. population. The easiest way to do that is to simply access the resource IRI, to support following HTTP redirects and to ask for RDF data in our favorite RDF serialization (Req. 11). This process can be then repeated as necessary. It is an equivalent of running, e.g.:
(IRI dereferencing).
Ability to load RDF data by dereferencing IRIs using HTTP content negotiation.
(Crawling).
Ability to apply the follow your nose principle
Publishing data via a SPARQL endpoint is considered the most valuable way of publishing LD for the consumers. It provides instant access to the computing power of the publishers infrastructure and the consumer does not have to work with the data at all to be able to query it. Publishing data this way also enables users to do federated queries [108]. Therefore, this should be the easiest way of getting data using an LDCP. On the other hand, public SPARQL endpoints typically implement various limitations on the number of returned results or query execution time, which make it hard to get, e.g. a whole dataset this way. These limits, however, can be tackled using various techniques such as paging.
(RDF input using SPARQL).
Ability to load data from a SPARQL endpoint.
(Accessing the DBpedia SPARQL endpoint).
Since DBpedia is the focal point of the whole LOD cloud, it is often used as a linking target to provide more context to published data. In addition to IRI dereferencing, an LDCP can use the DBpedia SPARQL endpoint to, e.g., suggest more related data of the same type, etc.
(SPARQL: querying).
Ability to query a given SPARQL endpoint using a SPARQL query or a set of queries provided by the tool.
(SPARQL: named graphs).
Awareness of named graphs in a SPARQL endpoint and ability to work with them.
(SPARQL: custom query).
Ability to extract data from a SPARQL endpoint using a custom SPARQL query.
(SPARQL: authentication).
Ability to access SPARQL endpoints which require authentication.
(SPARQL: advanced download).
Ability to download a dataset from a SPARQL endpoint even though it is too big to download using the standard
(RDF dump load).
Ability to load data from an RDF dump in all standard RDF serializations, including tabular data with CSVW mapping and relational databases with R2RML mapping.
The previous techniques such as SPARQL querying and IRI dereferencing relied on the fact that the target service was able to provide the desired RDF data serialization. However, when there are RDF dumps already serialized, to be downloaded from the web, an LDCP needs to support all standardized serializations itself, as it cannot rely on any service for translation.
(RDF quads dump load).
One of the use cases for named graphs in RDF already adopted by LD publishers is to separate different datasets in one SPARQL endpoint. It is then quite natural for them to provide data dumps in an RDF quads enabled format such as N-Quads or TriG, e.g. statistical datasets from the Czech Social Security Administration.39
This also eases the loading of such data to a quad-store as the user does not have to specify the target graph to load to. Since there are multiple libraries and quad-stores supporting RDF 1.1 serializations, this should not be a problem and an LDCP should support all of them.Ability to load data from an RDF/XML file, both from a URL and locally.
(Turtle file load).
Ability to load data from a Turtle file, both from a URL and locally.
(N-Triples file load).
Ability to load data from an N-Triples file, both from a URL and locally.
(JSON-LD file load).
Ability to load data from a JSON-LD file, both from a URL and locally.
(RDFa file load).
Ability to load RDF data from an RDFa annotated file, both from a URL and locally.
(N-Quads file load).
Ability to load data from an N-Quads file, both from a URL and locally.
(TriG file load).
Ability to load data from a TriG file, both from a URL and locally.
(Handling of bigger files).
Ability to process bigger RDF dumps without loading them as RDF models. These techniques can be found in RDFpro [ 32 ] and RDFSlice [ 87 ].
(CSV on the Web load).
Ability to load data from a CSV file described by the CSV on the Web (CSVW) metadata, both from a URL and locally.
(Direct mapping load).
Ability to load data from a relational database using Direct mapping [ 22 ].
(R2RML load).
Ability to load data from a relational database using R2RML mapping.
Besides these traditional ways of getting LD, an LDCP should support the Linked Data Platform [8] specification for getting resources from containers. These can be, e.g. notifications according to the Linked Data Notifications W3C Recommendation [27,28].
(Linked Data Platform input).
Ability to load data from the Linked Data Platform compliant servers.
(Loading data from Linked Data Platform).
The Linked Data Platform (LDP) specifications defines (among others) containers40
Ability to load items from the Linked Data Platform containers.
In addition to be able to load data in all standardized ways, an LDCP should also provide a way of saying that the data source should be periodically monitored for changes, e.g. like in the Dynamic Linked Data Observatory [64]. This includes the specification of the periodicity of the checks and the specification of actions to be taken when a change is detected. The actions could vary from a simple user notification to triggering a whole pipeline of automated data transformations. This way, the users can see what is new in the data used for their goals and whether the data is simply updated or needs their attention due to more complex changes. A short survey of existing approaches to change monitoring is provided in [44], Section 3.7.
(Monitoring of changes in input data).
Ability to periodically monitor a data source and trigger actions when the data source changes.
(Keeping data up to date).
The EU Metadata Registry (MDR)42
Ability to periodically monitor a data source and trigger actions when the data source changes.
(Monitoring of input changes: subscription).
Ability to subscribe to a data source, e.g. by WebSub [ 54 ], formerly known as PubSubHubbub, or ActivityPub [ 142 ] and trigger actions when the data source changes.
When working with real world data sources, it may be necessary to keep track of versions of the input data which can change in time or even become unavailable. When more complex changes happen in the data, the whole consumption pipeline could be broken. Therefore, a version management mechanism should be available in an LDCP so that the user can work with a fixed snapshot of the input data and see what has changed and when. Such a mechanism could also be automated. For example, if a consuming client holds a replica of a source dataset, changes in the source may be propagated to the replica as shown in [48], creating a new version. Updates may also be triggered by events like Git commits, as can be seen in [7].
Another type of version management is support for handling a data source, which itself is available in multiple versions at one time, e.g. using the Memento [37] protocol.
(Version management).
Ability to maintain multiple versions of data from selected data sources.
(Manual versioning support).
Ability to keep multiple versions of input data, the versions are created, deleted and switched manually.
(Automated versioning support).
Ability to keep multiple versions of input data, with support for automated versioning actions such as automatic synchronization of remote datasets.
(Source versioning support).
Ability to exploit the existence of multiple versions of a dataset at its source, e.g. by supporting the Memento protocol.
Analysis of semantic relationships
The requirements discussed in the previous sections support the users in discovering individual datasets isolated from one another. However, the users usually need to work with them as with one integrated graph of RDF data. Therefore, the users expect that the datasets are semantically related to each other and that they can use these semantic relationships for their integration. If a dataset is not in a required relationship with the other discovered datasets the users need to know this so that they can omit the dataset from further processing. We have briefly discussed possible kinds of semantic relationships in Req. 6. However, while Req. 6 only required an LDCP to show datasets which are somehow semantically related to the selected one, now the users expect a deeper analysis of the relationships.
Each of the existing semantic relationships among the discovered datasets should be presented to the users with a description of the relationship, i.e. the kind of the relationship and its deeper characteristics. The descriptions will help the users to understand the relationships and decide whether they are relevant for the integration of the datasets or not.
When the datasets share resources or their resources are linked, the deeper characteristics may involve the information about the classes of the resources, the ratio of the number of the shared or linked resources to the total number of the resources belonging to these classes, compliance of the datasets in the statements provided about the shared resources, etc. There are approaches which provide explanations of such relationships to users. For example, [104,105] propose a method for generating explanations of relationships between entities in the form of most informative paths between the entities. The approach can be extended to explaining relationships among datasets which contain related entities. In [123], the authors present another approach to explaining relationships between datasets based on so called relatedness cores which are dense sub-graphs that have strong relationships with resources from the related datasets.
When the datasets neither share the resources nor there are links among them, the semantic relationship may be given by the fact that they share some parts of vocabularies, i.e. classes or predicates. Such relationships may be deduced from metadata collected by services such as LODStats [11].
(Semantic relationship analysis).
Provide characteristics of existing semantic relationships among datasets which are important for the user to be able to decide about their possible integration.
(LODVader).
LODVader [96] shows relationships among given datasets, demonstrated on the LOD cloud. Instead of relying on existing metadata in VoID, it generates its own based on the actual data. It is able to present relationships based on links between resources as well as shared vocabularies. Unfortunately, the software seems abandoned and the demo works no longer.
(Shared resources analysis).
Provide characteristics of existing semantic relationships among datasets based on resources shared by the datasets.
(Link analysis).
Provide characteristics of existing semantic relationships among datasets based on links among resources.
(Shared vocabularies analysis).
Provide characteristics of existing semantic relationships among datasets based on shared vocabularies or their parts.
As a supplemental requirement to the previous one is the support of methods for automated or semi-automated deduction of semantic relationships among datasets. These methods may be useful when semantic relationships cannot be directly discovered based on statements present in the datasets, but new statements must be deduced from the existing ones. There are tools like SILK [140], SLINT [97] or SERIMI [5] which support so called link discovery which means deducing new statements linking resources of, usually, two datasets. In theory, deduction of new linking statements is usually done using various similarity measures [91,132]. In [95] is a recent comprehensive survey of link discovery frameworks. Another family of tools supports so called ontology matching [102] which is a process of deducing mappings between two vocabularies. These methods may help an LDCP to provide the user with more semantic relationships.
(Semantic relationship deduction).
Provide support for automated or semi-automated deduction of semantic relationships among datasets.
(Link discovery using SILK).
A classic example of adding semantic relations to existing data is link discovery. Let us, for instance, consider a dataset with useful information about all Czech addresses, towns, etc. called RÚIAN. Data on the web, however, typically links to DBpedia representations of Czech cities and regions. In order to be able to use information both from the LOD cloud and from RÚIAN, the data consumer needs to map, e.g., the Czech towns in the Czech dataset to the Czech towns in DBpedia, based on their names and based on regions in which they are located. This is a task well suited for a link discovery tool such as SILK, and an LDCP should be able to support this process.
(Link discovery).
Provide support for automated or semi-automated deduction of links among datasets.
(Ontology alignment).
Provide support for automated or semi-automated ontology alignment.
Semantic transformations
The user now needs to process the discovered datasets. As we discuss later in Section 4.4, this means either visualizing the datasets or exporting them with the purpose of processing in an external tool. In general, it means to transform the datasets from their original form to another one, which is necessary for such processing. We can consider transformations, which transform one RDF representation of the datasets to another RDF representation or to other data models such as relational, tree, etc. In this section, we discuss the RDF to RDF transformations. The transformations to other data models are considered as outputs of the process and are covered in Section 4.4. A transformation involves various data manipulation steps which should be supported by an LDCP.
First, an LDCP must deal with the fact that there exist different vocabularies for the same domain. We say that such datasets are semantically overlapping. Let us note that a semantic overlap is the kind of semantic relationship discussed in Req. 17. Therefore, it often happens that the vocabulary used in the dataset is different from the one required for the further processing. In such situations it is necessary to transform the dataset so that it corresponds to the required vocabulary. The transformation can be based on an ontological mapping between both vocabularies or it can be based on a transformation script specifically created for these two vocabularies. This requirement is realistic when we consider well-known vocabularies such as FOAF. Schema.org, GoodRelations, WGS84_pos, and others registered in LOV.
(Transformations based on vocabularies).
Provide transformations between semantically overlapping vocabularies.
(GoodRelations to Schema.org transformation).
In the process of development of the Schema.org vocabulary, a decision was made to import classes and properties of the GoodRelations vocabulary used for e-commerce into the Schema.org namespace. This decision is questionable and controversial43
Provide transformations between semantically overlapping vocabularies based on their mapping, e.g. using OWL.
(Vocabulary-based SPARQL transformations).
Provide transformations between semantically overlapping vocabularies, based on predefined SPARQL transformations.
Another often required kind of data manipulation is inference. Inference can be used when additional knowledge about the concepts defined by the vocabulary is provided which can be used to infer new statements. Such knowledge is expressed in the form of so called inference rules. Semantic mappings between vocabularies mentioned above also form a kind of inference rules, but here we consider them in their broader sense. A specific kind of inference rules allows one to specify that two resources are the same real-world entity, i.e. the
(Inference and resource fusion).
Support inference based on inference rules encoded in vocabularies or ontologies of discovered datasets.
(Inference).
Many RDF vocabularies are defined with some inference rules in place. An example of inference which would be beneficial to support in an LDCP can be the SKOS vocabulary with its
Let us have two datasets we already mentioned in Example 18.1, Czech towns from DBpedia and the Czech registry containing information about all addresses and, among others, cities of the Czech Republic and let us consider we linked the corresponding entities using the
(RDFS inference).
Support inference based on inference rules encoded in the RDFS vocabulary.
(Resource fusion).
Support fusion of statements about the same resources from different datasets.
(OWL inference).
Support inference based on inference rules encoded OWL ontologies.
Besides transformations, the user will typically need the standard operations for data selection and projection. An LDCP can assist the user with specification of these operations by providing graphical representation of the required data subset, which may correspond to a graphical representation of a SPARQL query like in SPARQLGraph [122] and similar approaches.
(Selection and projection).
Support assisted graphical selection and projection of data.
(Data language selection).
One type of selection may be limiting the dataset to a single language. For example, when working with the EU Metadata Registry (MDR), codelists are usually provided in all EU languages. Having the data in multiple languages may, however, not be necessary. An LDCP may support common selection techniques without requiring the user to write SPARQL queries.
(Assisted selection).
Support assisted graphical selection of data.
(Data projection).
An example of a projection may be picking only data which is relevant for a given use case, while omitting other properties of represented resources. The user may again be assisted by a graphical overview of the dataset with possibility to select relevant entities, their properties and links.
(Assisted projection).
Support assisted graphical projection of data.
Besides the above described specific data manipulation requirements, the user may need to define own specific transformations expressed in SPARQL.
(Custom transformations).
Support custom transformations expressed in SPARQL.
(Custom transformations).
Support custom transformations expressed in SPARQL.
Having the support for all kinds of data manipulations described above it is necessary to be able to combine them together so that the discovered datasets are transformed to the required form. The user may be required to create such data manipulation pipeline manually. However, we might also expect that an LDCP compiles such pipeline automatically and the user only checks the result and adjusts it when necessary.
(Automated data manipulation).
Support automated compilation of data manipulation pipelines and enable their validation and manual adjustment by users.
(Automated data manipulation).
An LDCP may be aware of what the data in each step of the consumption process looks like even as the process is being designed, e.g. by performing background operations on data samples, and it may recommend possible or probable next steps. Using the same principles, the data transformation pipelines may be even generated automatically, given that the requirements on the final data structure are known and the source data is accessible. This can be seen in e.g. LinkedPipes Visualization [71], where given an RDF data source, a list of possible visualizations formed by data transformation pipelines, is offered automatically, based on known vocabularies and input and output descriptions of the data processing components.
(Automated data manipulation).
Support automated compilation of data manipulation pipelines and enable their validation and manual adjustment by users.
Provenance and license management
For the output data to be credible and reusable, detailed provenance information should be available capturing every step of the data processing task, starting from the origin of the data to the final transformation step and data export or visualization. There is the PROV Ontology [119], a W3C Recommendation that can be used to capture provenance information in RDF.
(Provenance).
Support for processing provenance information expressed using a standardized vocabulary.
(Provenance).
When the goal of the LD consumption process is to gather data, combine it and pass it to another tool for processing, it might be useful to store information about this process. Specifically, the consumers of the transformed data might be interested in where the data comes from, how it was combined, what selection and projection was done, etc. This information can be stored as an accompanying manifest using the PROV Ontology [119] and may look like this (taken directly from the W3C Recommendation):
(Provenance input).
Ability to exploit structured provenance information accompanying input data.
(Provenance output).
Provide provenance information throughout the data processing pipeline using a standardized vocabulary.
Part of metadata of a dataset should be, at least in case of open data, the information about the license under which the data is published, since that is what the first star of open data is for. A common problem when integrating data from various data sources is license management, i.e. determining whether the licenses of two data sources are compatible and what license to apply to the resulting data. This problem gets even more complicated when dealing with data published in different countries. A nice illustration of the problem is given as Table 3 in ODI’s Licence Compatibility47
Support license management by tracking licenses of original data sources, checking their compatibility when data is integrated and helping with determining the resulting license of republished data.
(License management).
Based on open data license compatibility information such as the ODI’s Licence Compatibility table, an LDCP should advise its user on whether two data sources can be combined or not and what is the license of the result. The licenses of individual datasets can be obtained from its DCAT metadata, as in, e.g. the Czech National Open Data catalog.49
Awareness of dataset licenses, e.g. gathered from metadata, and their presentation to the user.
(License management).
Awareness of the license combination problem and assistance in determining the resulting license when combining datasets.
Data visualization
The goal of using an LDCP is either to produce data for processing in other software or to produce visualizations of discovered data sets. Given the graph nature of RDF, the simplest visualization is a graph visualization of the data, reflecting its structure in RDF. Another type of visualizations are manually specified using a mapping of the RDF data to the inputs of visualization plugins, as in LinkDaViz [131]. Finally, visualizations can be automated, based on correct usage of vocabularies and a library of visualization tools as in the LinkedPipes Visualization (LP-VIZ) [70], which offers them for DCV, SKOS hierarchies and Schema.org GeoCoordinates on Google Maps.
(Visualization).
Offer visualizations of LD based on its graph structure, manual mapping from the data to the visualizations, or using automated methods for visualization.
(Manual visualization in LinkDaViz).
An example of manual visualization is LinkDaViz. The user first selects the dataset to be visualized and then selects specific classes and properties from the dataset. Based on the selected properties and their data types, visualization types are recommended and more can be configured manually to get a visualization such as a map, a bar chart, etc.
(Automated visualization in LP-VIZ).
In contrast to manual visualization in Example 26.1, in LinkedPipes Visualization the user points to the dataset and the tool by itself, automatically, takes a look at what data is present in the dataset. It then offers possible visualizations, based on the found, well-known vocabularies supported by components registered in the tool.
(Graph visualization).
Offer automated visualizations of LD based on well-known vocabularies.
(Manual visualization).
Offer visualizations of LD based on manual mapping from the data to the visualizations.
(Vocabulary-based visualization).
Offer automated visualizations of LD based on well-known vocabularies.
Data output
The other possible goal of our user is to output raw data for further processing. The output data can be in various formats, the most popular may include RDF for LD, which can be exported in various standardized ways. The first means of RDF data output is to a dump file using standardized serializations. The inability to create a dump in all standardized formats (only some) will be classified as partial coverage of the requirement.
(RDF dump output).
Ability to export RDF data to a dump file in all standard RDF serializations.
(RDF dump output).
Various tools may need various RDF serializations to be able to process the output data. The main problem which can be seen quite often is that many applications consuming RDF only support triple formats and not quad formats. Therefore, a LDCP should support output in all standard RDF 1.1 serializations, which can be easily supported by using an existing library such as Apache Jena or Eclipse RDF4J.
(RDF/XML file dump).
Ability to dump data to an RDF/XML file.
(Turtle file dump).
Ability to dump data to a Turtle file.
(N-Triples file dump).
Ability to dump data to an N-Triples file.
(JSON-LD file dump).
Ability to dump data to a JSON-LD file.
(RDFa file dump).
Ability to dump RDF data to an RDFa annotated file.
(N-Quads file dump).
Ability to dump data to an N-Quads file.
(TriG file dump).
Ability to dump data to a TriG file.
Another way of outputting RDF data is directly into a triplestore, using one of two standard ways, either the SPARQL Update query [106] or using the SPARQL Graph Store HTTP Protocol [100].
(RDF output using SPARQL).
Ability to load RDF data to a SPARQL endpoint using SPARQL Update or SPARQL Graph Store HTTP protocol.
(Loading data using the SPARQL Graph Store HTTP Protocol).
For larger datasets, where whole named graphs are manipulated, it is simpler to use the SPARQL Graph Store HTTP Protocol to load data. Basically, a data dump is sent over HTTP to the server instead of being inserted by a SPARQL query. However, despite being a W3C Recommendation, the implementation of the protocol differs among quad stores. Therefore, besides the endpoint URL, authentication options and the target named graph, an LDCP should be also aware of the specific implementation of the endpoint. This can be seen e.g. in LinkedPipes ETL’s Graph Store Protocol component.50
Ability to load RDF data to a SPARQL endpoint using SPARQL Update.
(SPARQL: named graphs support).
Awareness of named graphs in a SPARQL endpoint and ability to load data to them.
(SPARQL: authentication support).
Ability to access SPARQL Update endpoints which require authentication.
(SPARQL Graph Store HTTP Protocol output).
Ability to load RDF data to a SPARQL endpoint using the SPARQL Graph Store HTTP Protocol.
Lastly, an LDCP should be able to write RDF data to Linked Data Platform compliant servers. This may also include support for W3C Recommendations building on top of the LDP, such as Linked Data Notifications [28] for sending notifications to inboxes on the web.
(Linked Data Platform output).
Ability to write data to Linked Data Platform compliant servers.
(Loading data to Linked Data Platform).
The Linked Data Platform (LDP) specifications defines (among others) how new entities should be added to existing containers. Therefore, an LDCP should be aware of this and support the handling of LDP containers. A specific use case may be sending messages according to the Linked Data Notifications W3C Recommendation.
(Linked Data Platform Containers Output).
Ability to upload data by posting new entities to Linked Data Platform Containers.
Besides being able to output RDF, a perhaps even more common use case of an LDCP will be to prepare LD to be processed locally by other tools, which do not know LD. One choice for non-LD data export is a CSV for tabular data. The usual way of getting CSV files out of RDF data is by using the SPARQL SELECT queries. Such CSV files can now be supplied by additional metadata in JSON-LD according to the Model for Tabular Data and Metadata on the Web (CSVW) [129] W3C Recommendation. Besides tabular data, tree-like data are also popular among 3-star data formats. These include XML and JSON, both of which the user can get, when a standardized RDF serialization in one of those formats, i.e. RDF/XML and JSON-LD, is enough. This is already covered by Req. 27. However, for such data to be usable by other tools, it will probably have to be transformed to the JSON or XML format accepted by the tools and this is something that an LDCP should also support. For advanced graph visualizations it may be useful to export the data as graph data e.g. for Gephi [14]. Majority of people today do not know SPARQL and do not want to learn it. However, an LDCP should still allow them to work with LD and use the data in their own tools. Therefore, an LDCP should not only allow to export 3* data, but it should support doing so in a user friendly way, with predefined output formats for external tools and, ideally, predefined transformations from vocabularies used in the tool’s domain. This observation comes from a recent publication of a Czech registry of subsidies, which was published as LD only, with N-Triples dumps, dereferencable IRIs and a public SPARQL endpoint.51
Ability to export non-RDF data such as CSV with CSVW metadata, XML, JSON or Graph data for visualizations or further processing in external tools.
(Gephi support).
To support graph visualization in Gephi, which can effectively visualize large data graphs, an LDCP should support output consumable by Gephi. Technically, this is a pair of CSV files with a specific structure. An LDCP could include a wizard for creation of such files.
(CSV file output).
Ability to export data as CSV files.
(CSV on the Web output).
Ability to export data as CSV files accompanied by the CSV on the Web JSON-LD descriptor.
(XML file output).
Ability to export data as arbitrarily shaped XML files.
(JSON file output).
Ability to export data as arbitrarily shaped JSON files.
(Output for specific third-party tools).
Ability to export data for visualization in specific third-party tools.
Developer and community support
For most of our requirements there already is a tool that satisfies them. The problem why there is no platform using these tools is caused by their incompatibility and the large effort needed to do so. An LDCP does not have to be a monolithic platform and can consist of multitude of integrated tools. However, the tools need to support easy integration, which motivates the next requirements. Each part of an LDCP and the LDCP itself should use the same API and configuration which it exposes for others to use. The API should again be based on standards, i.e. REST or SOAP based, and the configuration should be consistent with the rest of the data processing, which means in RDF with a defined vocabulary.
(API).
Offer an easy to use, well documented API (REST-like or SOAP based) for all important operations.
(API).
For instance, LinkedPipes ETL offers REST-like API used by its own frontend to perform operations like running a transformation, creating a transformation pipeline, etc. The API is documented by OpenAPI52
Ability to accept commands via an open API.
(API documentation).
Existence of a documentation of the API of the tool, such as OpenAPI.
(Full API coverage).
Ability to accept all commands via an open API.
(RDF configuration).
Offer RDF configuration where applicable.
(RDF configuration).
All configuration properties and projects of an LDCP should be also stored, or at least accessible, in RDF. This is so that this data can be read, managed and created by third-party RDF tools and also shared easily on the Web, as any other data. For instance, LinkedPipes ETL stores its transformation pipelines in RDF and makes their IRIs dereferencable, which eases their sharing and offers wider options for their editing.
(Configuration in open format).
Configuration stored and accepted in an open format such as JSON or XML.
(Configuration in RDF).
Configuration stored and accepted in RDF.
An important quality of a tool available on the web is the nature of its community. This includes the size of the community formed around that tool, its activities and repositories for sharing tool plugins and data processes created in the tool. The community should be active and maintain the tool, or at least share new plugins or new data processes.
Since one of the ideas of LD is distribution of effort, the data processes defined in an LDCP should themselves be shareable and described by an RDF vocabulary as it is with, e.g. the Linked Data Visualization Model (LDVM) pipelines [68]. For this, a community repository for sharing of LDCP plugins, i.e. reusable pieces of software, which can extend the functionality of the LDCP, like visualization components from Req. 26 and vocabulary-based transformers from Req. 19 should be present and identified for the LDCP.
In addition, the data transformation processes defined using the LDCP, i.e. the LDCP process configuration, should also be easily shareable with the community, facilitating effort distribution. An example of such a shared project could be a configuration allowing users to extract subsets of DBpedia as CSV files, etc.
(Tool community).
An active community should exist around the tool in the form of repositories and contributors.
(Sharing on GitHub).
Git is a very popular tool for sharing of and collaboration on software and data, with GitHub as one of its most popular repository implementations. To spark the network effect, an LDCP should have a catalog of plugins and reusable projects, on which the community can collaborate. Since projects themselves should be stored as RDF (Req. 32), they can be easily shared on, e.g. GitHub. This can be illustrated by, e.g. LinkedPipes ETL, which has its repository of plugins53
Existence of an openly accessible repository where the source code of the tool is developed.
(Repository for plugins).
Existence of an openly accessible repository of plugins such as GitHub.
(Repository for data processes).
Existence of an openly accessible repository of data processes such as GitHub.
(Community activity).
There is at least 2 commits from 2 distinct contributors in the last year to any of the tool related repositories.
When the whole process of data gathering, processing and output is described in LDCP, it may be useful to expose the resulting transformation process as a web service, which can be directly consumed by e.g. web applications. This could facilitate live data views or customizable caching and update strategies.
(Deployment of services).
Offer deployment of the data transformation process as a web service.
(Encapsulated SPARQL queries).
A very simple example of Req. 34 could be a SPARQL query, possibly with parameters, encapsulated as a web service. This is a common way of helping non-RDF applications consume live RDF data without even knowing it. However, the process behind the web service can be much more complex, and an LDCP could offer creation of such services to its users.
(Deployment of services).
Ability to deploy the data transformation process as a web service.
Tools evaluation and description
Requirement group scores of evaluated candidates for non-LD experts. Empty cells represent 0%
Requirement group scores of evaluated candidates for non-LD experts. Empty cells represent 0%
Requirement group scores of evaluated candidates for LD experts. Empty cells represent 0%
In this section, we first briefly describe each evaluated tool and we point out to fulfilled requirements. Then we discuss the evaluation results and identify tools which can be considered as an LDCP because they satisfy at least the minimal conditions described in the introduction. Not all evaluated tools meet even the minimal conditions. However, it does not mean that they are useless for LD consumption. We also discuss the evaluation results for these tools in the text.
In this section, we introduce the 16 individual tools which we evaluated using our 94 criteria.
LinkedPipes visualization
LinkedPipes Visualization [71] (LP-VIZ) is a tool providing automated visualizations of LD, fulfilling Req. 8 Preview based on vocabularies and Req. 26 Visualization. It queries the input data given as an RDF dump or as a SPARQL endpoint for known vocabularies, and based on the result, it offers appropriate visualizations. These include an interactive RDF data cube visualization, various types of SKOS hierarchy visualizations and a map based visualization (see Fig. 2), which can be further filtered based on concepts connected to the points on the map. In addition, in the RDF data cube visualization it also employs Req. 11 IRI dereferencing to search for labels of entities.
As to the other parts of the LD consumption process, no requirements were satisfied in the Data output and Developer and community support groups.
V2
V2 [3] is an on-line demo for visualization of vocabularies used in RDF data. In the first step the user provides a list of SPARQL endpoints. V2 executes a set of predefined SPARQL queries to analyze the vocabularies used in the data and creates the dataset preview.

LinkedPipes Visualization – Points on a map.

V2 visualization.
On the top level of the preview, the used classes are presented (see Fig. 3). The user can select a class to see the information about the number of instances and about predicates used. V2 is simple, nevertheless it can be used to address the Dataset discovery part of the LD consumption process, specifically, it covers Data preview.
VISUalization Playground [3] (VISU) is an on-line service for visualization of SPARQL results. It uses predefined or user provided SPARQL SELECT queries to retrieve data from given SPARQL endpoints. Then it uses Google Charts Editor to create a wide range of visualizations (see Fig. 4) based on the output table, including line charts, tree charts or map visualizations.

VISU visualization.
The main focus of VISU is at Data visualization.
Sparklis [50] (Sp) is an on-line Linked Open Data exploration tool that does not require the user to have knowledge of SPARQL. The user can specify a SPARQL endpoint and explore its contents using so called focus, which represents the user’s intent. Its iterative refinement corresponds to the exploration process (see Fig. 5). The focus is defined using three types of constrains: concept, entity and modifier. The concept constraint allows the user to define subject type(s). The entity constraint restricts the focus to a single entity. Modifiers represent logical operations and filters.

Sparklis user interface for data exploration.
In each step of the focus refinement process, the user is guided by suggestions for all three types of constrains. Sparklis offers an on–the–fly data visualization in the form of a table or, in case of geolocalized data, a map. A query corresponding to the current focus is accessible in the integrated YASGUI tool, which provides additional options for visualization and data export.
From the point of view of the LD Consumption process, Sparklis covers mainly Dataset discovery and Data manipulation.
Yet Another SPARQL GUI [111] (YAS) is a web-based SPARQL query editor. As such it offers the ability for the user to specify a SPARQL query without knowing the precise syntax. Once the query is executed YASGUI provides different visualizations, such as table, pivot table, Google Chart (see Fig. 6) and Map visualizations, and export of SPARQL SELECT results to a CSV file.
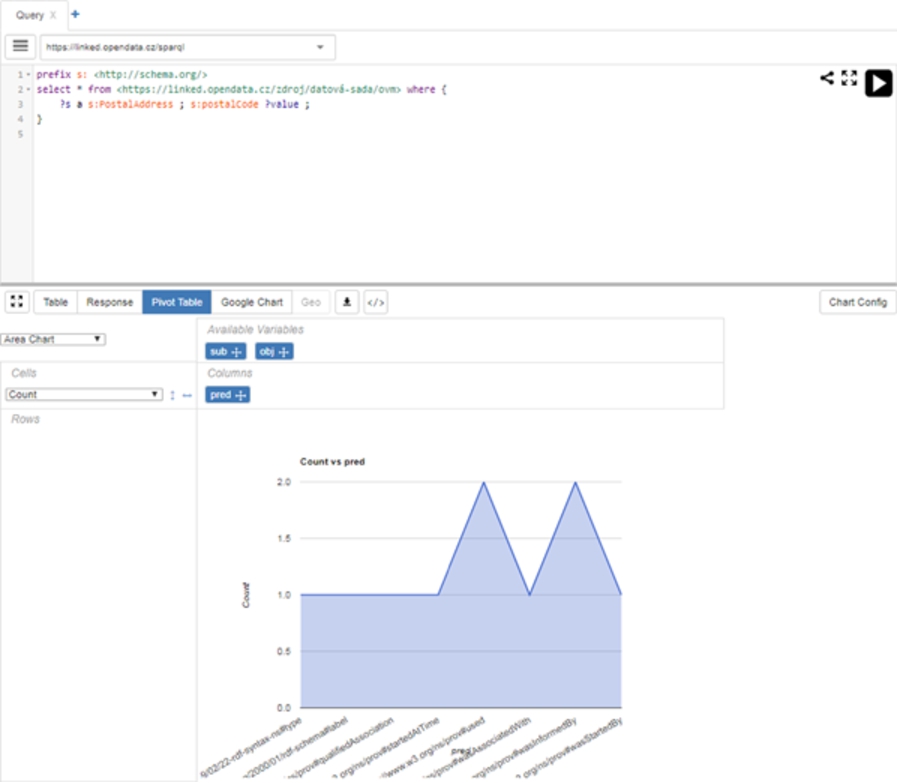
YASGUI SPARQL query builder interface.
The aim of YASGUI is not to be used as a standalone tool, but rather be integrated as a component. Still, it covers several areas of the LD consumption process, mainly Data manipulation, Data visualization and Data output. It is currently used in multiple LD based tools,55
UnifiedViews [77] (UV) is a predecessor of LinkedPipes ETL, which means that it is also an open–source tool for design and execution of ETL pipelines (see Fig. 7), and it is also focused on RDF and linked data and features a library of reusable components. Its requirements coverage is therefore a subset of the coverage of LinkedPipes ETL.

UnifiedViews transformation pipeline.

LinkedPipes ETL transformation pipeline.
While it can be successfully used for LD publication, which is its primary purpose, its usage for LD consumption is limited to expert users only, due to its lack of proper documentation, incomplete API coverage and proprietary configuration formats.
LinkedPipes ETL [75] (LP-ETL) is an open-source tool for design and execution of ETL (Extract, Transform, Load) pipelines (see Fig. 8), with a library of more than 60 reusable components which can be used in the pipelines and which very well support the Data manipulation and Data output requirement groups. The tool is primarily focused on working with RDF data and features a thorough documentation, including how-tos and tutorials for typical LD ETL scenarios. LP-ETL also helps the user, who still has to be a LD expert though, to build a data transformation pipeline using smart suggestions of components to use. LinkedPipes ETL is developed as a replacement for UnifiedViews.
Regarding the LD Consumption process, the most notable features are its capability of working with larger data using so called data chunking approach [73] satisfying C 12.5 SPARQL: advanced download. In the Developer and community support requirements group, the satisfaction of C 31.3 Full API coverage and C 32.2 Configuration in RDF means that the tool can be easily integrated with other systems.
LinkedPipes ETL does not support the user in Dataset discovery or Data visualization.
OpenCube
OpenCube [65] (OC) is an open source project, which supports publication of statistical data using the RDF Data Cube Vocabulary and also provides visualizations and data analytics on top of the statistical cubes. OpenCube wraps another tool, the Information Workbench [57], and thus it has all the functionality provided by Information Workbench (see Fig. 9).

OpenCube user interface in Information Workbench.
OpenCube also integrates several other tools such as R and Grafter. The created visualization can be embedded into an HTML page as an interactive script.
Datalift [49] (DL) aims at semantic lifting of non-RDF data, but it can be also used to consume RDF data. It uses projects to group different data sources together and it allows users to perform transformations such as SPARQL CONSTRUCT, String to URI, IRI translation and Silk link discovery, supporting Data manipulation. Finally, it provides visualizations and RDF and CSV data export, fulfilling Req. 26 Visualization, Req. 27 RDF dump output, and Req. 30.1 CSV file output, respectively.

Datalift user interface.
The web-based user interface is simple and user friendly (see Fig. 10). Datalift provides out of the box manual visualization with support for several chart types like line chart, table chart, bar chart, timeline, tree map, geographical map, etc.
LODLaundromat [18] (LAUN) is an open–source service, with web user interface (see Fig. 11), designed to provide access to Linked Open Data. It aims to tackle the problem of data quality by converting the data into a single format, removing duplicates and blank nodes and by fixing syntax errors.

LOD Laundromat data input user interface.
Users can submit data via custom URLs for processing and cleaning. Once the data is clean, it can be downloaded or queried using a linked data fragments interface. LODLaundromat has strong support in the Data input functionality. As data output, it only supports C 27.3 N-Triples file dump.
Linked Data Reactor [67] (LDR) is a framework consisting of user interface components for Linked Data applications. It is built to follow the Flux56

LD-R user interface.
Nevertheless, once set up, most of the functionality is non-LD expert friendly. LD-R mainly covers requirements in the Data input and Data visualization sections.
SemFacet [6] (SF) is an open–source tool implementing semantic facet based search system. The tool has a web-based user interface (see Fig. 13) and it is designed solely for the purpose of searching, with focus on faceted search. User can import custom data and an OWL ontology. SemFacet then utilizes the provided ontology to enhance the facet based search.
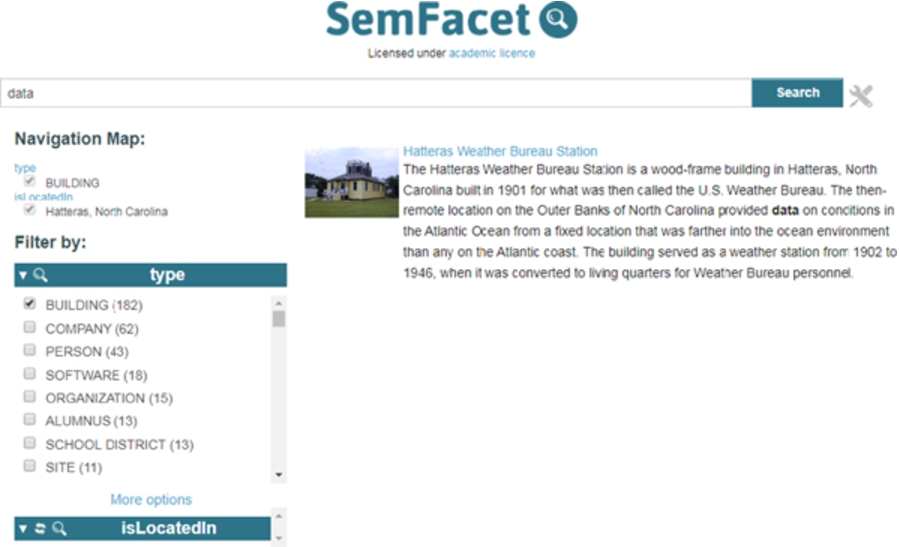
SemFacet user interface.
As the main focus of SemFacet is search, it offers functionality mainly in the area of Data input and it fulfills C 4.2 Faceted search.
ESTA-LD [93] (ELD) is a web-based application for viewing RDF data cubes with spatial and temporal data. ESTA-LD automatically searches the user provided SPARQL endpoint and provides the user with selection of graphs and datasets found in the endpoint. The user can also select measures, temporal and spatial information that is visualized (see Fig. 14).

ESTA-LD user interface.
Most of the ESTA-LD functionality is domain specific, focused on data cubes and spatial and temporal data. From the point of view of an LDCP it supports the user in the area of Data input and it fulfills C 26.3 Vocabulary-based visualization.
PepeSearch [139] (PEPE) is an open-source tool for LD exploration. It consists of two main components: a tool for preprocessing data in a given SPARQL endpoint and a web–based application (see Fig. 15). After preprocessing the data with the tool, the user can add it to the web–based application and explore it. In the exploration phase the user can select classes, properties and relations that are visualized in the form of an HTML table.
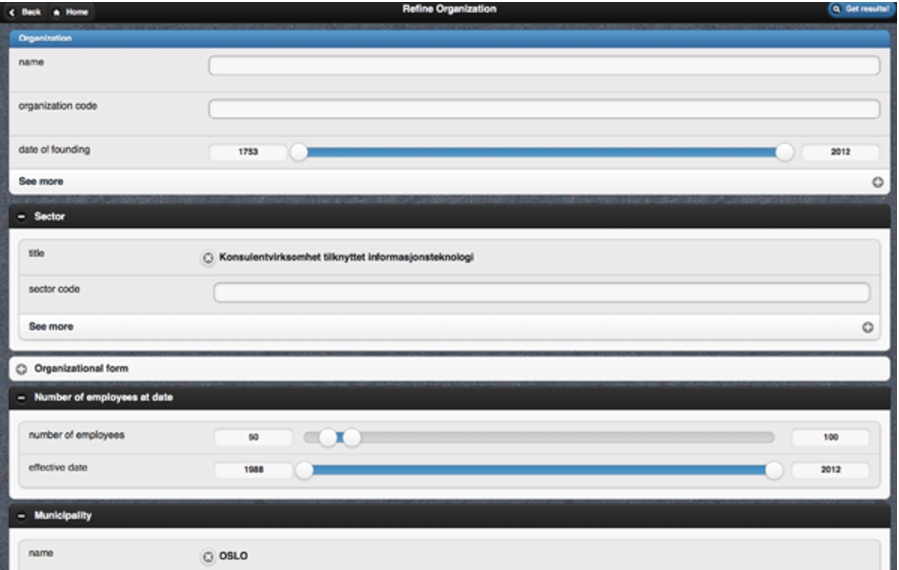
PepeSearch user interface.
The web-application mostly fulfills C 9.2 Schema extraction. The schema is created by the preprocessing tool, that provides the application with the Data input functionality.
FAGI-gis [55] (FAGI) is an open-source tool for fusion of RDF spatial data supported by a W3C community and business group.58

FAGI-gis user interface.
In terms of the identified LDCP requirements, FAGi-gis supports the areas of Data input, Data visualization and Data output, and implements C 20.2 Resource fusion.
RDFpro [32] (RDFPRO) is an open-source tool for transformation of LD. The transformation process is described in a script and can be executed using a command line or web-based interface (see Fig. 17).
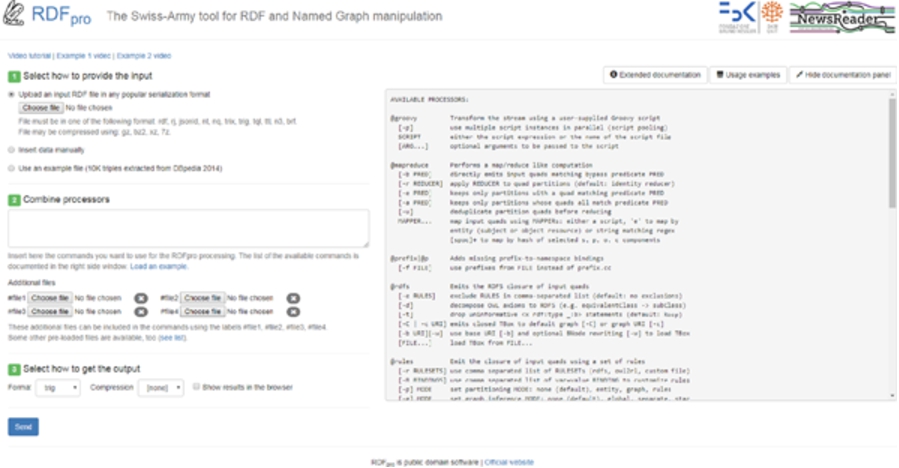
RDFpro user interface.
The main advantage of RDFpro is the performance which can be archived during the LD transformation satisfying C 13.8 Handling of bigger files. RDFpro also supports the user mainly in Data input, Semantic transformations and Data output.
As we have said earlier in the introduction, we show in this section which of the evaluated tools are LDCP – either in the minimal sense specified in the introduction or with some additional features relevant for the consumption process. We introduced three conditions each LDCP must fulfill.
Requirement scores of evaluated candidates from the point of view of non-LD experts. Empty cells represent 0%. Requirements are grouped according to sub-sections of Section 4
Requirement scores of evaluated candidates from the point of view of non-LD experts. Empty cells represent 0%. Requirements are grouped according to sub-sections of Section 4
Requirement scores of evaluated candidates from the point of view of LD experts. Empty cells represent 0%. Requirements are grouped according to sub-sections of Section 4
(Continued)
(Continued)
Second, the tool must be able to provide the loaded data on output either in the form of a visualization or represented in some non-RDF data format. In terms of our requirements it means that the tool must fulfill the requirement Visualization (i.e. a visualization of the data) or the requirement Non-RDF data output (i.e. output of data in a non-RDF format).
Third, non-LD experts must be able to use both features without any knowledge of LD technologies. In the introduction, we have explained that this means that the tool provides a user interface which does not require the users to know the RDF model, its serializations or the SPARQL query language.
We denote tools which meet the three conditions as LDCPs. However, the tools which fulfill only the first and the second condition are also important. They support the basic LD consumption activities but only LD experts can use them because the tools assume the knowledge of the RDF data model, its serializations or the SPARQL query language.
Requirement fulfillment for LDCP specific requirements. ✓means fulfillment for experts, ✓✓means fulfillment for non-LD experts
Table 5 shows evaluation of the above mentioned requirements important for identifying LDCPs. For each requirement and evaluated tool it shows the maximum result achieved for any of the criteria defined for the requirement. The detailed evaluation of individual criteria is presented in Table 6, Table 7 and Table 8 in Appendix A. The value ✓✓means that at least one criterion defined for the requirement is satisfied by the tool in a way usable for non-LD experts. The value ✓means that at least one criterion defined for the requirement is satisfied by the tool in a way usable for LD experts but there is no criterion satisfied in a way usable for non-LD experts. Therefore, the evaluation presented in Table 5 shows that
the tools LinkedPipes Visualization, V2, Sparklis, OpenCube, LD-R, ESTA-LD and FAGI-gis are LDCPs because they enable non-LD experts to load LD and visualize them,
the tool Datalift is an LDCP because it enables non-LD experts to load LD and provides an output in a non-RDF data format, and
the tools VISU, YASGUI, UnifiedViews and LinkedPipes ETL are not LDCPs but they can be used for LD consumption by LD experts only. These tools support the minimal features for LD consumption. However, they provide these features only for LD experts.
Table 3 and Table 4 show that some of these tools also support additional features represented by the other requirements. Table 3 shows which additional requirements are fulfilled to which extent by the tools from the point of view of non-LD experts. Table 4 shows this from the point of view of LD experts.
Table 5 shows that the rest of the evaluated tools, i.e. LODLaundromat, SemFacet, PepeSearch and RDFpro cannot be considered as LDCPs because they do not provide neither a visualization nor a non-RDF representation on the output. However, Table 5 shows that LODLaundromat and RDFpro provide an RDF output in the form of a dump. Moreover, RDFpro provides also its RDF output in a SPARQL endpoint. Therefore, both tools can be combined with the LDCPs mentioned above because their RDF output may serve as input for the LDCPs. Also the tools UnifiedViews and LinkedPipes ETL, which are classified above as LD consumption tools for LD experts, provide an RDF output and, therefore, can be combined with the LDCPs. And also the LDCPs OpenCube, Datalift and FAGI-gis provide an RDF output so it is possible to combine them with other LDCPs.
Figure 18 summarizes the above discussion. The tools displayed in green boxes were classified as LDCPs. The tools in blue boxes were classified as tools which support LD experts in LD consumption but they are not suitable for non-LD experts and, therefore, they are not LDCPs. The tools in gray boxes provide some additional features which are relevant for LD consumption. As shown in Table 5, they provide some features suitable even for non-LD experts. The tools on the left hand side of Fig. 18 provide an RDF output which can be used as an RDF input for the other tools in the figure. This is depicted by the connecting arrows with the label extends.
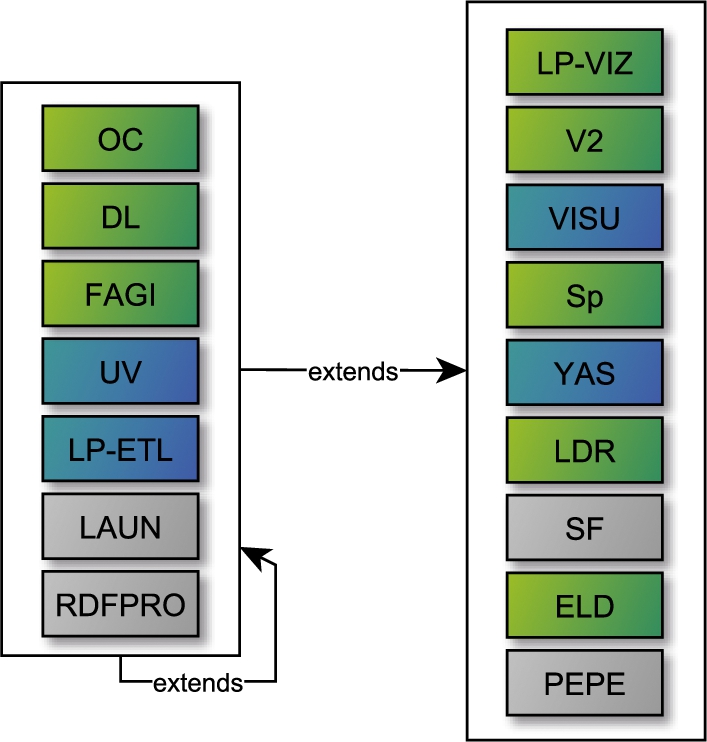
Classification of evaluated tools: (green) tools classified as LDCPs, (blue) tools supporting LD experts in LD consumption and (gray) tools providing additional LD consumption features. The arrows show that tools in their source provide an RDF output which can be consumed as an input of tools in their target.
In total, we identified 8 LDCPs which is not a small number. Moreover, all evaluated tools have significant added value for LD consumers. In summary, all evaluated tools enable users to load LD and perform some useful actions, at least to preview the loaded LD in case of PepeSearch. There are tools providing automated visualization of published data (LinkedPipes Visualization), manual visualization of published data (V2, VISU), exploration of given data (Sparklis), SPARQL query building capabilities (YASGUI) and then there are tools mainly focused on publishing LD, which can also be used for LD consumption (UnifiedViews, LinkedPipes ETL, OpenCube, Datalift).
However, the evaluation presented in Table 3 and Table 4 also shows that there is a lack of tools covering certain steps of the LD consumption process even for LD experts. In the category of Dataset discovery, there are no tools providing dataset search capabilities built on top of LD principles which is demonstrated by the fact that no tool fulfills requirements Catalog-free discovery, Search query expansion and Search results extension. The existing tools are limited to requiring a link to an RDF dump or a SPARQL endpoint from their users as an input, which could, ideally, be provided by the dataset discovery techniques. OpenCube supports dataset discovery but only on top of CKAN APIs which is a proprietary non-LD API.
The evaluated tools do not inform users about quality of LD as there are no tools fulfilling the requirement Quality indicators. No tools support users in management of provenance information and licensing which can be seen from the evaluation of the requirements Provenance and License management. The tools do not support users in change and version management which is shown by requirements Monitoring of changes in input data and Version management not fulfilled by any of the tools. These parts of the LD consumption process are well covered by existing W3C standards and literature as we have shown in Section 4 but this theory is not reflected by the tools.
In the category of Developer and community support, 8 of the 16 evaluated tools passed C 33.4 Community activity, the rest is not actively maintained. However, most of the tools, 13, have their source code in a publicly accessible repository. What could be improved is the presence of well-known repositories for plug-ins and projects, where most of the evaluated tools do not have one, and which could boost community adoption.
If we restrict ourselves only to the non-LD expert view presented in Table 3 we must conclude that the current tools support non-LD experts insufficiently in the LD consumption activities, with only basic search interfaces and visualization capabilities. This enables non-LD experts to consume LD in a limited way, i.e. load given LD and visualize them somehow. However, the tools do not provide the non-LD experts with features which would enable them to exploit the full range of benefits of LD. They still have the only possibility which is learning LD technologies.
In this section we go over related work in the sense of similar studies of LD consumption possibilities. We structure related work to two parts. First, there are existing surveys of research areas which correspond to some parts of our LD consumption process. We summarize them in Section 6.1. We recommend them to our readers as more complete overviews of existing research literature in these concrete areas. For each survey we show related requirements from Section 4. However, not all areas related to LD consumption are covered by surveys. In this paper we do not aim at doing a complete survey of research literature for these areas. We only describe selected works in these areas or W3C Recommendations to support our introduced requirements.
Second, there are works which are surveys of software tools which can be used for LD consumption. These tools are close to our survey presented in this paper. We summarize them in Section 6.2 and we compare them to ours.
Complementary surveys
The Survey on Linked Data Exploration Systems [84] provides an overview of 16 existing tools in three categories, classified according to 16 criteria. The first category represents the LD browsers, the second category represents domain-specific and cross-domain recommenders, which should be considered for integration into an LDCP regarding e.g. our Req. 6 Search results extension. The third category represents the exploratory search systems (ESS) which could be considered for inclusion into an LDCP regarding Req. 2 Catalog-free discovery. A recent survey on RDF Dataset Profiling [44] surveys methods and tools for LOD dataset profiling. The survey identifies and compares 20 existing profiling tools which could be considered for inclusion into an LDCP regarding Req. 2 Catalog-free discovery. The surveyed systems help to find the data the user is looking for. However, in the scope of an LDCP, this is only the beginning of the consumption, which is typically followed by processing of the found data leading to a custom visualization or data in a format for further processing.
In [125] authors introduce a system which provides a visual interface to assist users in defining SPARQL queries. The paper compares 9 existing software tools which provide such assistance to the users. These tools could be integrated into an LDCP to cover Req. 3 Search query language and Req. 4 Search query formulation assistance.
A recent survey on Ontology Matching [102] indicates there is a growing interest in the field, which could prove very useful when integrated into an LDCP, covering Req. 17 Semantic relationship analysis and Req. 18 Semantic relationship deduction.
A survey on Quality Assessment for Linked Data [144] defines 18 quality dimensions such as availability, consistency and completeness and 69 finer-grained metrics. The authors also analyze 30 core approaches to LD quality and 12 tools, which creates a comprehensive base of quality indicators to be used to cover Req. 10 Quality indicators. One of the quality dimensions deals with licensing, which can be a good base for Req. 25 License management, which is, so far, left uncovered.
A survey on Linked Data Visualization [35] defines 18 criteria and surveys 15 LD browsers, which could be used to cover the discovery Req. 2 Catalog-free discovery and the visualization Req. 26 Visualization.
In Exploring User and System Requirements of Linked Data Visualization through a Visual Dashboard Approach [88] the authors perform a focus group study. They aim for determining the users’ needs and system requirements for visualizing LD using the dashboard approach. The authors utilize their Points of View (.views.) framework for various parallel visualizations of LD. They also emphasize the heterogeneity of LD and the need for highly customized visualizations for different kinds of LD, which supports our Req. 8 Preview based on vocabularies, and Req. 26 Visualization.
Surveys of LD consumption
Close to our presented survey is a recent survey on The Use of Software Tools in Linked Data Publication and Consumption [13]. The authors assume a LOD publication process as well as a LOD consumption process, both taken from existing literature. They do a systematic literature review to identify existing software tools for LOD publication and consumption. They identify 9 software tools for publication and consumption of LOD. Their survey differs from ours in many aspects. First, 9 evaluated tools were published between years 2007–2012, and one is from 2014. We evaluate tools from 2013 or newer. Second, the authors evaluated how each tool supports individual steps in both processes. However, evaluation criteria are not clear. The paper does not present any requirements nor criteria, only steps of the processes. It is not clear how the authors evaluated whether a given tool supports a given step. The only detail present is evaluation of supported RDF serialization formats. Therefore, our study is more detailed and precise. Third, they evaluate the tools only based on the papers where the tools are described. It is not described whether tools were installed and used. In our study, this is one of the selection criteria. Therefore, our work is more useful for the community not only because it is more recent, detailed and precise but also because it informs the readers about the tools which can be actually used and which requirements they really cover in their run-time.
Another close paper is our own study [74] conducted at the end of 2015 which contains a brief survey on the same topic. The novel survey presented in this paper is its significant extension. We describe the LD consumption process and compare it to the existing literature. We revise the evaluation requirements, put them into the context of the LD consumption process and make their evaluation more precise and repeatable by introducing exact evaluation criteria. Both the requirements and the criteria are now supported by existing literature and W3C Recommendations. In [74] the evaluated tools were selected based on a quick literature survey while in this paper we selected the tools based on a systematic, deep and repeatable survey. The evaluation results are presented in a bigger detail. Last but not least, the evaluated tools in this paper are more recent and we recently (Nov 2017) checked their availability.
Conclusions
In this paper, we identified the need for a software tool which would provide access to Linked Data to consumers who are experts in data consumption or processing but not experts on LD technologies. We call such software tool a Linked Data Consumption Platform (LDCP) and the target consumers non-LD experts. We motivated our work by a task given to data journalists who need to write an article about population of European cities and who want to attach data in a CSV file to the article. Based on the current literature and W3C standards related to LD consumption we described the LD consumption process, and in turn we defined 34 requirements on tools implementing it, which were further split into 94 evaluation criteria. Then we performed a survey of 110 existing tools, which after 3 elimination rounds ended in 16 tools which we evaluated using all criteria. We evaluated the tools from the point of view of non-LD experts as well as LD experts.
We identified 8 software tools which can be classified as an LDCP, i.e. a tool which enables non-LD experts to consume LD at least in a minimal sense. This minimal sense means that the tool has the ability to load selected LD and present it in the form of a data visualization or a representation in a non-RDF format, e.g., CSV. Moreover, we have shown that the rest of the evaluated tools, even not classified as an LDCP, support either LD experts in LD consumption or both kinds of users in certain parts of the LD consumption process. We have also shown that the tools can be combined together because many of them provide RDF output which can be used as input by other tools.
On the other hand, we have also shown that there are still significant steps in LD consumption which are covered by the existing tools insufficiently (see Table 3 and Table 4). Basic LD consumption activities are already supported by the existing tools. However, non-LD experts still cannot exploit many benefits of the LD principles and technologies. This poses a problem for LD adoption, as consumers often still find consuming 3-star data such as CSV files more comfortable than working with LD. At the same time, the potential LD publishers are having a hard time convincing their superiors to invest the additional effort into LD publication, when there are no immediately appreciable benefits of doing so.
Without a proper LDCP, even experts willing to learn LD technologies are having a hard time seeing the benefits in processing RDF files using SPARQL. Even for them it is still easier to process CSV files using their own scripts or their favorite tabular data processor.
Based on our evaluation we therefore conclude that there are large gaps in multiple areas of LD consumption, especially for non-LD experts, which yet need to be bridged by non-LD expert friendly tools. These would enable the data consumers to exploit the advantages of working with LD, which would in turn motivate more data publishers to publish LD, as their consumers will immediately get a better experience. A suitable first step would be to implement a generic extensible open-source framework to provide support for more specific LDCPs. The framework would have to provide quality implementation of the minimal LDCP properties. These include loading LD in the various ways currently available, providing non-RDF output and providing a user interface suitable for non-LD experts. This framework could then be extended by the community in a modular “pay as you go” fashion implementing the requirements identified in Section 4.
Our survey may serve as an overview of expected functionality for anyone who would like to build a tool or integrate more existing tools for LD consumption or selected parts of the consumption process. It may also serve as a starting point for anyone interested in what benefits to expect when publishing data as LD.
Footnotes
Acknowledgements
This work was supported in part by the Czech Science Foundation (GAČR), grant number 16-09713S and in part by the project SVV 260451.
Tools evaluated using all criteria
Elimination rounds for potential candidates
(Continued)
| Tools/Round | 2 | 3 |
| [17] LinDA e | ✓ | E |
| [131] LinDA LinkDaViz f | ✗ | |
| [133] LinkedWidgets g | ✓ | U |
| [130] LinkSUM h | ✓ | U |
| [21] LODeX i | ✗ | |
| [18] LODLaundromat j | ✓ | ✓ |
| [92] LODmilla k | ✗ | |
| [43] LODSight l | ✓ | U |
| [96] LODVader m | ✗ | |
| [19] LOG (linked-open-graph) n | ✓ | E |
| [61] LOTUS o | ✓ | E |
| [75] LP-ETL p | ✓ | ✓ |
| [71] LP-VIZ q | ✓ | ✓ |
| [65] OpenCube r | ✓ | ✓ |
| [69] Payola s | ✗ | |
| [139] PepeSearch t | ✓ | ✓ |
| [62] ProLOD++ u | ✗ | |
| [12] QUaTRO v | ✗ | |
| [117] CODE Query Wizard w | ✗ | |
| [23] rdf:SynopsViz x | ✓ | E |
| [29] RDF4U y | ✓ | U |
| [32] RDFpro z | ✓ | ✓ |
| [9] Roomba aa | ✗ |
Criteria evaluation scenarios
In this section we describe in more detail the evaluation scenarios for our 94 criteria for tool evaluation. Each scenario is described by one or more PASS conditions and optional Prerequisites and examples of passing or failing the conditions. It is enough for the tool to pass one PASS condition to pass the criterion.
1.1 CKAN API The tool can load metadata from a CKAN catalog using its API. Load metadata from CKAN catalog with URL 1.2 RDF metadata in dump The tool is able to load VoID, DCAT, DCAT-AP or Schema.org dataset metadata from a file or a URL. The tool loads DCAT-AP metadata from a file or a URL, e.g. 1.3 Metadata in SPARQL endpoint The tool is able to load VoID, DCAT, DCAT-AP or Schema.org dataset metadata from a SPARQL endpoint. The tool can import DCAT-AP metadata from https://www.europeandataportal.eu/sparql and show the user a list of datasets, which the user can use in the tool. 1.4 Metadata from IRI dereferencing The tool is able to load VoID, DCAT, DCAT-AP or Schema.org dataset metadata by dereferencing an IRI of a metadata resource. The tool can dereference IRI of 2.1 Dataset profiling The tool is able to discover datasets on the web and compute a profile of any kind. The tool informs the user about the discovered datasets. Given a URL of an RDF resource the tool can identify related resources and enables the user to use all of them as a dataset. The tool can only load datasets from an external catalog (not necessarily CKAN or DKAN). 3.1 Structured search form The tool offers search functionality. The tool provides a structured search form to enable the user to restrict metadata values of the searched datasets. The tool presents the result of the search operation to the user. 3.2 Fulltext search The tool provides an input field where the user can specify a full-text query to search for datasets. The tool presents the result of the search operation to the user. 3.3 Natural language based intent expression The tool provides an input field where the user can specify a query in a natural language to search for datasets. The tool presents the result of the search operation to the user. 3.4 Formal language based intent expression The tool provides an input field where the user can specify a query in a formal language to search for datasets. The tool presents the result of the search operation to the user. 4.1 Seach query automated suggestions 3.1 Structured search form or 3.2 Fulltext search or 3.3 Natural language based intent expression or 3.4 Formal language based intent expression When the user types a search query, the tool automatically suggests some parts of the search query. The tool can automatically suggest predicates or classes based on prefixes when the user types a search query expressed in a formal query language. The tool can automatically suggest parts of sentences when the user types a search query expressed in a natural language. 4.2 Faceted search The tool allows users to search for datasets. The tool shows filters (facets) the user can use to (re)formulate the search query. The user can specify time/spatial coverage of a dataset. The tool provides the user with a list of all values for a certain predicate and lets the user to select the required values. The tool provides only a visualisation with filters that can be used to restrict the values being visualized, outside of the context of datasets search. 5.1 Search query expansion 3.1 Structured search form or 3.2 Fulltext search or 3.3 Natural language based intent expression or 3.4 Formal language based intent expression The tool expands the search query provided by the user with additional resources (e.g., concepts, properties, classes). The tool provides a check-box which enables the user to switch on the query expansion. Before or after evaluating the search query, the tool shows the expanded version of the query and it informs the user that it is an expanded version of the original query provided by the user. 6.1 Search results extension 3.1 Structured search form or 3.2 Fulltext search or 3.3 Natural language based intent expression or 3.4 Formal language based intent expression The tool extends the list of datasets which is the result of evaluating the given search query with additional semantically related datasets and it informs the user about the extension. After the result of evaluation of the given search query is displayed by the tool, the user can click on a button to see additional semantically related results. The tool displays a list of additional semantically related datasets below the list of datasets discovered by evaluating search query. Both lists are visually separated from each other in some way. The tool only implements a “show more” button that shows additional items (pagination) from the result set. 7.1 Content-based dataset ranking The tool allows users to search for datasets. The tool orders the list of discovered datasets by a metric based on their metadata (e.g., publisher, update periodicity, size) or content (e.g., different content quality metrics). 7.2 Context-based dataset ranking The tool allows users to search for datasets. The tool orders the list of discovered datasets by a metric based on their context which is formed by linked datasets. 7.3 Intent-based dataset ranking The tool allows users to search for datasets. The tool orders the list of discovered datasets by a metric based on the structural and/or semantic similarity or graph distance of their content or context (i.e. linked datasets) with resources in the search query. 8.1 Preview – W3C vocabularies The tool allows users to search for datasets. The tool offers the user additional information in the search result for each discovered dataset which is a visual or textual preview of the dataset. The preview is extracted from a part of the content of the dataset which is represented according to the specification of well-known W3C vocabularies For a dataset containing a SKOS hierarchy, the tool can show information about the SKOS hierarchy. 8.2 Preview – LOV vocabularies The tool allows users to search for datasets. The tool offers the user additional information in the search result for each discovered dataset which is a visual or textual preview of the dataset. The preview is based on vocabularies listed in LOV, similarly to the previous requirement. For a dataset containing Schema.org Geocoordinates, the user can click on a button and see an image on a map. 8.3 Preview metadata The tool allows users to search for datasets. In the query results view the user can see additional information for each dataset created based on the dataset metadata. 9.1 Preview data The tool can compute statistics (number of triples, etc.) or description of the dataset. 9.2 Schema extraction The tool can extract and visualize a schema used in a dataset. The tool can visualise schema extracted from the data. 10.1 Quality indicators The tool is able to provide user with any quality indicators. The tool shows that a dataset is available in 80% of time. 11.1 IRI dereferencing The tool can request content from given IRI using HTTP content negotiation. The tool can download representation of Prague from The tool can only download an RDF file from a server using simple HTTP GET. 11.2 Crawling 11.1 IRI dereferencing Given an IRI of an RDF resource the tool can download not only the given resource but also related resources. Given the resource 12.1 SPARQL: querying Given a SPARQL endpoint the tool can query it using predefined queries and process the results. 12.2 SPARQL: named graphs The tool enables the user to specify named graph present in the queried SPARQL endpoint by means other that specifying it in the user provided query. The tool allows the user to select or provide a named graph that is used to evaluate the query. 12.3 SPARQL: custom query User can provide custom SPARQL queries. 12.4 SPARQL: authentication User can provide credentials that are used for authentication/authorization on SPARQL endpoint. 12.5 SPARQL: advanced download The tool explicitly offers support for dealing with large SPARQL results set that can not be downloaded in a regular way due to endpoint limitations. The tool supports pagination. The tool supports the Virtuoso scrollable cursor technique. 13.1 RDF/XML file load The tool can load RDF data from a URL or a local file in the RDF/XML format. 13.2 Turtle file load The tool can load RDF data from a URL or a local file in the Turtle format. 13.3 N-Triples file load The tool can load RDF data from a URL or a local file in the N-Triples format. 13.4 JSON-LD file load The tool can load RDF data from a URL or a local file in the JSON-LD format. 13.5 RDFa file load The tool can load RDF data from a URL or a local file containing RDFa annotations. 13.6 N-Quads file load The tool can load RDF data from a URL or a local file in the N-Quads format. 13.7 TriG file load The tool can load RDF data from a URL or a local file in the TriG format. 13.8 Handling of bigger files The tool implements a strategy for processing of bigger RDF files. The tool implements streaming as a form of RDF processing. The tool can only handle loading of bigger files related to the size of the available memory. 13.9 CSV on the Web load The tool can load an uploaded CSV file accompanied by a CSVW JSON-LD descriptor. The tool can load data from a given URL of a CSVW JSON-LD descriptor that contains a reference to the CSV data file. The tool can load a CSV file from a given URL assuming the server also provides the CSVW JSON-LD descriptor in the location described by the CSV on the Web specification. 13.10 Direct mapping load Using the Direct mapping specification the tool can load data directly from a relational database. 13.11 R2RML load Using R2RML mapping the tool can load data directly from a relational database. 14.1 Linked Data Platform containers The user can provide a URL of an LDP container and the tool can extract data from it. The tool provides the user with loading options related to LDP containers. The tool offers an interactive wizard guiding user through process of data extraction. The tool simply downloads the content of a given URL without knowing that it represents the LDP container. 15.1 Monitoring of input changes: polling The tool can periodically check for changes in the data source. If there are changes, it can trigger an action. The tool can periodically use HTTP HEAD request using a given URL to detect changes and download data if any change occurs. The tool only provides support for periodical downloading of the dataset. 15.2 Monitoring of input changes: subscription The tool can subscribe to a service (data source, etc.) to receive notifications about data updates and trigger actions. The tool can subscribe to a data source using WebSub, and download new data whenever it is notified. 16.1 Manual versioning support The tool can store multiple versions of the same dataset. The user can work with any of them. 16.2 Automated versioning support The tool can automatically synchronize versions of a dataset with the data source. The tool can watch a Git repository containing RDF files. Upon change in the repository the tool can pull the new version of the data. The tool can only periodically delete and download the dataset to keep it updated to latest version. 16.3 Source versioning support The tool supports a protocol for asking for a data from a specified time instant/range. The tool supports the Memento protocol. 17.1 Shared resources analysis The tool can perform an analysis of shared resources among datasets. The tool can compute the number of shared resources among datasets. 17.2 Link analysis The tool can perform an analysis of links among datasets. The tool can compute the number of links among datasets. 17.3 Shared vocabularies analysis The tool can perform an analysis of vocabularies shared among datasets. The tool can show the names of shared vocabularies. The tool can show the shared predicates and classes among datasets. 18.1 Link discovery The tool provides support for (semi-)automated link discovery. Given two datasets the tool can discover and save new links between them. The tool embeds Silk. 18.2 Ontology alignment Given a source and a target vocabulary or ontology the tool can discover and save a mapping between them. 19.1 Vocabulary mapping based transformations The tool can transform data to another vocabulary using a mapping (for example OWL, R2R). 19.2 Vocabulary-based SPARQL transformations The tool can transform data to another vocabulary using a predefined SPARQL query. 20.1 RDFS inference Support inference based on inference rules encoded in the RDFS vocabulary. 20.2 Resource fusion Given the links between resources the tool can perform resource fusion and provide support for solving conflicts. The tool can only rename resources in one datasets so the they match the ones from the other dataset. The tool can only copy all predicates and values from one resource to another. 20.3 OWL inference Support inference based on inference rules described in OWL ontologies. 21.1 Assisted selection The tool provides a graphical interface for selection of data (filtering of resources using values) which the user can use to transform RDF data. The tool assists the user with formulating a SPARQL query in with a graphical query builder. The tool only provides a query editor in the form of a text area. The tool provides only a visualisations with filters, i.e. filters can not be used to transform data. 21.2 Assisted projection The tool provides a graphical interface for data projection (selecting properties) which the user can use to transform RDF data. The tool assists the user with formulating a SPARQL query in with a graphical query builder. The tool only provides a query editor in the form of a text area. The tool provides only a visualisations with filters, i.e. filters can not be used to transform data. 22.1 Custom transformations The user can transform data using custom transformations. User can transform data using a SPARQL query. User can transform data using a tool-specific language. 23.1 Automated data manipulation The tool provides the user with possible data transformations that were automatically generated or discovered. Given input data the tool can generate transformations pipelines. 24.1 Provenance input The tool is able to load the provenance information and employ it in some way. The tool can load and utilize provenance information using the PROV-O ontology. 24.2 Provenance output The tool supports data output functionality. Together with the data the tool can output provenance information using RDF and the PROV-O ontology or similar. 25.1 License awareness The tool is aware of licensing information present in dataset metadata and allows the user to see it. 25.2 License management 25.1 License awareness The tool can assists the user with combining datasets with different licenses. The tool notifies the user when datasets with different licenses are used together and lets the user select the license of the output. 26.1 Graph visualization The tool can visualize the graph structure of RDF data. 26.2 Manual visualization The tool allows the user to graphically visualize selected datasets. The tool requires user assistance to select properties, data sources, visualization types etc. The tool provides the user with a map visualization, however, the user must provide the tool with identification of labels, longitude and latitude properties and only then the tool can visualize the resources. 26.3 Vocabulary-based visualization The tool can explore datasets and offer the user an automatically generated visualization. The user does not have to provide any additional information besides which dataset to visualize. 27.1 RDF/XML file dump The tool allows the user to output data in the RDF/XML format. 27.2 Turtle file dump The tool allows the user to output data in the Turtle format. 27.3 N-Triples file dump The tool allows the user to output data in the N-Triples format. 27.4 JSON-LD file dump The tool allows the user to output data in the JSON-LD format. 27.5 RDFa file dump The tool allows the user to output data as an RDFa annotated file. 27.6 N-Quads file dump The tool allows the user to output data in the N-Quads format. 27.7 TriG file dump The tool allows the user to output data in the TriG format. 28.1 SPARQL Update support The tool can output a selected dataset to a remote SPARQL endpoint using SPARQL Update. 28.2 SPARQL: named graphs support 28.1 SPARQL Update support The user can specify the target named graph for SPARQL Update queries. 28.3 SPARQL: authentication support 28.1 SPARQL Update support The tool allows the user to provide credentials for access to a remote SPARQL endpoint. 28.4 SPARQL Graph Store HTTP Protocol output The tool can output a selected dataset to a remote endpoint using the Graph Store HTTP Protocol. 29.1 Linked Data Platform Containers Output The tool can output a selected dataset to a LDP container. The tool must allow the user to utilize the features of LDP when loading the data. 30.1 CSV file output The tool can output data in the CSV format. 30.2 CSV on the Web output The tool can output data in the CSV format along with its CSV on the Web JSON-LD descriptor. 30.3 XML file output The tool can output data in the XML format. 30.4 JSON file output The tool can output data in the JSON format. 30.5 Output for specific third-party tools The tool can output data in a way that the data can be loaded in a specific third-party software. The tool enables the user to export data as a specific CSV file with graph data for Gephi. The tool enables the user to export data specifically for Fuseki instead of a generic SPARQL endpoint. 31.1 Existence of API The tool has an API which enables other tools to work with it. Human designed RESTful API. Generated HTTP API used for communication with a client part of the tool, e.g. as in Vaadin. 31.2 API documentation 31.1 Existence of API There is a documentation for the API. 31.3 Full API coverage 31.1 Existence of API All the actions that can be performed by user interaction with the tool can also be performed throughout the API calls. 32.1 Configuration in open format The configuration of the tool, e.g. the projects it saves, is in an open format. 32.2 Configuration in RDF The tool, e.g. the projects it saves, can be configured using the RDF format. 33.1 Repository for source code There is a publicly available repository with the source code of the tool. 33.2 Repository for plugins The tool supports plug-ins. There is a publicly available plug-in repository. The tool supports a plug-in repository/marketplace from where the user can download and install new plugins. Git repository for plug-ins is mentioned in the documentation or referenced from the tool. 33.3 Repository for data processes There are projects, e.g. pipelines or workflows, created in the tool. There is a publicly available projects repository. The tool supports a project repository/marketplace from where the user can download or where the user can upload projects. Git repository for projects is mentioned in the documentation or referenced from the tool. 33.4 Community activity There were at least 2 commits from 2 persons in the last year across all the relevant repositories.