
Abstract
BACKGROUND:
Depression is a widespread, global problem, increasingly linked with vitamin D deficiency in the literature. However, a knowledge gap persists regarding the relationship between depressive symptoms and vitamin D intake.
OBJECTIVE:
To determine the association between vitamin D supplementation and depressive symptoms in adults (aged 18+ years).
METHODS:
This study consists of a systematic review and meta-analysis of randomized controlled trials (RCTs), published before January 2019. Pooled summary estimates and between-study heterogeneity were examined.
RESULTS:
Ten RCTs (total participants = 3336; median duration = 12 months) were included. An association was found between high vitamin D supplementation (≥4000 IU) and reduced depressive symptoms, but not in the case of lower levels of vitamin D supplementation (<4000 IU). Neither baseline serum vitamin D before supplementation, nor the depression-scoring scales used affected this association. The overall quality of evidence was graded as ‘moderate’.
CONCLUSIONS:
Vitamin D supplementation at greater than 4000 IU was observed to have a positive effect on depressive symptoms. Future efforts could focus on obtaining higher-quality evidence with standardized RCT methodologies to confirm this association.
Introduction
Globally, depression is the most common mental health disorder in the general population [1]. Around 350 million people worldwide suffer from depression [2], making it the third most common contributor to illness; currently predicted to become the most common contributor to illness by 2030 [3], with suicide or self-harm anticipated to increase mortality [4]. Various nutritional factors, including dietary intake of zinc, calcium, iron, chromium, B12, magnesium, folate, D-serine [5], and omega-3 PUFAs [6], are posited to offer some protection against depression by preventing its occurrence or reducing its severity. These nutritional factors are believed to achieve this by regulating specific receptors or signaling pathways in the brain that are associated with depression [5, 7]. In recent years, there has also been an interest in vitamin D (a fat-soluble steroid prohormone, formed when the skin is exposed to sunlight/ultraviolet-B radiation) and its role in reducing depression [8, 9].
Around 14% of the world’s total population is estimated to be deficient in vitamin D [10], due to a lack of (or reduced exposure to) sunlight, a sedentary lifestyle with little time spent outdoors, or low dietary intake [11, 12]. Although it is not fully understood how vitamin D regulates depressive symptoms, it is known that it crosses the blood-brain barrier [13, 14], and some vitamin D receptors in the brain (the limbic system, cerebellum, cortex) are known to be involved in the control of human emotion and behaviour. It has been observed that the vitamin D receptors in these regions of the brain affect serotonin and dopamine synthesis, this being important for regulation of depressive symptoms [13, 15].
Several observational studies suggest an association between vitamin D deficiency and increased incidence [16], prevalence [17], and severity [18, 19] of depression and mood disorders. However, it is still not clear if supplementing individuals with vitamin D will reduce such depressive symptoms. Several randomized controlled trials (RCTs) have produced mixed outcomes regarding the effect of vitamin D supplementation on depressive symptoms, with some RCTs reporting a reduction in these symptoms [20–22] and others contradicting these reports [23, 24]. As such, it is still unclear whether vitamin D supplementation is effective for the management of depressive symptoms [25, 26]. Consequently, the aim of this systematic review and meta-analysis is to determine whether there is an association between vitamin D supplementation and depressive symptoms in adults aged 18 or over. This will be attempted by synthesizing evidence from published RCTs. It includes subgroup analyses by vitamin D supplement dosage (<or ≥4000 IU), baseline vitamin D levels, and the application of different depression scales.
Materials and methods
This is a systematic review and meta-analysis of studies published in English and assessing the effect of vitamin D supplementation on depressive symptoms.
Search strategy and study selection criteria
The comprehensive search strategy adopted in this study is presented in Supplementary Table 1. Briefly, combinations of the following keywords were entered into the search engines of various electronic databases (PubMed, Medline, the Cochrane Library, Ovid, and the Science Direct Database) to identify eligible studies: “Adult”, “Adult*”, “Young*”, “Old adult”, “Geriatric”, “Elderly”, “Depression”, “Depression*”, “Depress*”,” Mood Disorder*”, “Dysthymi*”, “Depression symptoms”, “Adjustment Disorder*”, “Affective Symptoms”, “Vitamin D supplement”, “vitamin D”, “vitamin D2”, “vitamin D3*”, “1-alpha-hydroxy-vitamin D3”, “1,25 dihydroxyvitamin D3”, “1,25-dihydroxycholecalciferol”, “clinical trial*”, “trial”, “intervention”, “RCT”, and “randomized controlled trials”.
The articles retrieved through these searches were assessed against set eligibility criteria for inclusion in this current review. The following study selection criteria were applied:
Inclusion criteria
Exclusion criteria
The trials included in this study are summarized in Tables 1 2, while the excluded studies, along with the reasons for their exclusion, are presented in Supplementary Table 3.
Characteristics of the (n = 10) included studies –study populations, sample sizes (number of interventions vs. control groups)
Characteristics of the (n = 10) included studies –study populations, sample sizes (number of interventions vs. control groups)
First author, intervention, comparator, depression outcome measures, outcomes, duration of trials, SMD [95% conf. interval] of the studies according to vitamin D dosage and p-value
Two independent reviewers extracted the following data from the included studies: name of first author, year of publication, study design, and participants’ characteristics (age, gender, sample size, symptoms of depression, study area, baseline serum 25-hydroxy vitamin D (25[OH]D) outcome measures: mean depression scores before and after vitamin D supplementation). Details of the intervention and control groups were also extracted.
Data analysis
To compute the meta-analysis, STATA 14 statistical software was used. First, the difference in mean depression scores was obtained for both the intervention and control groups. This took place by subtracting the mean depression scores from the baseline mean depression scores, after vitamin D supplementation. The difference in means (SMD) between the intervention and control groups, as well as the pooled summary estimates, were obtained using random effect models. Sub-group meta-analyses were conducted (meta-regression) according to vitamin D supplement dosage (below and above 4000 IU, this being the Institute of Medicine’s upper limit for cholecalciferol [27], baseline vitamin D levels, and the various depression scales used to assess depressive symptoms. Between-study heterogeneity was also reported, together with the I-squared. Finally, a funnel plot was generated to assess publication bias, while Begg’s and Egger’s Tests were conducted to assess for statistical evidence of publication bias.
Risk of Bias in the included studies and quality assessment
Risk of bias was assessed by two independent authors, using the Risk of Bias Assessment Tool, as per Cochrane’s Handbook for Systematic Reviews of Interventions (Chapter 8) [28] and graded as ‘Low’, ‘High’ or ‘Unclear’, with the latter group indicating a lack of information or uncertainty over the potential for bias (Table 3). The grading of recommendations assessment, development, and evaluation (GRADE) approach was adopted to assess the quality of the evidence, with respect to each outcome measure [29]. The overall quality of evidence was graded as ‘High’, ‘Moderate’, ‘Low’ or ‘Very low’ [30, 31](Table 4).
Risk of biased assessment in the included trials (n = 10)
Risk of biased assessment in the included trials (n = 10)
GRADE evidence profile for the association of vitamin D supplementation with depression
1No adjustments for confounders in some studies and lack of generalizability of findings in several studies due to selected study populations. In addition, no blinding reported in a study. 2Significant heterogeneity and variability (I2). 3Single study assessed was a secondary analysis in a study primarily assessing the effect of vitamin D in patients with osteoarthritis rather than depression. 4Most especially with the CI measures of the SMD across the studies. 5No statistical or graphical evidence of publication bias. SMD –Standard mean difference.
Search outcomes
The electronic database search returned 1226 trials, with 780 records remaining after duplicates were removed. Once the trials that did not conform to the inclusion criteria were removed, 104 studies remained. Of these, 50 studies were excluded (see Supplementary Table 3 for a list of excluded studies with the reasons for their exclusion), and 54 trials were assessed for eligibility. A further 44 full-text articles were excluded (Supplementary Tables 2 and 3). The main reasons why studies were excluded consisted of the population or sample size (for example, small sample sizes, child and adolescent populations, participants diagnosed with or being treated for depression or other psychiatric issues, and participants with other health issues potentially impacting vitamin D), the study design or intervention (for example, non-randomized trials, vitamin D supplements combined with other supplements or medications, participants not taking vitamin D supplements, and the absence of a control group), and outcome (for example, the outcome of interest did not consist of depressive symptoms, a depression scale was not used). Once the full-text articles had been read, 10 trials were found to meet the inclusion criteria for this meta-analysis, as illustrated in the PRISMA flowchart (Fig. 1).
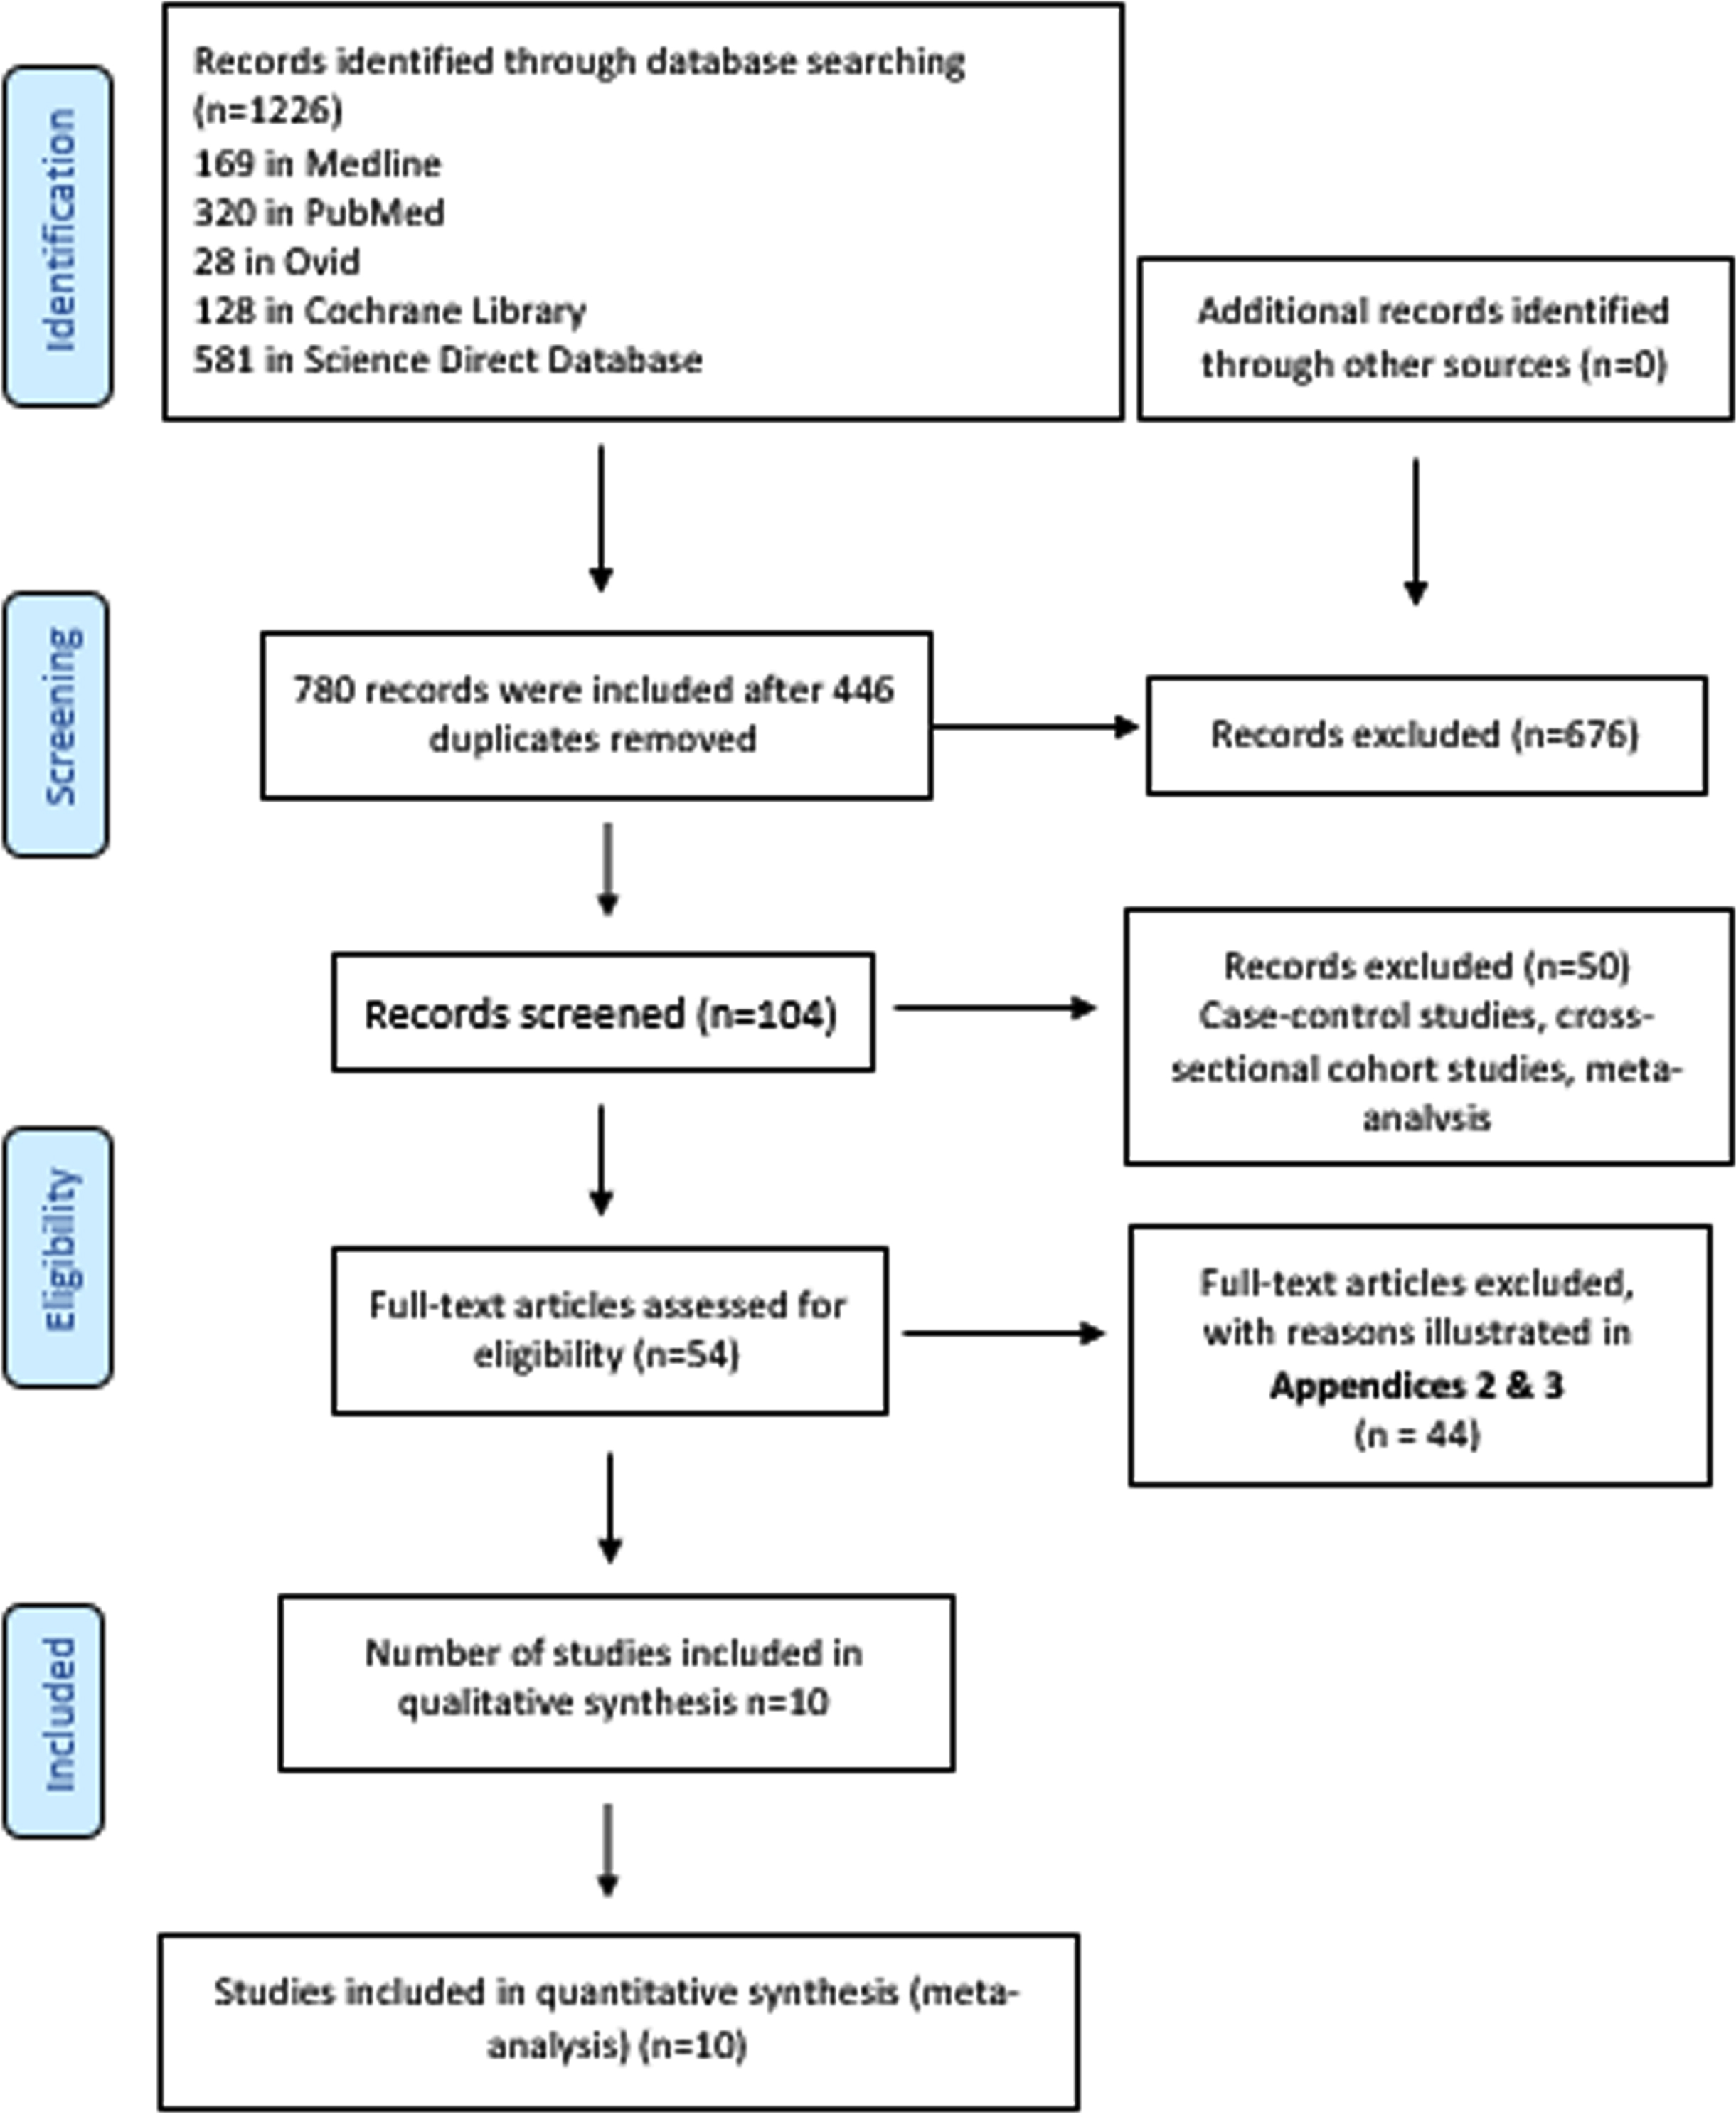
Identification process for eligible trials according to the PRISMA flowchart [51].
A total of 10 studies (9 double-blinded; 1 single-blinded) were included in the meta-analysis. The characteristics of the included trials are presented in Table 1. Together, these 10 RCTs consisted of 3336 participants (1673 controls versus 1663 cases). Vitamin D supplementation was administered orally in the double-blinded RCTs [13, 32–37] and intramuscularly in the single-blinded RCT [38]. The vitamin D supplementation dose ranged from 400 IU/d to 300,000 IU/d. As revealed by the funnel plot, there was no graphical evidence of publication bias, with all studies falling within the 95% confidence interval (CI). Likewise, the Begg’s and Egger’s Test results were negative for publication bias (p = 0.138 and p = 0.373, respectively) (Supplementary Figure 1).
Meta-analysis and meta-regression/sub-group analyses
No statistically significant difference was identified between the pooled SMD for the intervention groups’ mean depression scores, compared to the control groups (SMD = 0.055, 95% CI: –0.008–0.117, p = 0.089) (Fig. 2), and there was no between-study heterogeneity (I2 = 0% and heterogeneity of p = 0.803). A statistically significant SMD was found between the intervention and control groups’ mean depression scores when studies were classified by vitamin D supplement dosage, with a statistically significant improvement in mean depression scores where doses of ≥4000 IU of vitamin D were administered (SMD: 0.116 [95% CI: 0.015–0.218], p = 0.024, with I-squared = 0% and p = 0.852). However, this was not found in studies where vitamin D doses of <4000 IU were administered (SMD 0.016 [95% CI: –0.065–0.096], p = 0.702, with, I-squared = 0% and p = 0.702) (Fig. 3).
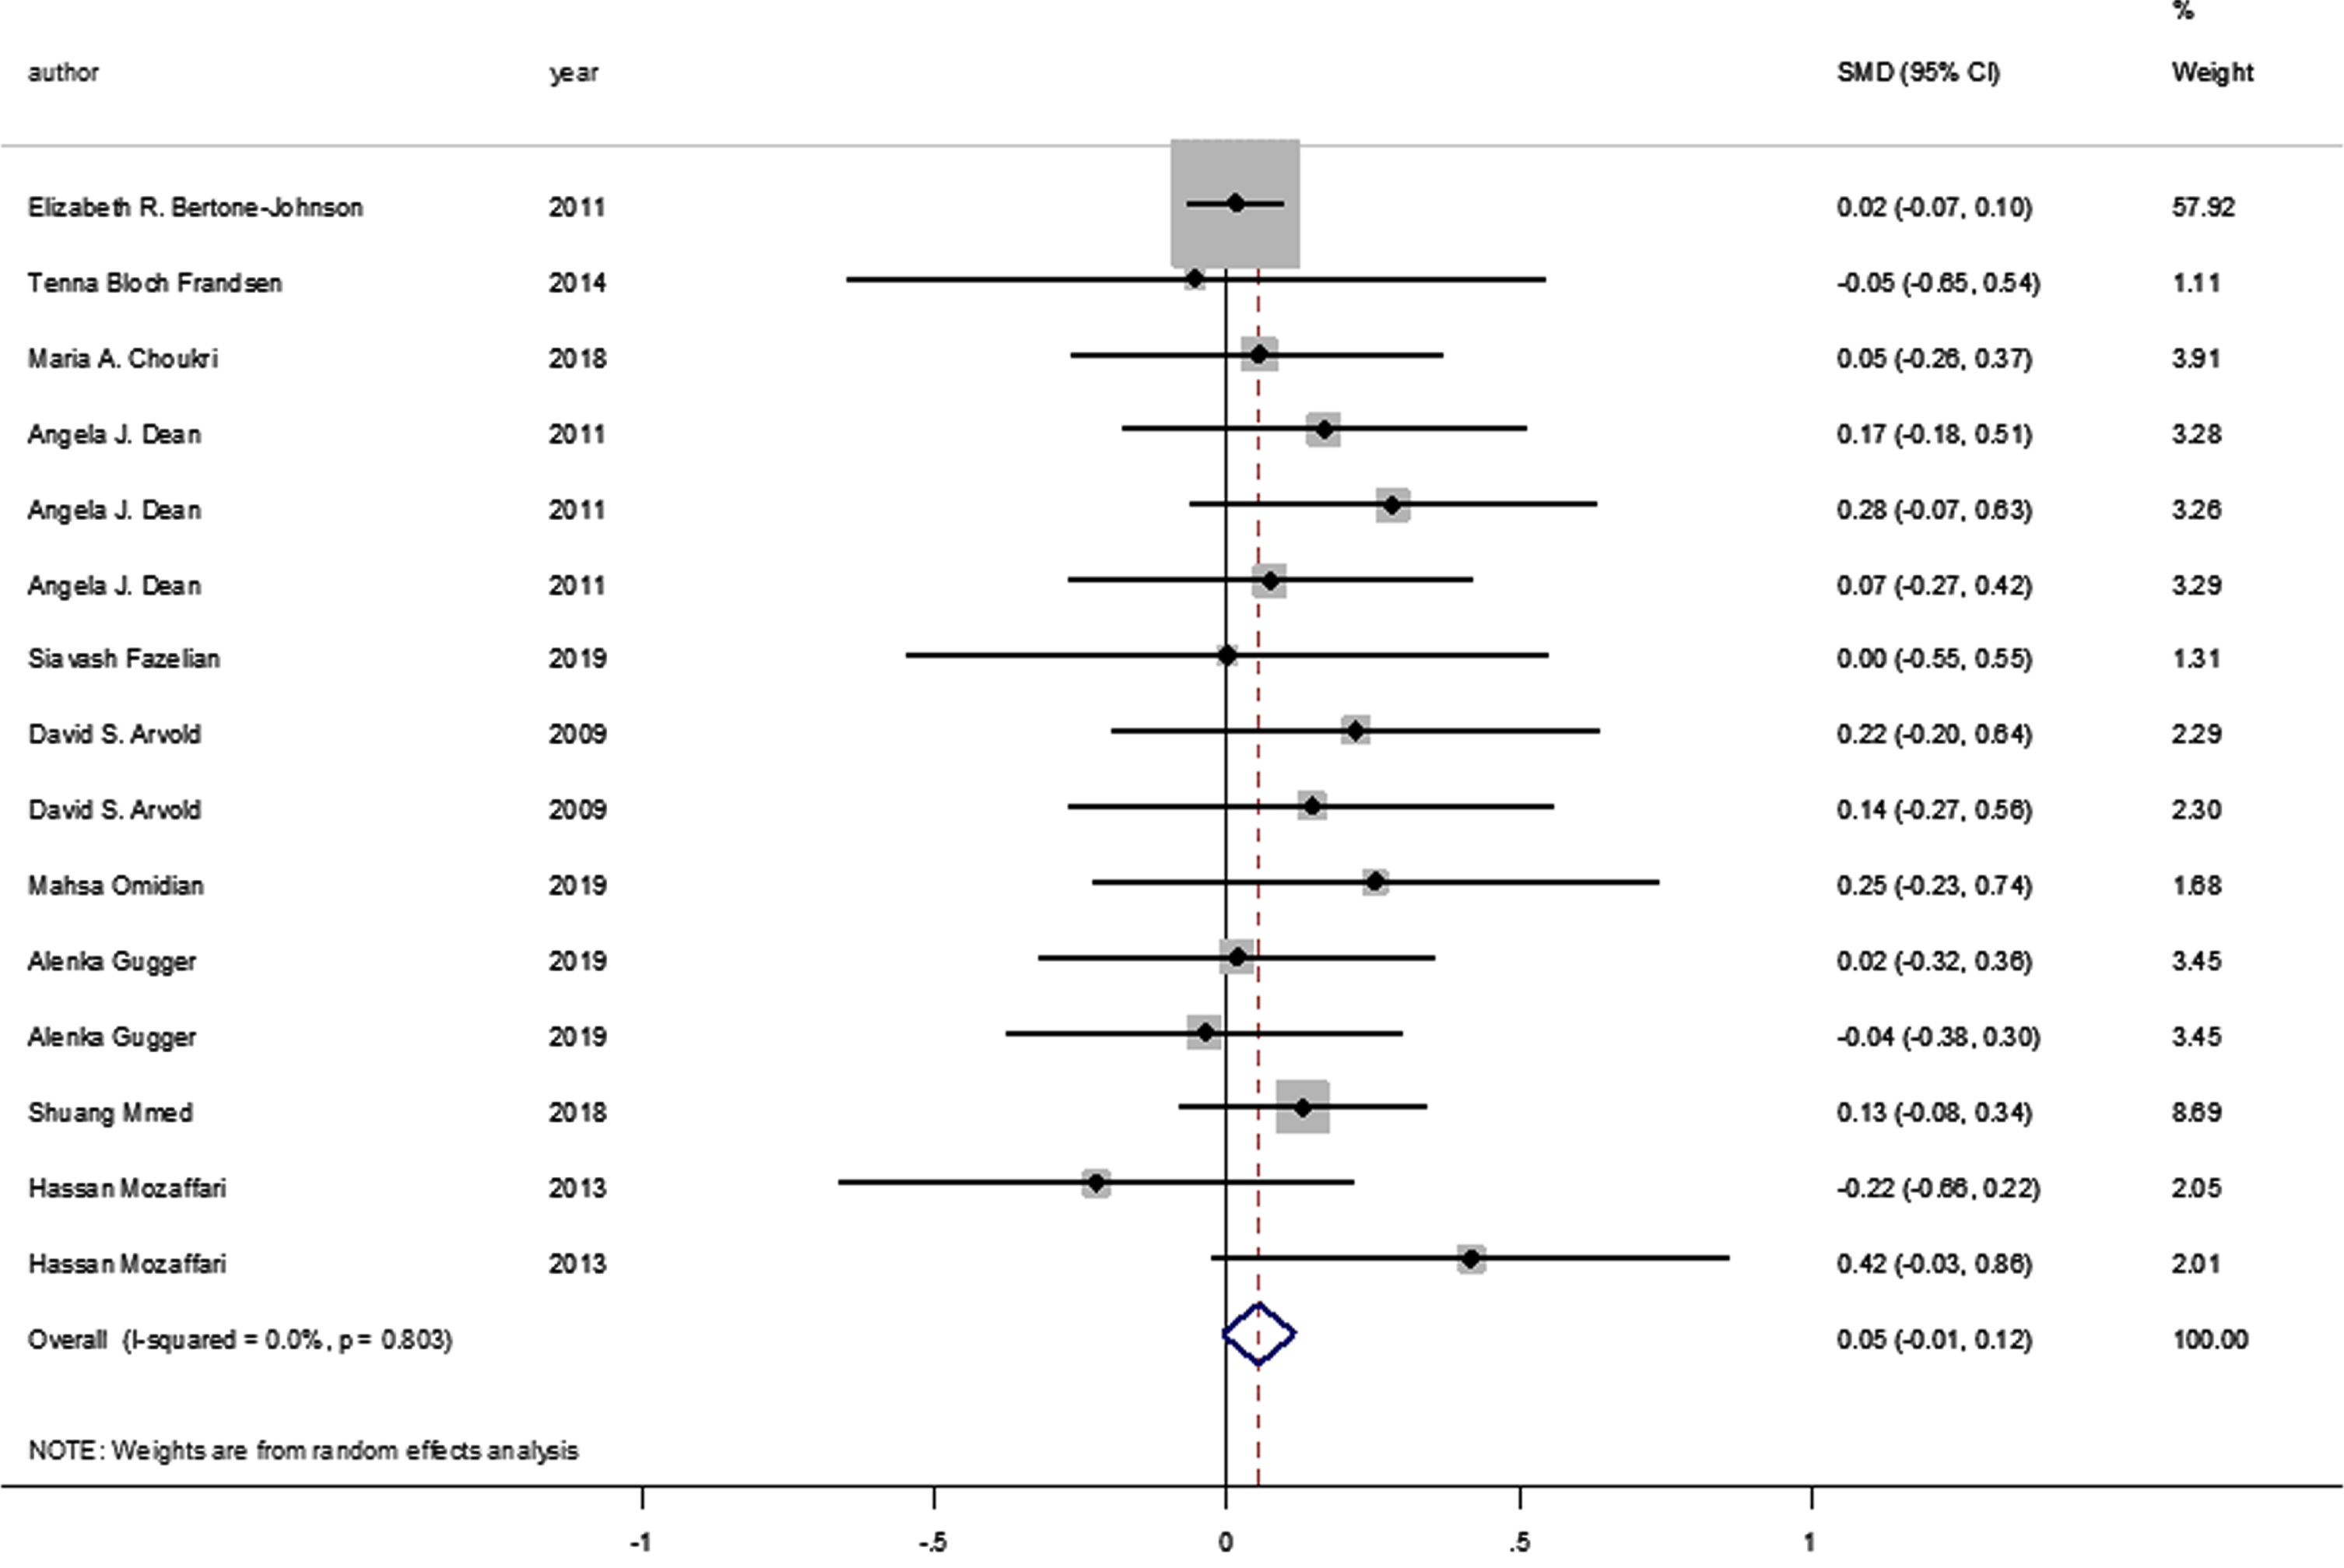
Forest plot of studies comparing the impact of administering vitamin D and a placebo to participants for depressive symptoms. Summary estimates consist of the SMD for differences in mean depression scores obtained from the respective studies, before and after administering vitamin D treatment to the intervention group, compared to a control group. The solid line on the forest plot is the point of no effect (SMD = 0), and the dashed line represents the overall pooled estimate. The grey squares and horizontal lines represent the odds ratios for each study and their 95% CI. Meanwhile, the size of the grey square represents the weight contributed by each study in the meta-analysis, and the diamond represents the pooled SMD and its 95% CI.
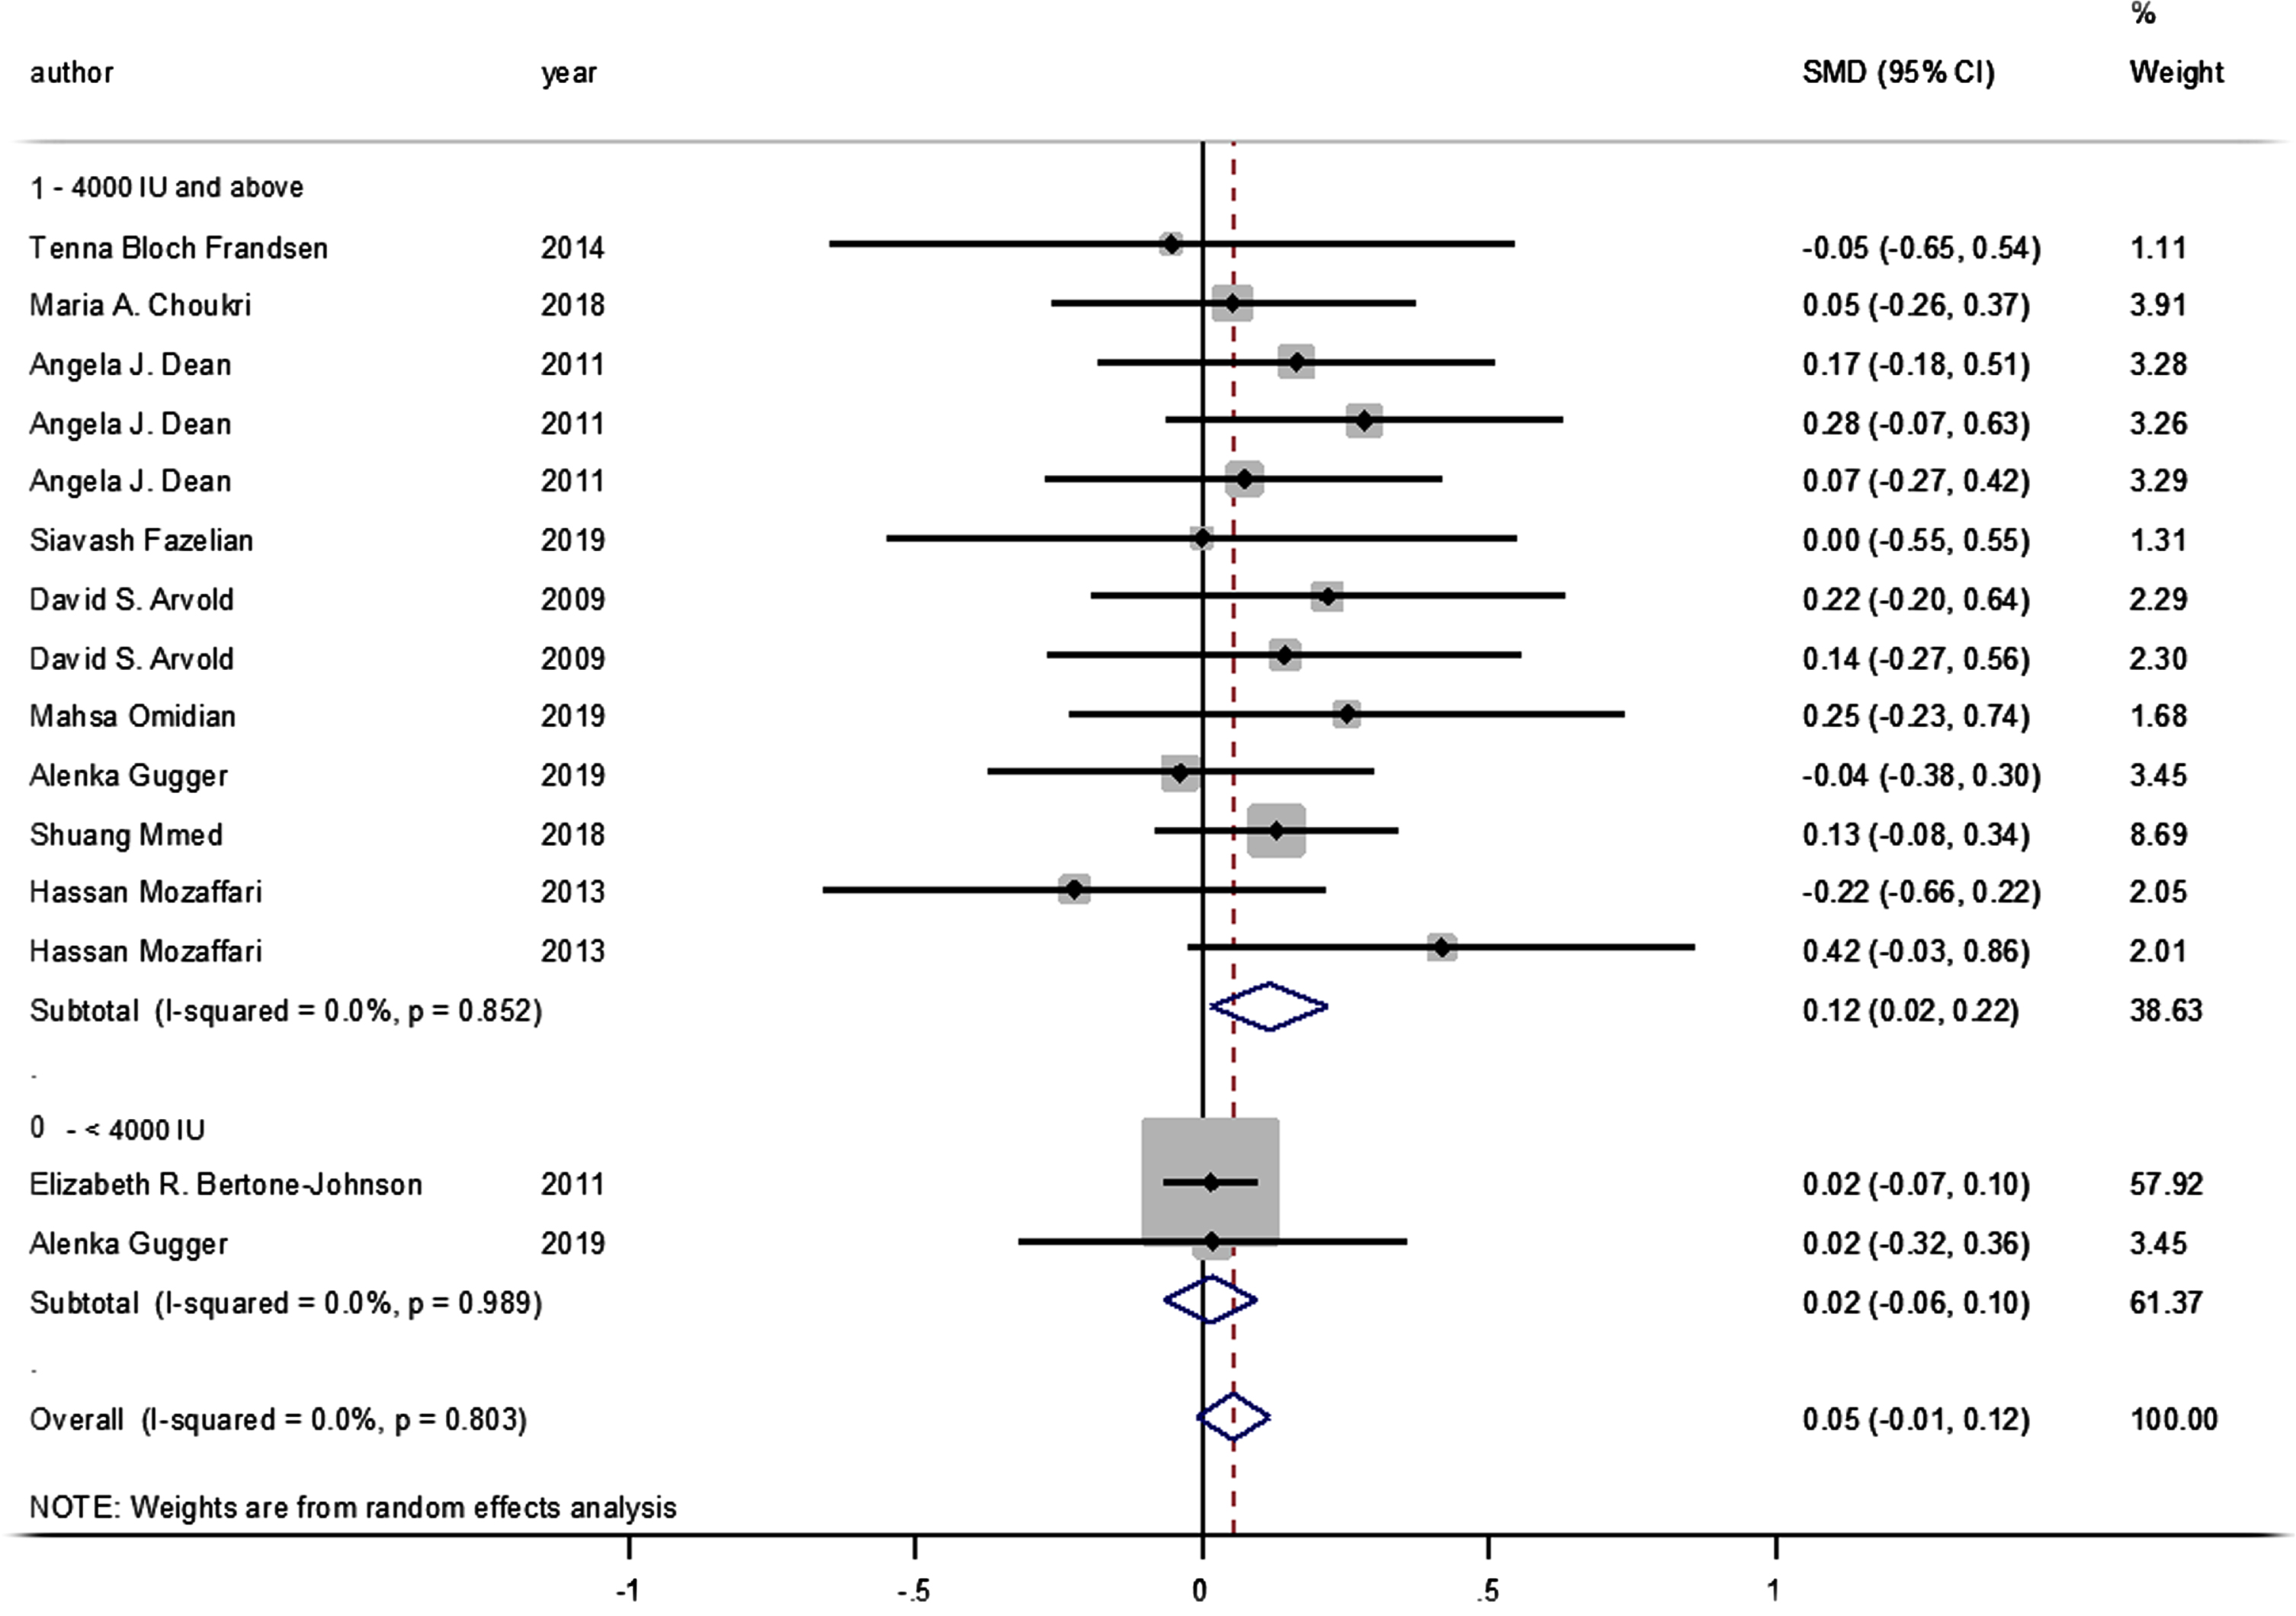
Forest plot of studies comparing outcomes of administering vitamin D and a placebo for depression, according to vitamin D dosage (less than 4000 IU; 4000 IU or above). Summary estimates consist of the SMD for differences in mean depression scores obtained from the respective studies, before and after administering vitamin D treatment to the intervention group, compared to a control group. The solid line on the forest plot is the point of no effect (SMD = 0), and the dashed line represents the overall pooled estimate. The grey squares and horizontal lines represent the odds ratios for each study and their 95% CI. Meanwhile, the size of the grey square represents the weight contributed by each study in the meta-analysis, and the diamond represents the pooled SMD and its 95% CI.
Moreover, no statistically significant difference was observed between the intervention and control groups’ mean depression scores when the studies were stratified according to baseline vitamin D levels (<50 and ≥50 nmol/L, pooled SMD: 0.038, p = 0.314; pooled SMD: 0.09, p = 0.106, respectively; I-squared = 0%, p = 0.724 and p = 0.664, respectively) (Fig. 4). Likewise, no statistically significant SMDs were found between the intervention and control groups for any of the respective depression scoring systems, when studies were pooled according to the applied depression-scoring systems presented below: Beck Depression Inventory (BDI) (SMD: 0.121 [95% CI: –0.136–0.378], p = 0.356); Burnam 8-item Scale (SMD: 0.016 [95% CI: –0.067–0.098], p = 0.712); CES-D (SMD: 0.054 [95% CI: –0.264–0.372], p = 0.741); Geriatric Depression Scale (SMD: –0.037 [95% CI: –0.376–0.301], p = 0.829); Hamilton Depression Rating Scale (SMD: –0.054 [95% CI: –0.652–0.544], p = 0.860); State-Trait Anxiety Inventory (SMD: 0.165 [95% CI: –0.182–0.512], p = 0.350); State-Trait Anger Expression Inventory (SMD: 0.283 [95% CI: –0.065–0.631], p = 0.111); Depression/anxiety (SMD: 0 [95% CI: –0.549–0.549], p = 1); FIQ (SMD: 0.220 [95% CI: –0.195–0.636], p = 0.299); Self-reported symptoms (SMD: 0.144 [95% CI: –0.270–0.559], p = 0.495), and the Short Form Health Survey (SMD: 0.018 [95% CI: –0.321–0.357], p = 0.917; PHQ-9 (SMD: 0.129 [95% CI: –0.084–0.342], p = 0.089).

Forest plot of studies comparing the outcomes of administering vitamin D and a placebo for depression to participants, according to baseline 25(OH)D levels (less than 50; 50 and above). Summary estimates consist of the SMD for differences in mean depression scores obtained from the respective studies, before and after administering vitamin D treatment to the intervention group, compared to the control group. The solid line on the forest plot is the point of no effect (SMD = 0), while the dashed line represents the overall pooled estimate. The grey squares and horizontal lines represent the odds ratios for each study and their 95% CI, whereas the size of the grey square represents the weight contributed by each study in the meta-analysis, and the diamond represents the pooled SMD and its 95% CI.
The sub-group analysis demonstrated that different psychometric scales did not have a significant impact on the association between vitamin D supplementation and depressive symptoms (Fig. 5).

Forest plot of studies comparing outcomes of administering vitamin D and a placebo for depression, according to the Depression Scale. Summary estimates consist of the SMD for differences in mean depression scores obtained from the respective studies, before and after administering vitamin D treatment to the intervention group, compared to a control group. The solid line on the forest plot is the point of no effect (SMD = 0), and the dashed line represents the overall pooled estimate. Meanwhile, the grey squares and horizontal lines represent the odds ratios for each study and their 95% CI, whereas the size of the grey square represents the weight contributed by each study in the meta-analysis, and the diamond represents the pooled SMD and its 95% CI.
This meta-analysis aimed to determine whether there is any association between vitamin D supplementation and depressive symptoms in adults aged 18 years or above. The subsequent findings show a significant reduction in depressive symptoms with vitamin D supplementation at daily doses of over 4000 IU, but not at doses below 4000 IU. In addition, no statistical association was reported between baseline serum vitamin D levels and any of the depression-scoring outcomes used. The overall quality of evidence for the association of vitamin D supplementation with depressive symptoms was graded as ‘moderate’.
The present meta-analysis revealed a significant impact of vitamin D intake on depressive symptoms, but only when high doses (≥4000 IU) were administered. According to the Institute of Medicine, the upper safety limit for cholecalciferol is 4000 IU/day [27]. The highest doses of vitamin D supplementation were administered in Mozaffari-Khosravi’s trial, with vitamin D given in doses of 150,000 IU and 300,000 IU. The latter dose was found to have a beneficial effect on symptoms of depression. Likewise, an RCT conducted in 2019 to assess the impact of vitamin D supplementation at 300,000 IU on the Beck Depression Inventory (BDI) scores of 90 patients with mild to moderate ulcerative colitis [21] reported a statistically significant reduction in the participants’ BDI scores after three months of vitamin D supplementation [21]. Significant improvements in depressive symptoms were also observed at doses of 50,000 IU per week for a total of eight weeks, as observed in Alavi’s study on 78 elderly patients aged over 60 years and exhibiting moderate to severe depressive symptoms [39].
There are several proposed mechanisms through which vitamin D could improve mood changes. For example, one possible reason for the observed benefits of vitamin D is that metabolites of vitamin D are capable of crossing the blood-brain barrier [40] and binding to vitamin D receptors (VDRs) in areas of the brain that are responsible for emotional processing and regulation, such as the hippocampus [39]. These receptors are clustered with the enzymes required for vitamin D hydroxylation [41] and are involved in mood disorders, serotonin synthesis, tryptophan hydroxylase gene regulation, and the production of proinflammatory cytokines that affect stress responses [41]. Vitamin D is also known to modulate the hypothalamic-pituitary-adrenal axis, which controls the production of dopamine, norepinephrine, and the monoamine neurotransmitter: epinephrine. Furthermore, vitamin D has been observed to prevent reductions in serotonin and dopamine in the adrenal cortex [42]. Therefore, vitamin D supplementation in appropriate doses may benefit patients with depressive symptoms [42, 43].
However, the results of the meta-analysis were not significant at doses of vitamin D < 4000 IU. The lowest vitamin D dosage was applied by Bertone-Johnson and colleagues [33], who administered it to half the members of a cohort of 2,252 older women, whereupon no association was observed between supplementation (400 IU/day of vitamin D3 over a 2-year period) and depressive symptoms [33]. Furthermore, there were no improvements in Geriatric Depression Scale (GDS) scores among African Americans or Caucasians, either based on serum 25OHD levels, or with increased doses of vitamin D [44]. The above authors interpreted the small and insignificant changes observed as potentially due to the relatively small sample size. As such, future studies investigating higher doses of vitamin D supplementation in larger sample sizes may be preferable for assessing the effectiveness of vitamin D as a nutrient in treating or preventing depression.
In the current study, the baseline serum vitamin D level before vitamin D supplementation was not found to influence the extent to which such supplementation could affect depressive symptoms. Six of the studies in this review [13, 38] included participants with sub-optimal baseline serum vitamin D levels (<50 nmol/L), while four studies included participants with optimal baseline serum vitamin D levels [25, 37]. To investigate the effectiveness of vitamin D supplementation for the treatment of depressive symptoms, future studies could initiate such interventions with participants suffering from both vitamin D deficiency (serum 25[OH]D < 10 ng/mL) and clinical depression [44].
However, it should be noted that there were differences in the methods used to measure vitamin D levels across the various studies, which may have impacted the accuracy of the plasma vitamin D measurements reported [45]. Therefore, it is challenging to compare vitamin D levels across the selected studies. In five cases, different immunoassay methods were adopted [32, 38], while liquid chromatography-mass spectrometry (LC-MS/MS) was implemented in three of the studies [25, 37]. Nevertheless, in two of the studies, there was no mention of the method of vitamin D measurement applied [26, 33]. Disagreement over different systems of vitamin D assay presents another challenge [45], since they produce widely varying results, making it difficult to compare the prevalence of vitamin D deficiency between nations [45]. One recent review of vitamin D assay methodologies found that LC-MS/MS enables more accurate medical assessment of vitamin D deficiency [44], and LC-MS/MS is considered as the gold standard of vitamin D testing, according to the Accuracy-Based Vitamin D Survey 2016 [46], given that it measures all clinically relevant metabolites of vitamin D.
Furthermore, the reviewed RCTs failed to account for important confounders, such as the participants’ dietary and lifestyle patterns. These confounders are known to have a significant influence on vitamin D metabolism, thereby potentially affecting overall response to vitamin D supplementation, and as a result, its effect on depressive symptoms [13, 38]. Other significant factors affecting vitamin D metabolism and supplementation are age and the co-morbidities that affect vitamin D and calcium metabolism. For instance, the relationship between depression and vitamin D deficiency has previously been investigated in a senior population [47]. In this current meta-analysis, only three such studies were included, because the trials conducted on elderly populations have been limited [33]. In the included studies, the age range was 50–79 years [26], 70 years and above, and a mean age of 63.2 years [34]. Another factor that could have affected the present study findings consisted of the psychometric/depression scales that were used to assess depressive symptoms. It is essential to choose a suitable screening tool for measuring depression in older adults –the Geriatric Depression Scale-15 (GDS-15) being one of the most frequently used instruments [48, 49].
Appropriate and consistent methodologies are therefore required to design future research projects that will ensure accurate results; for example, a consensus on appropriate psychometric scales for the measurement of depressive symptoms would be beneficial in the context of supplementation studies, as would accurate evaluation of vitamin D levels to investigate the effectiveness of vitamin D supplementation (≥4000 IU) in the treatment of depressive symptoms.
Limitation and Strengths
A comprehensive search strategy was adopted in this review to identify all potentially eligible studies, and the sole inclusion of RCTs helped improve the overall quality of the studies and the evidence provided. Nevertheless, some limitations of this study include wide variation in the methodologies of the included studies, such as differences in depression-scoring systems and vitamin D assay methodologies, making between-study comparisons difficult. There were also many more studies that used high doses (≥4000 IU) (n = 8), compared to those that used low doses (<4000 IU) (n = 2). As a result, the number of participants in the studies where low doses were used was much lower than in the studies with high doses. This may have contributed to the finding that doses of <4000 IU were not statistically associated with an improvement in mean depression scores. Additionally, some studies specifically recruited participants who were already suffering with depressive symptoms, while other studies did not, or were looking only at future occurrence of depressive symptoms. Several studies also report different summary estimates/measures of effect, rendering the pooling of overall effect estimates challenging.
Conclusion and future direction
This review found a positive effect of high dose vitamin D supplementation (≥4000 IU daily) on depressive symptoms in adults aged 18 years or over. Given the high prevalence of vitamin D deficiency and depression, an association between these conditions carries important public health implications. Nevertheless, higher-quality evidence to support these conclusions could be obtained if standardized methodologies were adopted in subsequent RCTs, specifically with regard to vitamin D assay measurement and depression scoring.
Footnotes
Acknowledgments and Funding
This work was supported by the Kuwait Foundation for the Advancement of Sciences [grant number CB20-63MM-01].
Conflict of interest
Jeremy Spencer is one of the Editors -in-Chiefs of this journal, but was not involved in the peer-review process nor had access to any information regarding its peer-review.
Abbreviations
BDI Beck Depression Inventory
CES-D Center for Epidemiological Studies –Depression
CI Confidence interval
DASS-21 Depression, Anxiety, and Stress Scales
ELISA Enzyme linked immunosorbent assay
FIQ Fibromyalgia Impact Questionnaire
GDS-15 Geriatric Depression Scale-15
HADS Hospital Anxiety and Depression Scale
IU International units
LC-MS/MS Liquid chromatography-mass spectrometry with two mass spectrometry detectors
NC Not clear
PHQ-9 Patient health questionnaire-9
PUFA Polyunsaturated fatty acids
RCT Randomized controlled trial
SF Short form
SIGH-SAD Seasonal affective disorders
SMD Standardized mean difference
VDRs Vitamin D receptors
WHO World Health Organization