
Abstract
Background:
Treatments for metastatic clear cell renal carcinoma (mccRCC) are evolving with multiple targeted and immune therapy drugs currently approved by regulatory agencies as single agents or in combination. Developing predictive biomarkers to determine which patients derive a differential benefit from a particular treatment is an area of ongoing clinical research.
Objective:
We sought to systematically evaluate the role of tumour tissue-based biomarkers that assist in selection of therapy for mccRCC.
Methods:
Literature addressing the role of biomarkers in mccRCC was identified through a search of the electronic databases MEDLINE, Embase, and the Web of Science and a hand search of major conference abstracts (from Jan 2010 –Sep 2020). Abstracts were screened to identify papers meriting full-text review. Studies with a comparison arm were included to assess biomarker relevance. A narrative review of studies was performed.
Results:
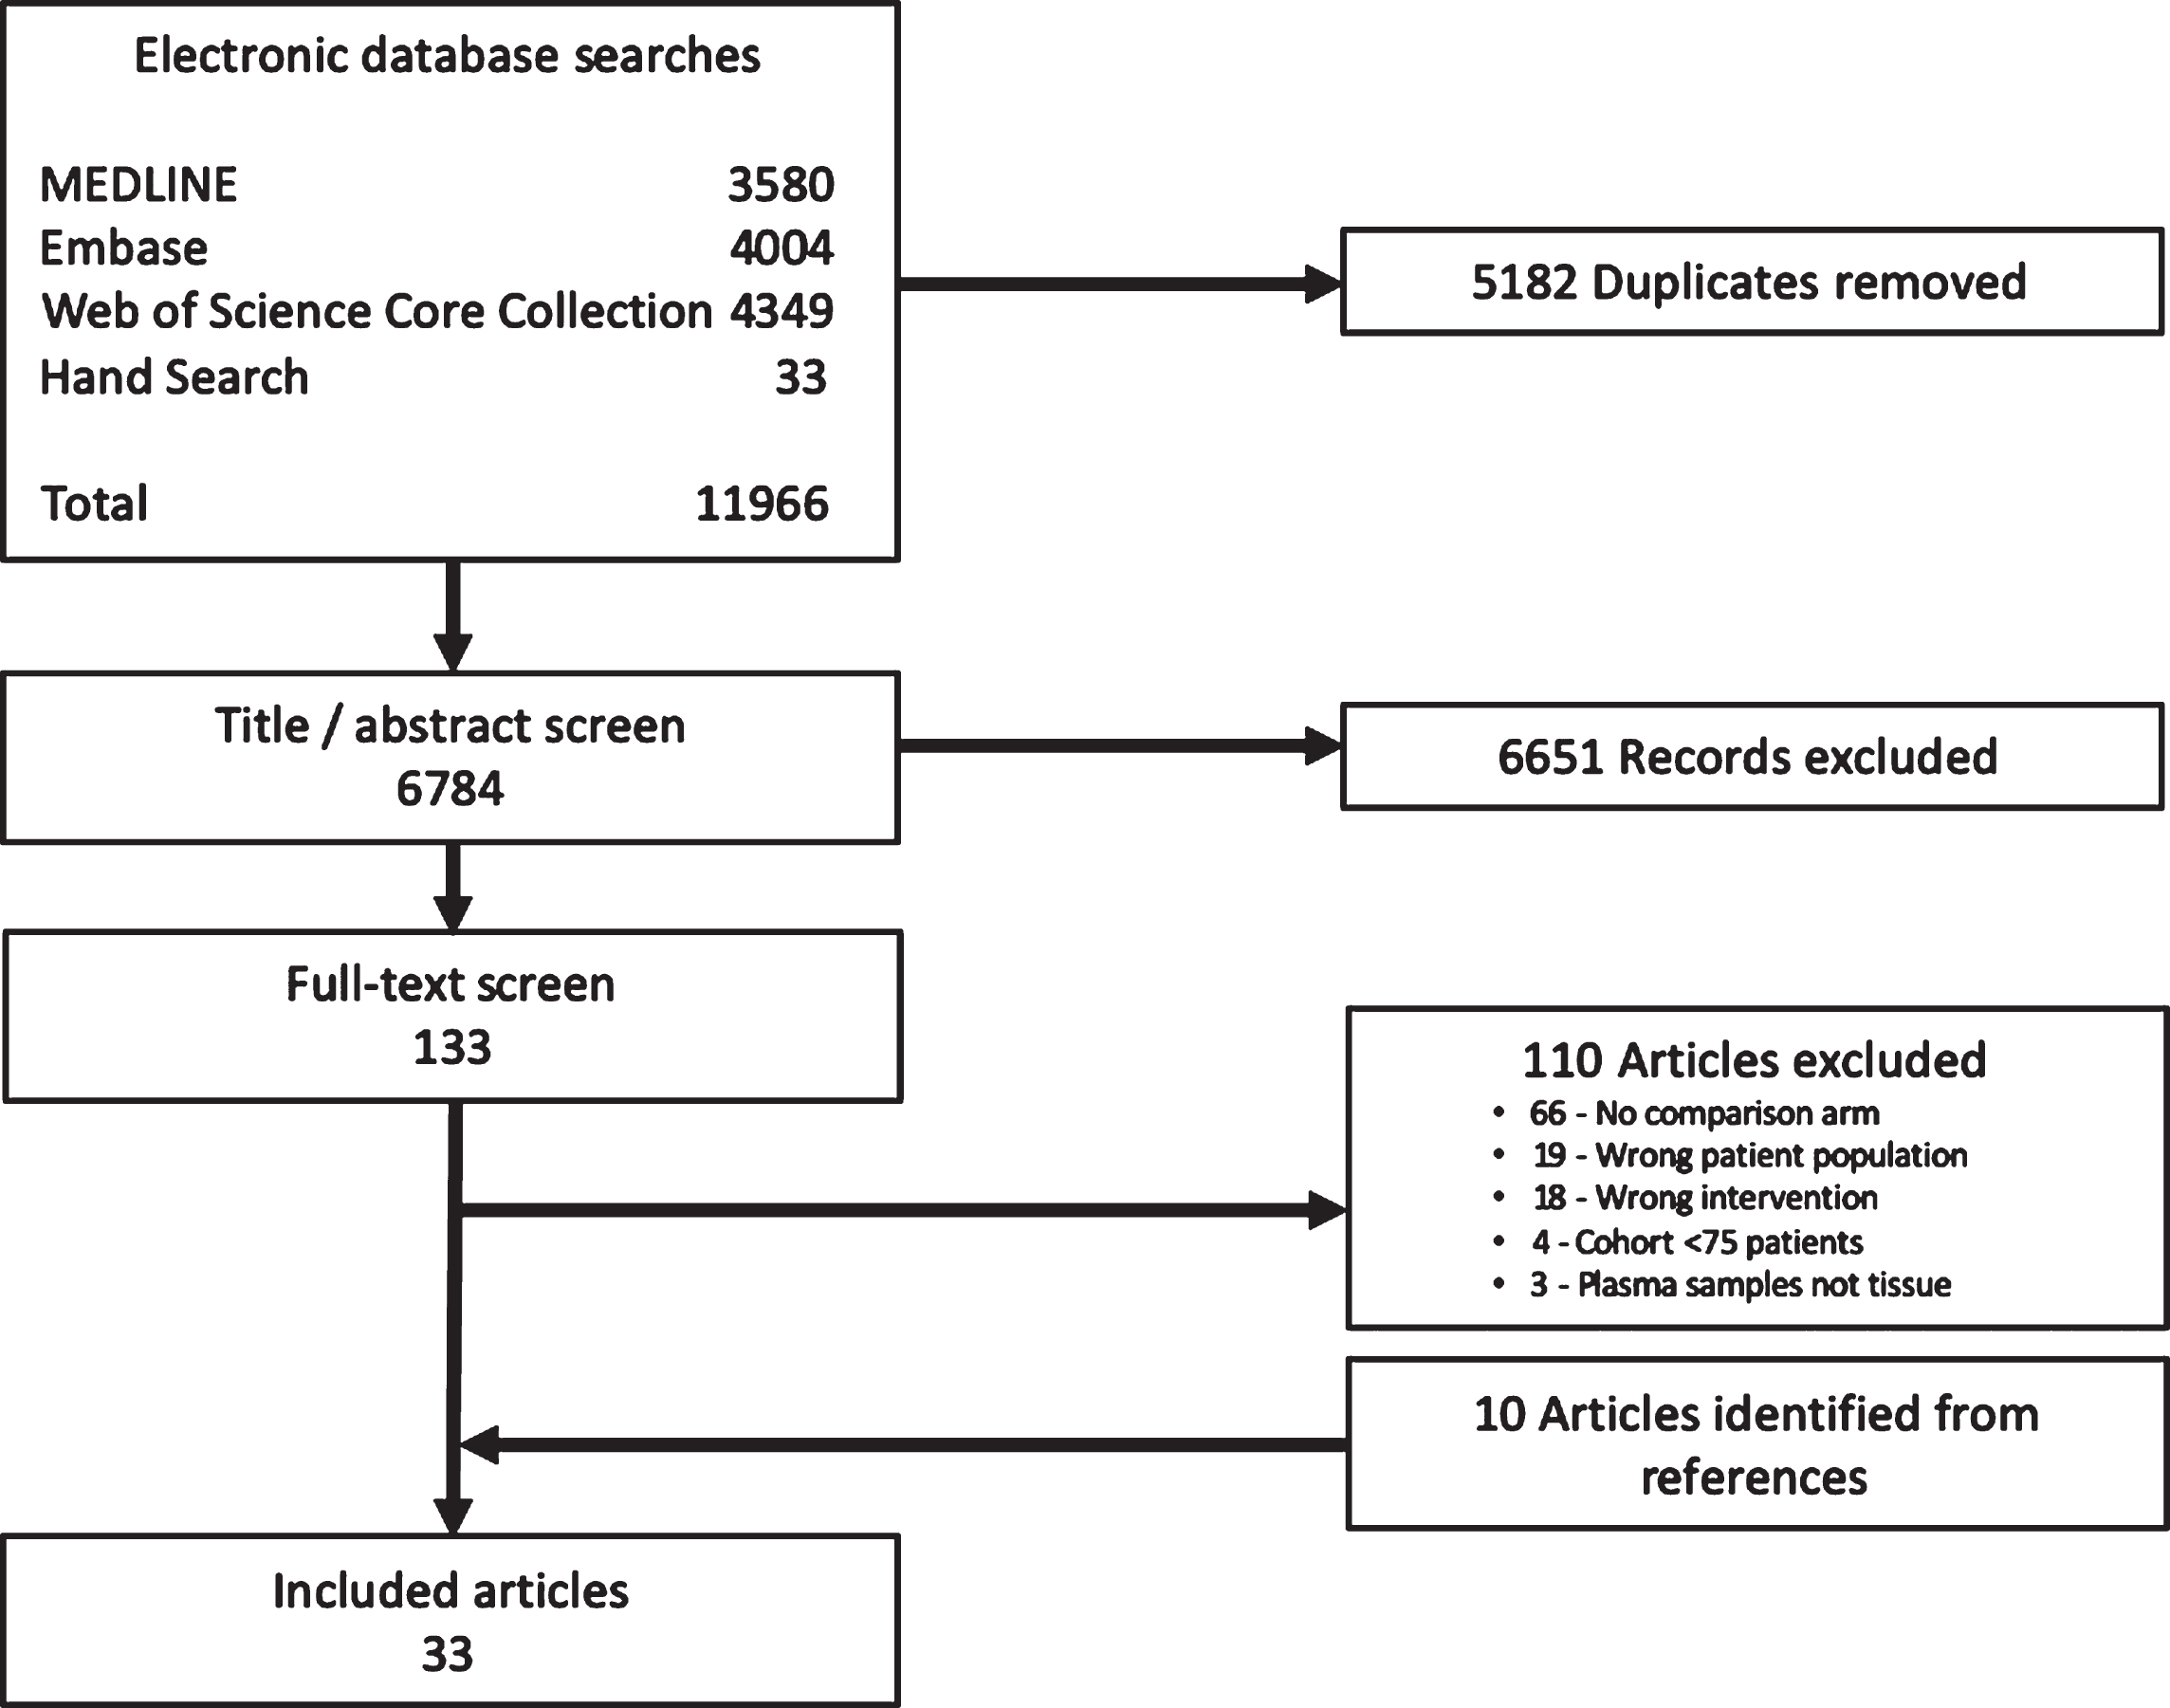
The literature search yielded 6784 potentially relevant articles. 133 articles met criteria for full text review, and 10 articles were identified by scanning bibliographies of relevant studies. A total of 33 articles (involving 13 studies) were selected for data extraction and subsequent review.
Conclusions:
Predictive biomarkers for immediate use in the clinic are lacking, and embedding their evaluation and validation in future clinical trials is needed to refine practice and patient selection.
INTRODUCTION
The introduction of effective therapies for metastatic clear cell renal cell carcinoma (mccRCC) using targeted therapies against vascular endothelial growth factor (VEGF), mammalian target of rapamycin (MTOR), and/or immune checkpoint blockade (ICB) alone or in combination has led to improved overall survival. A small number of patients achieve complete remission or long-term disease control, but the majority will experience disease progression. In the front line setting for intermediate or poor risk disease by International Metastatic renal cell Database Consortium (IMDC) criteria, six different regimens have shown an improvement in progression free survival (PFS) over sunitinib monotherapy, three of which show an improvement in overall survival (OS) [1–6]. Biomarker research is directed at refining treatment selection to optimize patient outcomes, selecting patients likely to benefit or not from a given therapy. This systematic review was designed to address the clinical validity and utility of biomarkers for patients with mccRCC.
EVIDENCE ACQUISITION
Search strategy
We identified studies examining the role of predictive tumour-related biomarkers in mccRCC by searching the electronic databases MEDLINE (Ovid), Embase (Elsevier; 1974 -), and the Web of Science Core Collection. The searches were designed (PAB) to identify articles reporting the use of molecular, genetic, or histological biomarkers to predict outcomes in mccRCC patients undergoing immune-targeted therapies (Supplementary Material). Searches were carried out on August 13, 2020. Controlled vocabulary terms were included when available; no language or date restrictions were applied. Programs from the annual meetings of the American Society of Clinical Oncology (ASCO), ASCO-Genitourinary and European Society of Medical Oncology (ESMO) from Jan 2010 to Sept 2020 were searched by hand (ALS). Because we targeted these meetings for hand searching, meeting abstracts were excluded from the electronic database results. Bibliographies of selected studies were examined and any relevant articles were included in the screen. In cases of duplicate publications, the most complete and contemporaneous report of the study was included. Independent reviewers (BAM and ALS) screened titles and abstracts for relevance and the full text of relevant articles was retrieved to assess eligibility.
Inclusion criteria
All authors participated in the design of the search strategy and inclusion criteria. The study population included patients >18 years of age, with mccRCC treated with Tyrosine Kinase Inhibitors (TKI) or Immune Checkpoint Blockade (ICB - referring to anti-PD-L1/PD-1 or anti-CTLA-4 compounds) therapy (search terms refer to Supplementary material). Biomarker types were limited to tumour-tissue based (IHC staining, RNA expression profiling, or somatic mutational analysis), performed on archival or fresh tumour biopsy prior to initiation of systemic therapy. The biomarker assessment was required to have a comparator treatment arm to differentiate benefit; have been performed within phase 2 or 3 randomized or non-randomized clinical trials; or represent large multi-institutional analysis (>75 patients). Results were restricted to original articles.
Data extraction
Two independent reviewers (BAM and ALS) assessed relevant articles for study eligibility and performed data extraction. Disagreement was resolved by discussion. Recorded information included: first author’s surname, year of publication, data source, line of therapy, control and comparison therapy, sample size, biomarker assay and cut-off value, clinical outcomes, and pertinent statistical analyses.
EVIDENCE SYNTHESIS
The electronic databases searches returned literature search strategy yielded 6,784 unique articles. This includes the hand search which identified 33 conference abstracts. 133 articles met the criteria for full text review, and 10 articles were identified by scanning bibliographies (Fig. 1). A total of 33 articles (involving 13 studies) were selected for data extraction and subsequent review (Supplementary Table 1).
Study selection.
IHC Based Biomarkers (Table S1)
IHC is a low-cost technique able to be rapidly performed on archival tissue that is routinely performed by local laboratories, making this an easily accessible and convenient platform for biomarker assessment.
Programmed death ligand 1 (PD-L1)
PD-L1 has been extensively studied as a potential biomarker in mccRCC. Several limitations exist: the use of non-uniform assays between clinical trials, variability in methodology (assays may stain tumour cells, immune cells, or both), and uncertainty as to the ideal timing and anatomical site for specimen collection. Discordance of PD-L1 expression has been noted between primary and metastatic sites, raising questions to whether archival tissue can be utilised for patients with metachronous metastasis or in later lines of therapy [7]. Although not specific to renal cell carcinoma, global issues exist with performing PD-L1 testing in the community; each assay requires a specific stain and laboratories require sufficient throughput and expertise to minimize inter- and intra-observer variation and ensure the reproducibility of results.
Nine studies in this review assessed PD-L1 as a biomarker across treatment lines in mccRCC. A summary of the assay details and trials utilising PD-L1 assessment are provided in Table 1 and Table S1.
PD-L1 assay utilisation within mccRCC clinical trials
The phase 3 COMPARZ trial randomizing patients with mccRCC to pazopanib or sunitinib demonstrated the non-inferiority of pazopanib to sunitinib for the primary end point of PFS, with hazard ratio (HR) 1.05 (95% CI, 0.90–1.22) meeting the predefined noninferiority margin [12]. On analysis of efficacy by PD-L1 staining of tumour cells, there was no difference in treatment effect between study arms. However, those with PD-L1 expression had a significantly shorter median overall survival (mOS) within both the pazopanib and sunitinib arms (15.1 versus 35.6 months, and 15.3 versus 27.8 months, respectively; P = 0.03) [8].
The randomized phase 2 CABOSUN trial compared cabozantinib with sunitinib as initial systemic therapy for intermediate and poor risk mccRCC. The primary end point PFS favoured cabozantinib with a median of 8.6 months (95% CI, 6.8–14.0) versus 5.3 months (95% CI, 3.0–8.2) for sunitinib (HR 0.48; 95% CI, 0.31–0.74), and met statistical significance (two-sided P = 0.0008) [5]. The phase 3 METEOR trial compared cabozantinib to everolimus in the second line setting. It met the primary end point PFS and secondary end point OS, both favouring cabozantinib, with mOS 21.4 months (95% CI, 18.7 - NE) compared to 16.5 months (95% CI, 14.7–18.8) with everolimus (HR 0.66; 95% CI, 0.53–0.83; P = 0.00026) [9]. Analysis of outcomes based on PD-L1 status was performed in a pooled analysis incorporating patients from the CABOSUN and METEOR trials. Superiority of cabozantinib over both sunitinib and everolimus was maintained independent of PD-L1 expression. On univariate analysis, those with PD-L1 positive tumour cells demonstrated worse PFS and OS, independent of therapy. When combining the two trials, PD-L1 expression and OS was statistically significant for all patients (P = 0.034) and for patients treated with cabozantinib only (P = 0.038) on multivariable analysis. [13]. These data suggest PD-L1 expression on tumour cells is a poor prognostic marker in the setting of monotherapy with VEGF TKI.
Evaluating the role of PD-L1 in the setting of immunotherapy, CheckMate-025 compared nivolumab to everolimus in pre-treated patients [11], finding that nivolumab improved the primary end point OS in a biomarker-unselected population. Staining of PD-L1 on tumour cells did not differentiate treatment outcomes. mOS in patients with positive PD-L1 expression was 21.8 months (95% CI, 16.5–28.1) for nivolumab compared to 18.8 months (95% CI, 11.9–19.9) in the everolimus group (HR 0.78; 95% CI, 0.53–1.16). In the PD-L1 negative cohort, mOS was 27.4 months (95% CI, 21.4 - NE) for nivolumab and 21.2 months (95% CI, 17.7–26.2) for everolimus (HR 0.76; 95% CI, 0.60–0.97) [14]. Akin to data seen with single agent VEGF TKI, PD-L1 positive disease was a poor prognostic marker in the second line setting.
In the front-line setting, the three-arm randomised phase 2 IMmotion 150 trial compared atezolizumab/bevacizumab and atezolizumab monotherapy against the control arm sunitinib. Co-primary end points (PFS in intent to treat (ITT) population, and in PD-L1 positive population as assessed by staining on immune cells) were not met, but the combination showed promising activity versus sunitinib in the PD-L1 positive population (HR 0.64; 95% CI, 0.38–1.08) and atezolizumab monotherapy arm (HR 1.03; 95% CI, 0.63–1.67). This biomarker enriched population compared favourably to PFS outcomes for the combination (HR 1.0; 95% CI, 0.69–1.45) and monotherapy (HR 1.19; 95% CI, 0.82–1.71) in the ITT population, suggesting a predictive role for PD-L1 staining on the immune cells with atezolizumab with or without addition of bevacizumab [10].
The subsequent phase 3 randomised IMmotion151 trial compared atezolizumab with bevacizumab versus sunitinib. Although meeting the co-primary PFS end point in the PD-L1 positive population for PFS, interim analysis did not cross the significance boundary for OS in ITT population (HR 0.93; 95% CI, 0.76–1.14). In contrast to previous data from IMmotion 150, PD-L1 status of immune cells did not significantly impact PFS, even among patients receiving sunitinib. In the PD-L1 positive population, median PFS (mPFS) was 11.2 months for atezolizumab plus bevacizumab versus 7.7 months in the sunitinib group (HR 0.74; 95% CI, 0.57–0.96; P = 0.0217), similar to the ITT population (11.2 months versus 8.4 months, HR 0.83; 95% CI, 0.70–0.97; P = 0.0219) [1].
The open-label phase 3 KEYNOTE 426 evaluated combination pembrolizumab and axitinib versus sunitinib in the first line setting. The trial met the primary end point for OS across IMDC subgroups favoring the combination therapy. This benefit was preserved regardless of PD-L1 expression on tumour and immune cells, with similar OS in PD-L1 negative (HR 0.59; 95% CI, 0.34–1.03) and PD-L1 positive (HR 0.54; 95% CI, 0.35–0.84) patients. PD-L1 expression was once again associated with worse prognosis for patients on sunitinib, with mPFS in PD-L1 positive disease of 8.9 months (95% CI, 7.6–11.3) versus 12.5 months (95% CI, 11.0 - NE) for PD-L1 negative patients [3].
The randomized phase 3 JAVELIN Renal 101 explored the combination axitinib and avelumab versus sunitinib in previously untreated patients. PD-L1 status of immune cells was embedded in the trial design with two independent primary end points: PFS and OS among patients with PD-L1 positive tumours. With maturing follow-up, despite reaching the PFS end point (HR 0.62; 95% CI, 0.49–0.78; P < 0.0001), to date the trial has not reached significance for OS, though PFS remains significantly longer in the avelumab plus axitinib arm compared to the sunitinib arm regardless of PD-L1 status [4]. Again, PFS was markedly shorter among patients expressing PD-L1 in the sunitinib arm, mPFS 8.2 months (95% CI, 6.9–8.5) versus 11.1 months (95% CI, 9.7–13.8) in PD-L1 positive and negative cohorts respectively [15].
Another phase 3 trial CheckMate 214 evaluated the combination of ipilimumab and nivolumab versus sunitinib in the first-line setting. Positive for OS in the intermediate and poor prognostic risk population, an overall benefit from ipilimumab and nivolumab versus sunitinib is maintained agnostic of PD-L1 expression on tumour cells [16]. However, the magnitude of benefit was more favourable in the PD-L1 positive population when compared to the PD-L1 negative population. Among those with PD-L1 negative disease, mPFS was 11.0 months for the combination and 10.4 months for sunitinib (HR 1.00; 95% CI, 0.80–1.26), while for PD-L1 positive disease mPFS was 22.8 months vs. 5.9 months (HR 0.46; 95% CI, 0.31–0.67). This showed PD-L1 expression on tumour cells as a poor prognostic marker for VEGF therapy, but suggests predictive benefit with nivolumab and ipilimumab in the treatment-naive setting [17].
Most recently the CheckMate 9ER study compared cabozantinib and nivolumab to sunitinib in the first line setting, favouring the combination in the primary end point mPFS of 16.6 months (95% CI, 12.5–24.9) versus 8.3 months for sunitinib (95% CI, 7.0–9.7) (HR 0.51; 95% CI, 0.41–0.64; P < 0.0001). The secondary end point OS was also met (HR 0.60; 98.89% CI, 0.40–0.89; P = 0.0010), with median survival not reached in either arm. Patients were enrolled agnostic of, but were stratified according to, PD-L1 status in tumour cells (24.9% PD-L1 positive). The benefit of combination therapy was observed regardless of PD-L1 status according to PFS in both PD-L1 positive (HR 0.49; 95% CI, 0.32–0.73) and negative (HR 0.52; 95% CI, 0.40–0.67) cohorts, with OS benefit maintained across both cohorts [6].
MET
MET (Mesenchymal-Epithelial Transition) is upregulated in mccRCC, and its expression is associated with an aggressive disease phenotype and metastatic sites [18, 19]. Thus cabozantinib, a multikinase inhibitor that harbors activity against MET, has a preclinical rationale for use in RCC with MET overexpression. While cabozantinib has shown activity in mccRCC across many trials, pooled retrospective analysis of archival tumour samples from the METEOR and CABOSUN trials found no association between MET expression on IHC and clinical end points [5, 13].
PTEN
PTEN (Phosphatase and Tensin Homolog) operates as a multi-functional tumour suppressor that modulates cell cycle progression and cell survival through the PI3K-AKT/PKB signalling pathway, and is commonly mutated in ccRCC [20]. Preclinical models have suggested PTEN-deficient tumours present an enhanced sensitivity to mTOR inhibitors [21]. In the first-line RECORD-3 clinical trial, everolimus did not meet the primary end point of PFS non-inferiority against sunitinib. However in the biomarker analysis, PTEN loss by IHC was predictive of benefit for everolimus, with mPFS of 5.3 months and 10.5 months (HR 2.5; P < 0.001) in the PTEN positive and negative cohorts, respectively, whereas sunitinib activity was agnostic to PTEN status [22]. As such, PTEN status by IHC may serve a useful biomarker, with PTEN-retained tumours predicting a lack of benefit for everolimus (Table S1).
CAIX
Carbonic anhydrase IX (CAIX) is a hypoxia-induced protein that assists in the regulation of intra- and extracellular pH [23]. In the cytokine era, based on promising results from retrospective analyses McDermott et al. prospectively tested the utility of CAIX in enriching for response to high-dose aldesleukin (IL2) in the Select trial; but were unable to demonstrate a correlation with overall response rate (ORR) or OS [24, 25]. Small retrospective series have suggested that increased expression may confer sensitivity to VEGF targeted therapy [26]. In the phase 3 TARGET study, the only large trial that examined CAIX to date, the activity of sorafenib was compared to placebo in cytokine pre-treated patients. The trial did not meet the primary end point of OS, but favoured sorafenib for PFS (HR 0.44; 95% CI, 0.35–0.55; P < 0.000001) [27]. Increased expression of CAIX was not predictive of clinical benefit from treatment with sorafenib: mPFS for patients on the sorafenib arm with high CAIX versus low CAIX expression was 5.5 and 5.4 months, respectively (P = 0.97), and 1.5 and 1.7 months on the placebo arm (P = 0.76) [28].
Genomic biomarkers (Table S3)
Tumour mutational profiling has gained acceptance in clinical oncology based on the ability to direct therapy mechanistically linked to a defined genomic alteration. Assessment of the mutational landscape of mccRCC has led to the identification of a number of important pathways in renal tumourigenesis, though their roles in biomarker development lag behind other malignancies. For a summary of genomic biomarkers refer to Table S2.
Von Hippel Lindau (VHL) was the first gene of significance discovered in mccRCC, and its inactivation is considered an early and fundamental event in the development of mccRCC [29]. VHL loss leads to a decrease in functional VHL protein (pVHL) and subsequent induction of hypoxia regulated genes regulated by pVHL, including proangiogenic proteins such as VEGF. In view of this, inactivated VHL may render a tumour more susceptible to VEGF targeted therapy. Despite its prevalence and central role in pathogenesis, the contemporaneous studies detailed in our review indicate that VHL status has no prognostic or predictive value in patients with mccRCC [10, 31], consistent with a previous meta-analysis [32].
Aside from VHL, many other mutated genes identified in ccRCC can act as chromatin modifiers. Commonly involved genes and their frequency of alteration include Polybromo 1 (PBRM1, 40%), SET domain containing 2 (SETD2, 25%), ubiquitin carboxyl-terminal hydrolase (BAP1, 14%), and lysine demethylase 5C (KDM5C, 10%) [33].
PBRM1, encoding a SWI/SNF complex protein, is mutated in up to 46% of mccRCC and has been studied extensively [34, 35]. Loss of function (LOF) mutations to components of the mSWI/SNF complex have correlated variably with clinical benefit for ICB treatment across different lines of therapy. In the post-TKI setting, LOF mutations in PBRM1 have been associated with clinical benefit with nivolumab. Utilising samples from CheckMate 009 (a single-arm phase 1 study of nivolumab in mccRCC), whole-exome sequencing (WES) was performed on 35 patients with mccRCC. Patients with biallelic PBRM1 loss were associated with a clinical benefit, demonstrating improved PFS and OS (P = 0.029 and P = 0.0074, respectively; median NR) [36]. This was validated in an independent cohort of 63 mccRCC patients treated with ICB therapies. When the discovery and validation cohort were combined, different results were observed dependent on the line of therapy. Better survival on anti-PD-1/L1 therapy was not found for patients with mutated PBRM1 on first line (P = 0.91), but was seen at subsequent lines of therapy (P = 0.0087) [36]. Analysis of samples from Checkmate 025 showed PBRM1 LOF mutations were associated with an improvement in clinical outcomes among those treated with nivolumab as second- or third-line therapy, with mPFS 5.6 months (95% CI, 3.6–11.2) versus 2.9 months (95% CI, 2.0–5.6), and mOS 27.9 months (95% CI, 19.9 - NE) versus 20.9 months (95% CI, 18.3–24.8) in the PBRM1 mutant and wildtype cohorts, respectively; importantly, there was no difference among those who received everolimus [37]. Analysis of pooled data incorporating the above studies (the randomised CheckMate025 trial with nivolumab against everolimus and the single arm nivolumab studies, CheckMate 010 and 009) enriched with VEGF refractory patients demonstrated the association of truncating mutations in PBRM1 with improved response and survival (P < 0.001 for OS) [38].
In the setting of TKI monotherapy, Voss et al. utilised two independent clinical trial datasets from COMPARZ (training cohort; n = 357) and RECORD-3 (validation cohort; n = 258) to incorporate genomic mutational data into a risk score for mccRCC. Data from patients in all treatment groups (sunitinib and pazopanib in the training cohort, and everolimus and sunitinib in the validation cohort) were pooled for this analysis. As part of the risk score, on univariate analysis in the training cohort, mutations in PBRM1 were prognostic for a more favorable PFS (HR 0.67; 95% CI, 0.51–0.88; P = 0.004) and OS with median 23.8 months (95% CI, 18.7–28.2) versus 35.5 months (95% CI, 28.0 - NR) (HR 0.63; 95% CI, 0.47–0.85; P = 0.0019) [39].
Hsieh et al. evaluated the utility of PBRM1 status with first-line everolimus or sunitinib, specifically within the RECORD-3 trial. Patients harbouring mutant PBRM1 appeared to have a lower risk of progression on first-line everolimus than wild type tumours according to PFS (HR 0.53; 95% CI, 0.3–0.8) with mPFS of 12.8 months (8.1–18.4) versus 5.5 months (3.1–8.4), whereas in the sunitinib arm, the mutation status of PBRM1 appeared to have no effect (HR 0.79; 95% CI, 0.5–1.3) [30].
In contrast to the VEGF-refractory setting, analysis from first-line clinical trials (JAVELIN Renal 101, CheckMate214, and IMmotion150/151) have not demonstrated a clear association between PBRM1 alterations and response to therapy in patients treated with either immunotherapy-based combination regimens or single agent anti-PD-1/L1. Comparison within treatment arms from IMmotion150 found PBRM1 mutations were associated with improved PFS for the sunitinib group (HR 0.38; 95% CI, 0.20–0.73), comparable to what was seen in COMPARZ [10]; however, no differential effect was observed for the atezolizumab single agent or combination arms. When compared across treatments, in the PBRM1 mutant subgroup atezolizumab monotherapy was associated with worse PFS than sunitinib (HR 2.49; 95% CI, 1.26–4.91), and atezolizumab plus bevacizumab showed improved PFS versus atezolizumab monotherapy (HR 0.42; 95% CI, 0.22–0.82) [10]. Thus, PBRM1 mutation status was not predictive of response to ICB.
A contemporaneous analysis from the CheckMate 214 study did not demonstrate differential PFS or OS outcomes for nivolumab plus ipilimumab based on PBRM1 mutational status. Likewise, in a robust analysis from JAVELIN Renal 101 pitting combination axitinib plus avelumab against sunitinib, PFS did not differ by mutational status [16, 40].
The RECORD-3 trial comparing sunitinib followed by everolimus versus the inverse has been analyzed exhaustively for biomarker analysis. Within this framework, SETD-2, KDM5C, and BAP-1 were analysed, along with alterations within the mTOR pathway.
SETD2-inactivating mutations are suggested to be responsible for driving metastatic progression, based on their observed alteration in 10% of renal cell primary tumours which feature a marked increase by 30% in metastatic deposits [41]. SETD2 inactivation also correlates with aggressive clinicopathological features, and a previous retrospective analysis of mccRCC outside of a clinical trial setting predicted reduced PFS and OS for patients on targeted therapy [42]. Despite this early prognostic signal, SETD2 mutation status did not correlate with clinical outcomes within the RECORD-3 clinical trial, regardless of treatment [43].
KDM5C encodes a histone demethylase involved in the regulation of transcription and chromatin remodelling. Mutations to this gene are found in around 10% of mccRCC, and are associated with advanced stage, grade, and tumour invasiveness [44]. The mutation status of KDM5C had no effect on first line PFS in the everolimus arm (HR 1.06; 95% CI, 0.5–2.1). However, among those treated with first line sunitinib, patients with KDM5C mutations appeared to have lower risk of progression than those with wild type tumours (HR 0.57; 95% CI, 0.3–1.1), with mPFS of 20.6 months (95% CI, 12.4–27.3) versus 8.3 months (95% CI, 7.8–11.0; P = 0.0511) [30].
BRCA1-associated protein 1 (BAP1) mutations occur in 10–15% of mccRCC, and are associated with higher grade and larger primary tumours [45]. Preclinical studies have demonstrated an association between BAP1 mutations and mTOR pathway activation [45]. In clinical studies, patients with BAP1 mutations respond poorly to targeted therapy, and appear to have shorter PFS than those with BAP1 wildtype tumours [46]. Analysis of the RECORD-3 trial found no association between BAP1 mutations and response to sunitinib; however, BAP1 mutations were associated with reduced response to everolimus, with first-line mPFS of 10.5 months (95% CI, 7.3–12.9) versus 4.9 months (95% CI, 2.9–8.1) (HR 1.84; 95% CI, 1.1–3.2; P = 0.02) [30].
The PI3K/AKT/mTOR pathway plays a central role in RCC tumourigenesis. Physiologically it functions as an intracellular signalling pathway involved in cellular proliferation and survival, protein synthesis, glucose homeostasis, and molecular trafficking [47]. In cancer development its deregulation may lead to increased proliferative potential, enhanced cell motility, metastasis, and evasion from apoptosis. Components of this signalling cascade PIK3CA, MTOR, TSC1/2 and PTEN have been found to harbour activating mutations in mccRCC [48].
Previous observational data had noted that patients with ccRCC harboring mutations in MTOR, TSC1, TSC2, and PI3K most benefited from treatment with mTOR inhibitors everolimus and temsirolimus [49]. However, in the most comprehensive analysis to date performed as part of RECORD-3, no association was found between mTOR pathway mutation status and clinical response [22].
Tumour mutational burden (TMB) refers to the overall prevalence of somatic mutations, which vary significantly between cancer types. mccRCC is characterised by a relatively low TMB, with a median of 1.1 mutations per Mb. Within mccRCC there is a subset of cases with high TMB, but still lower relative to more heavily mutated cancers such as lung or melanoma, (which in cases may have >100/Mb) [50]. The rationale for TMB as a biomarker for response to IO therapy stems from the observation that high mutational load correlates with an immunogenic tumour microenvironment, and mechanistically, increased expression of tumour-specific neoantigens could enable the immune system to mount a more robust response and be more amenable to augmentation by ICB-based regimens [51]. Despite this preclinical rationale for use as a biomarker, high TMB in mccRCC has not been predictive in clinical trials (JAVELIN Renal 101, IMmotion150, CheckMate 214, 025, 010 and 009) [10, 52].
RNA expression biomarkers (Table S4)
Gene expression profiling (GEP) aims at producing a global picture of cellular activity. Much work has sought to subtype patients by identifying clusters of functionally related genes that are co-expressed forming biomarker signatures. [53]. A pathologic hallmark predominant to mccRCC is upregulated angiogenesis, mediated through the HIF-VEGF-VEGFR-pathway. The expression of genes involved in this pathway may be useful for predicting a response to VEGF targeted therapy [54]. Alternatively, expression of genes involved in immune modulation may also predict outcomes to immune based therapy.
Rini et al. performed GEP on samples from axitinib- or sorafenib-treated patients from the second line AXIS trial, examining isolated genes implicated in the regulation of angiogenesis and immune modulation in mccRCC. An association between CCR7, CXCR4, and TLR3 expression levels and treatment efficacy was found (Table S3), suggesting these genes may represent potential markers of sensitivity to anti-angiogenic therapies, within the limits of a retrospective evaluation [55].
Additional work evaluating the benefit of first line VEGF TKIs sunitinib and pazopanib from the COMPARZ trial revealed a class effect, with higher angiogenesis gene expression levels associated with improved ORR, PFS, and OS, agnostic to treatment arm (HR for PFS 0.68; 95% CI, 0.53–0.88; P = 0.0023) [56].
In contemporaneous first line trials incorporating ICB as part of a treatment arm, comprehensive work has explored the utility of gene expression signatures as biomarkers. The IMmotion 150 and 151 trials were the first to assess gene signatures within the context of first line combination ICB therapy. IMmotion150 [10] developed signatures based on the relative expression of angiogenesis (angiohigh versus angiolow) and T-effector cell (Teffhigh versus Tefflow) genes that were found to differentiate benefit from sunitinib and the combination of atezolizumab and bevacizumab (Table 2). Within the sunitinib treatment arm, angiohigh tumours were associated with an improved ORR (46% versus 9%) and PFS (HR 0.31; 95% CI, 0.18–0.55) compared to angiolow tumours. Evaluated across treatment arms, no difference in PFS was observed in the angiohigh subgroup between the atezolizumab plus bevacizumab and sunitinib arms, or between the atezolizumab monotherapy and sunitinib arms. In the angiolow subgroup, atezolizumab plus bevacizumab demonstrated improved PFS versus sunitinib (HR 0.59; 95% CI, 0.35–0.98). No difference in PFS was observed between the atezolizumab monotherapy and sunitinib arms in angiolow subset (HR 0.75; 95% CI, 0.46–1.25; P = 0.270) [10]. Teffhigh gene signature expression (based on median signature score) was associated with improved ORR (49% versus 16%) and PFS (HR 0.50; 95% CI, 0.30–0.86) versus Tefflow within the atezolizumab plus bevacizumab arm. When compared across treatment arms, Teffhigh gene signature expression was associated with improved PFS for atezolizumab plus bevacizumab versus sunitinib (HR 0.55; 95% CI, 0.32–0.95).
Gene signature composition from clinical trials
Gene expression signatures were also explored to distinguish the clinical activity between treatment arms of atezolizumab plus bevacizumab versus sunitinib. Teff, angio, or myeloid inflammation gene expression signatures were unable to differentiate activity of atezolizumab plus bevacizumab from atezolizumab monotherapy. Within Teffhigh tumours, the presence of myeloid inflammation impacted clinical outcome with the three therapies. Atezolizumab monotherapy had worse activity in the Teffhigh, myeloidhigh tumours compared with the Teffhigh, myeloidlow tumours (HR 3.82; 95% CI, 1.70–8.60). Across treatment arms, atezolizumab plus bevacizumab showed improved PFS compared with atezolizumab monotherapy (HR 0.25; 95% CI, 0.10–0.60). No apparent difference in PFS was observed between atezolizumab plus bevacizumab and atezolizumab monotherapy in the Teffhigh myeloidlow subgroup [10].
When these signatures were applied to the phase 3 IMmotion151 trial, sunitinib demonstrated improved PFS in angiohigh versus angiolow subsets, but the incremental benefit of atezolizumab and bevacizumab was negligible compared to sunitinib in the angiohigh subset, with mPFS of 10.1 and 12.5 months in the sunitinib and atezolizumab plus bevacizumab arms, respectively (HR 0.95; 95% CI, 0.76–1.19). Conversely, atezolizumab and bevacizumab demonstrated improved PFS compared to sunitinib in the Teffhigh subset, where mPFS was 12.4 months compared to 8.3 months, respectively (HR 0.76; 95% CI, 0.59–0.99), suggesting that distinct groups of patients grouped by these signatures may benefit from different approaches to systemic therapy [57].
Avelumab plus axitinib versus sunitinib was studied in the first line setting within the JAVELIN Renal 101 study, where a novel 26-gene signature was developed (Table 2) dividing patients into 2 distinct groups within immunomodulatory or angiogenesis gene expression signatures. This sought to define molecular features that would differentiate clinical benefit from combination VEGF/ICB or VEGF monotherapy. The developed angiogenic signature favoured therapy with sunitinib (HR 0.56; 95% CI, 0.42–0.74), and patients with an immunomodulatory signature derived benefit from the combination of axitinib and avelumab (HR 0.60; 95% CI, 0.44–0.83) (Table S3). Seeking to explore the utility of alternative gene signatures developed in other clinical trials, application of the IMmotion 150/151 signatures (angio/Teff) within the RENAL 101 dataset was unable to predict efficacy, with the exception of the angiohigh signature predicting benefit from sunitinib [15].
The first line CheckMate 214 trial employed GEP utilising previously investigated immune-related gene signatures from the JAVELIN and IMmotion clinical trials. Immune-related signatures that were predictive of benefit to combination anti-PD-L1 and VEGF inhibition were not predictive of benefit to nivolumab-ipilimumab. However, utilising IMmotion 150 angiogenic signatures for sunitinib showed improved PFS in patients with angiohigh versus angiolow scores [16].
Previous work by Beuselinck et al. identified 4 robust subtypes of mccRCC (designated ccrcc1-4) based on a 35-gene signature associated with differential responses to sunitinib. Type ccrcc1 “immune low” and ccrcc4 “immune high” tumours had poor outcomes, with a lower PFS, OS, and response rate (P = 0.005) than ccrcc2 “angio high” or ccrcc3 “normal like” tumours on sunitinib (P = 0.001 and 0.0003, respectively) [58].
The BIONIKK trial applied these ccrcc1-4 classifications in an open-label, multicenter randomized phase 2 trial evaluating nivolumab versus nivolumab plus ipilimumab versus VEGF TKI (sunitinib or pazopanib) in upfront mccRCC. Treatment was assigned according to the groupings; ccrcc1/4 randomized to receive nivolumab or nivolumab plus ipilimumab, and ccrcc2/3 were randomized to nivolumab plus ipilimumab or TKI. The hypotheses underlying the trial design were that nivolumab alone would provide good outcomes in ccrcc4, nivolumab and ipilimumab would be necessary to improve outcomes in ccrcc1, and TKIs should provide responses in ccrcc2/3.
The primary end point, ORR, for nivolumab plus ipilimumab turned out to be comparable across all groups. In ccrcc1 ORR for nivolumab was half that of nivolumab plus ipilimumab, while both were comparable ( 55%) in ccrcc4, bringing into question the additive benefit for ipilimumab in this subgroup. In ccrcc2, ORR was similar for TKI monotherapy and nivolumab plus ipilimumab; supporting a good prognosis on single agent TKI for these patients [59].
DISCUSSION
A large body of analyses have sought to identify candidate biomarkers to incorporate into standard clinical practice. Despite progress, the current array of biomarkers have not evolved to a point where they translate into routine use for treatment selection in patients with mccRCC.
The use of IHC markers are generally convenient, resource efficient and have rapid turn-around. PD-L1 has perhaps been the most studied. PD-L1 expression (independent of assay use, or whether tumour or immune cells are stained) consistently confers a negative prognostic status in the context of VEGF TKI monotherapy [8, 13]. Investigation across front line trials in mccRCC incorporating ICB demonstrates superiority over VEGF TKI monotherapy independent of PD-L1, emphasizing the importance of immunotherapy in front line treatment for RCC [3, 15]. While ICB/VEGF combinations show similar efficacy independent of PD-L1 positivity, only the ICB/ICB combination of nivolumab plus ipilimumab shows a higher magnitude of benefit for those who are PD-L1 positive versus negative [17].
Defining the mutational profile in mccRCC has increased our understanding of the genetic underpinnings and led to analyses of numerous candidate biomarkers, though to date there are not strong or actionable targets to justify the routine use of genomic sequencing for unselected patients. TMB has been utilized as a biomarker conferring response to immunotherapy in lung cancer [60] and as such, pembrolizumab received a pan-tumour FDA indication for TMB high tumours across adult malignancies [61]. However, TMB has not discriminated results in mccRCC in trials incorporating ICB, and should not be incorporated in decision making to recommend ICB therapy in this setting [52].
PBRM1 exemplifies the challenges of developing a predictive biomarker with conflicting results dependent on treatment context. Braun et al. demonstrated the modest effect on response and survival of PBRM1 truncating mutations for patients on anti-PD-1 therapy whom had received prior antiangiogenic therapy [37, 38]. Discordant with this, studies of PBRM1 mutations in the first-line setting have produced negative results [10, 36]. To that end, in the front-line setting where ICB-based regimens are now preferred, PBRM1 does not have a role as a predictive biomarker. Further analysis by Braun et al. showed the complex interactions between PBRM1 mutation status and CD8 T cell infiltration, whereby tumours with low CD8 infiltration are enriched for PBRM1 mutations, enhancing response to ICB, while tumours with CD8 infiltrated tumours are enriched for mutations in 9p21.3, associated with resistance to ICB. This highlights the complexity of looking at any single biomarker [38].
To that end, gene signatures are evolving and have been evaluated within the contemporaneous ICB combination trials. Upregulated angiogenesis signatures have consistently been able to enrich for more favourable outcomes with sunitinib monotherapy and a comparative reduction in the relative benefit from combination ICB therapy [10, 16]. However, despite enriching for outcomes on sunitinib patients may still derive benefit from combination with ICB, particularly when accounting for likelihood of long-term remission, seldom achieved with VEGF monotherapy. Separate trials have developed and validated unique signatures, each applying only to the study regimen; when such signatures are applied to a different therapy, the results no longer discriminated for benefit on ICB regimens. In addition, practical difficulties exist; for example, lead time on specimen processing may impede clinical decision making. Furthermore, temporal changes in expression are poorly characterized. Most assays were performed on archival nephrectomy specimens. Whether there may be differences in gene signature based on biopsy site or on treatment are not known. Prospective interrogation is needed with signatures that are applicable to multiple treatments, and access to rapid turn-around times to facilitate timely clinical decisions.
The challenge of biomarker development does not exist in a vacuum. As new candidates develop, new approaches to therapy potentially change the landscape of biomarker discovery. While important clinical questions include de-escalating to monotherapy with ICB or TKI, or differentiating between combination ICB regimens, current trials are looking to improve outcomes through multiplexing therapy. COSMIC-313 is exploring the triplet of ipilimumab, nivolumab, and cabozantinib versus nivolumab plus ipilimumab, while new targeted therapies against HIF2A are in phase 3 trials [62, 63]. These newer approaches are ripe for biomarker development and likely require adaptation of our current knowledge to a new treatment space.
Although non-clear cell renal cell cancer was not the focus of this review, it displays a separate molecular landscape to mccRCC, and may harbor multiple candidates for directing therapy. Genomic mutational analysis have assisted in refining this tumour classification and identified potential markers for drug sensitivity; in the case of papillary kidney cancer this had led to biomarker-driven trials, which hold promise for enriching therapy response and potentially selecting treatment [64, 65].
Being adaptable to utilising the available platforms with NGS and GEP to identify new targets and the optimal approach to therapy will be important for optimizing patient outcomes. Ultimately, a useful biomarker must to be readily usable, affordable, clinically meaningful, and easy to incorporate into clinical practice in expedient fashion. To date, nothing has shown this promise in mccRCC though research is ongoing. To that end, even as candidates develop, bringing down the cost and time of these analyses will be as important for patients as discovering the right biomarker.
AUTHOR CONTRIBUTIONS
All authors made substantial contributions to the work; ALS, PAB and BAM were involved with project inception, design and development of literature search. PAB performed the main literature search. ALS performed the hand search of conference abstracts. ALS and BAM performed the literature analysis, synthesis of results, and first draft of manuscript. ALS, PAB and BAM were all involved in writing the article, approve the final version to be published and agree to be accountable for the accuracy and integrity of the work.
FUNDING
The authors report no funding.
CONFLICTS OF INTEREST
ALS: nil disclosures. PAB: nil disclosures. BAM: BAM discloses payment for consulting with Bayer, Astellas, Astra Zeneca, Seattle Genetics, Exelixis, Nektar, Pfizer, Janssen, Genentech, Eisai, EMD Serono, BMS and Dendreon. He received research support to Dana Farber Cancer Institute (DFCI) from Bristol Myers Squibb, Calithera, Exelixis, Seattle Genetics.