
Abstract
Background:
Immune checkpoint inhibitors (ICIs) have become the mainstay treatment of metastatic kidney cancer, demonstrating enhanced outcomes and durable responses in select patient subgroups. However, identifying reliable prognostic biomarkers for treatment outcomes remains challenging.
Objectives:
This study aimed to assess the correlation between baseline inflammatory markers and overall survival (OS), progression-free survival (PFS), and clinical benefit (CB) in metastatic kidney cancer patients receiving ICIs. CB was defined as patients achieving stable disease, partial response, or complete response.
Design:
Retrospective, single-center study.
Methods:
A retrospective analysis was conducted on 401 adult patients with advanced kidney cancer treated with ICIs at Emory Winship Cancer Institute between 2018 and 2023. Modified Glasgow Prognostic Score (mGPS), neutrophil-to-lymphocyte (NLR), monocyte-to-lymphocyte (MLR), platelet-to-lymphocyte (PLR), and neutrophil-to-eosinophil ratios (NER) were collected from baseline blood samples.
Results:
Among 401 patients (median age, 66; 71% male; 21% Black/African American), median follow-up was 43.0 months (95% CI, 36.6–51.4). Patients with mGPS scores of 0 had longer OS than those with a score of 1 (hazard ratio (HR), 0.38; 95% CI, 0.23–0.62; p < 0.001) and 2 (HR, 0.37; 95% CI, 0.20–0.67; p = 0.001), and longer PFS compared to patients with mGPS scores of 1 (HR, 0.66; 95% CI, 0.44–0.98; p = 0.039) and 2 (HR, 0.44; 95% CI, 0.29–0.67; p < 0.001). Low baseline NLR was associated with longer PFS (HR, 0.73; 95% CI, 0.54–0.97; p = 0.032). Low baseline MLR correlated with improved OS (HR, 0.60; 95% CI, 0.44–0.83; p = 0.002) and PFS (HR, 0.73; 95% CI, 0.55–0.97; p = 0.031). Similarly, low baseline PLR was associated with higher CB likelihood (odds ratio (OR), 2.20; 95% CI, 1.31–3.69; p = 0.003), and low baseline NER was linked to improved OS (HR, 0.63; 95% CI, 0.46–0.87; p = 0.004), PFS (HR, 0.67; 95% CI, 0.51–0.88; p = 0.003), and higher CB (OR, 2.04; 95% CI, 1.20–3.46; p = 0.008).
Conclusion:
Lower levels of systemic inflammatory markers are associated with more favorable clinical outcomes with ICI treatment. Prospective studies are needed for further validation.
Keywords
Introduction
Kidney cancer is the seventh most common cancer in the United States, with 81,800 new cases estimated for 2023. 1 The 5-year relative survival rate for metastatic disease is 17.4%. 2 Immune checkpoint inhibitors (ICIs) have been used to treat various types of cancer for over a decade. They were first introduced to the treatment of advanced kidney cancer in 2015 and became one of the standard-of-care treatment options in 2018. 3 ICIs have demonstrated improved outcomes and more durable responses when compared to sunitinib. 4 However, not all patients respond to ICI treatment, and identifying those who might benefit remains a significant challenge for clinicians due to the lack of reliable, clinically actionable biomarkers. Several biomarkers show promising results for predicting the outcomes; further studies involving larger and more diverse patient cohorts are needed to verify their reliability and identify novel biomarkers. 5
ICIs are monoclonal antibodies that target specific regulatory immune receptors on the surface of cells. The mechanism of action of these agents is based on the inhibition of signals that attenuate the immune response, causing the immune system to exert a more robust immune response against tumor cells.6–8 As a result, ICI treatment depends on the patient’s existing immune capabilities.
Inflammation has been extensively researched in the cancer field and has been identified as one of the hallmark features of cancer. 9 Inflammatory markers in peripheral blood have been widely studied in various types of cancer, including kidney cancer, where multiple studies have shown a link between inflammatory biomarkers and disease prognosis.10–13 Tumor-associated inflammation promotes immune dysfunction, tumor growth, angiogenesis, and metastasis. 14
Glasgow prognostic score (GPS) has been used as a scoring system to evaluate the prognosis of different cancer types by measuring serum albumin and C-reactive protein (CRP) levels. 15 It has been shown that GPS correlates with survival outcomes in various malignancies, including renal cell carcinoma (RCC), with higher scores often indicating poorer prognosis.16,17 Neutrophil-to-lymphocyte ratio (NLR) is another widely studied marker of systemic inflammation, associated with prognosis in a variety of cancers, such as RCC.18–20 Neutrophils are usually associated with a pro-inflammatory state, while lymphocytes are generally involved in immune surveillance and anti-tumor activity.21–26 Elevated NLR, therefore, may serve as an important metric of systemic inflammation, suggesting a shift toward an inflammatory environment that could influence tumor behavior and patient outcomes. Similarly, the monocyte-to-lymphocyte ratio (MLR) and platelet-to-lymphocyte ratio (PLR) are potential biomarkers for RCC prognosis.27,28 Furthermore, the neutrophil-to-eosinophil ratio (NER), although less commonly studied, has also been suggested as a marker of inflammatory response in RCC.29,30 While these ratios offer promising insights into treatment outcomes, their clinical utility as reliable biomarkers in RCC remains under investigation. In this study, we aimed to assess the association of various inflammatory markers—including modified Glasgow Prognostic Score (mGPS), NLR, MLR, PLR, and NER—with clinical outcomes in patients with advanced renal cell carcinoma (aRCC) treated with ICIs. We hypothesized that lower levels of these markers would correlate with more favorable clinical outcomes, specifically overall survival (OS), progression-free survival (PFS), and clinical benefit (CB), in this patient population.
Materials and methods
Patients and data
We reviewed the medical records of 401 patients with aRCC who received ICIs at the Winship Cancer Institute of Emory University between January 1, 2018 and August 31, 2023. Institutional Review Board approval was received for retrospective patient chart review. Patients were identified from the pharmacy drug administration database. Data collected from the patient’s medical record, including demographic information, primary and metastatic tumor histology, nephrectomy status, Eastern Cooperative Oncology Group (ECOG) performance status, number and site of distant metastases, number and type of prior lines of systemic therapy, combination therapies, concomitant medications, date of radiographic or clinical progression, reason for treatment stop, best response to treatment, CB, objective response, date of death or last follow-up, International Metastatic RCC Database Consortium (IMDC) risk score. Calcium, albumin, CRP, neutrophil, lymphocyte, monocyte, eosinophil, and basophil values were collected at baseline and at 6 ± 2 weeks after treatment initiation. Treatment response was evaluated using Response Evaluation Criteria in Solid Tumor (RECIST), version 1.1. 31 Our study adhered to the Reporting Recommendations for Tumour Marker Prognostic Studies (REMARK) guidelines 32 (Supplemental File 1).
Statistical analysis
The clinical endpoints assessed in this study were OS, PFS, and CB. OS was measured from treatment initiation to death or to the date of censoring at the last follow-up. PFS was defined as the time from treatment initiation to either disease progression, death, or censoring at the last follow-up, whichever occurred first. CB was defined as patients achieving stable disease, partial response, or complete response. mGPS was formed as follows: Patients with both an elevated C-reactive protein (⩾10 mg/L) and low albumin (<35 g/L) were given a score of 2; Patients who only had an elevated C-reactive protein level were given a score of 1. Patients with normal C-reactive protein levels were given a score of 0. NLR is neutrophil count divided by lymphocyte count. MLR is monocyte count divided by lymphocyte count. PLR is platelet count divided by lymphocyte count. NER is neutrophil count divided by eosinophil count. Patients with absolute eosinophil count reported as 0.00, calculated as 0.01. The optimal cut-off value of NLR, MLR, PLR, and NER was calculated by searching all possible unique cuts for OS and determined at the value that achieves the maximization of separation in KM analysis with a minimized bias-adjusted log-rank p-value.33,34
The univariate association between each covariate and study cohorts (high vs low inflammatory markers) was assessed using the Chi-square or Fisher’s exact test for categorical covariates and ANOVA for numerical covariates. The univariate association of each covariate, including study cohorts with OS and PFS, was assessed using Cox proportional hazards models. Univariate analyses (UVA) were performed using logistic regression models to estimate odds ratios (OR) for CB. Multivariable analyses (MVA) were done by a backward variable selection approach with a removal criterion of 0.2. Kaplan–Meier curves were generated to compare the survival outcomes of all cohorts. The subgroup analyses were carried out by introducing interaction terms between an inflammation biomarker and a stratified variable (e.g., Race and Treatment), into MVA, in which we aim to test the differentiated association between biomarkers and clinical outcomes across the subgroups. Due to the exploratory nature of this study, we tested the association with each biomarker separately, not jointly; hence, the p-value reported was not adjusted for multiple comparisons. Statistical analysis was conducted using SAS version 9.4 (SAS Institute, Cary, NC, USA), and SAS macros developed by Biostatistics Shared Resource at Winship Cancer Institute with a p-value <0.05 representing statistical significance. 35
Results
Demographic information, disease characteristics, and treatment regimens
Summarized information for patient characteristics is presented in Table 1. Of the 401 patients, 283 (70.6%) were male, and 118 (29.4%) were female. The mean age of the group was 64.37, and the median age was 66.00 (min–max 18–95). Two hundred eighty-five (71.1%) of the patients were White, and 85 (21.2%) were African American. Two hundred seventeen (54.1%) were non-smokers, 297 (81.1%) patients had clear cell histology, and 302 (75.3%) of the patients underwent complete or partial nephrectomy. IMDC risk scores were as follows: 66 (16.5%) patients with favorable risk, 230 (57.4%) with intermediate risk, and 105 (26.2%) with poor risk disease. One hundred seventy-six (47.7%) patients had Eastern Cooperative Oncology Group Performance Status (ECOG PS) of 1, 67 (17.8%) had ECOG PS 2 or higher, 239 (59.6%) patients treated as first-line, 139 (34.7%) patients treated with programmed cell death protein-1 inhibitors (PD-1i), 131 (32.7%) with PD-1i and cytotoxic T-lymphocyte-associated protein-4 inhibitor combination therapy, 108 (26.9%) with PD-1i and tyrosine kinase inhibitor (TKI) combination therapy.
Demographic information, disease characteristics, and treatment regimens.
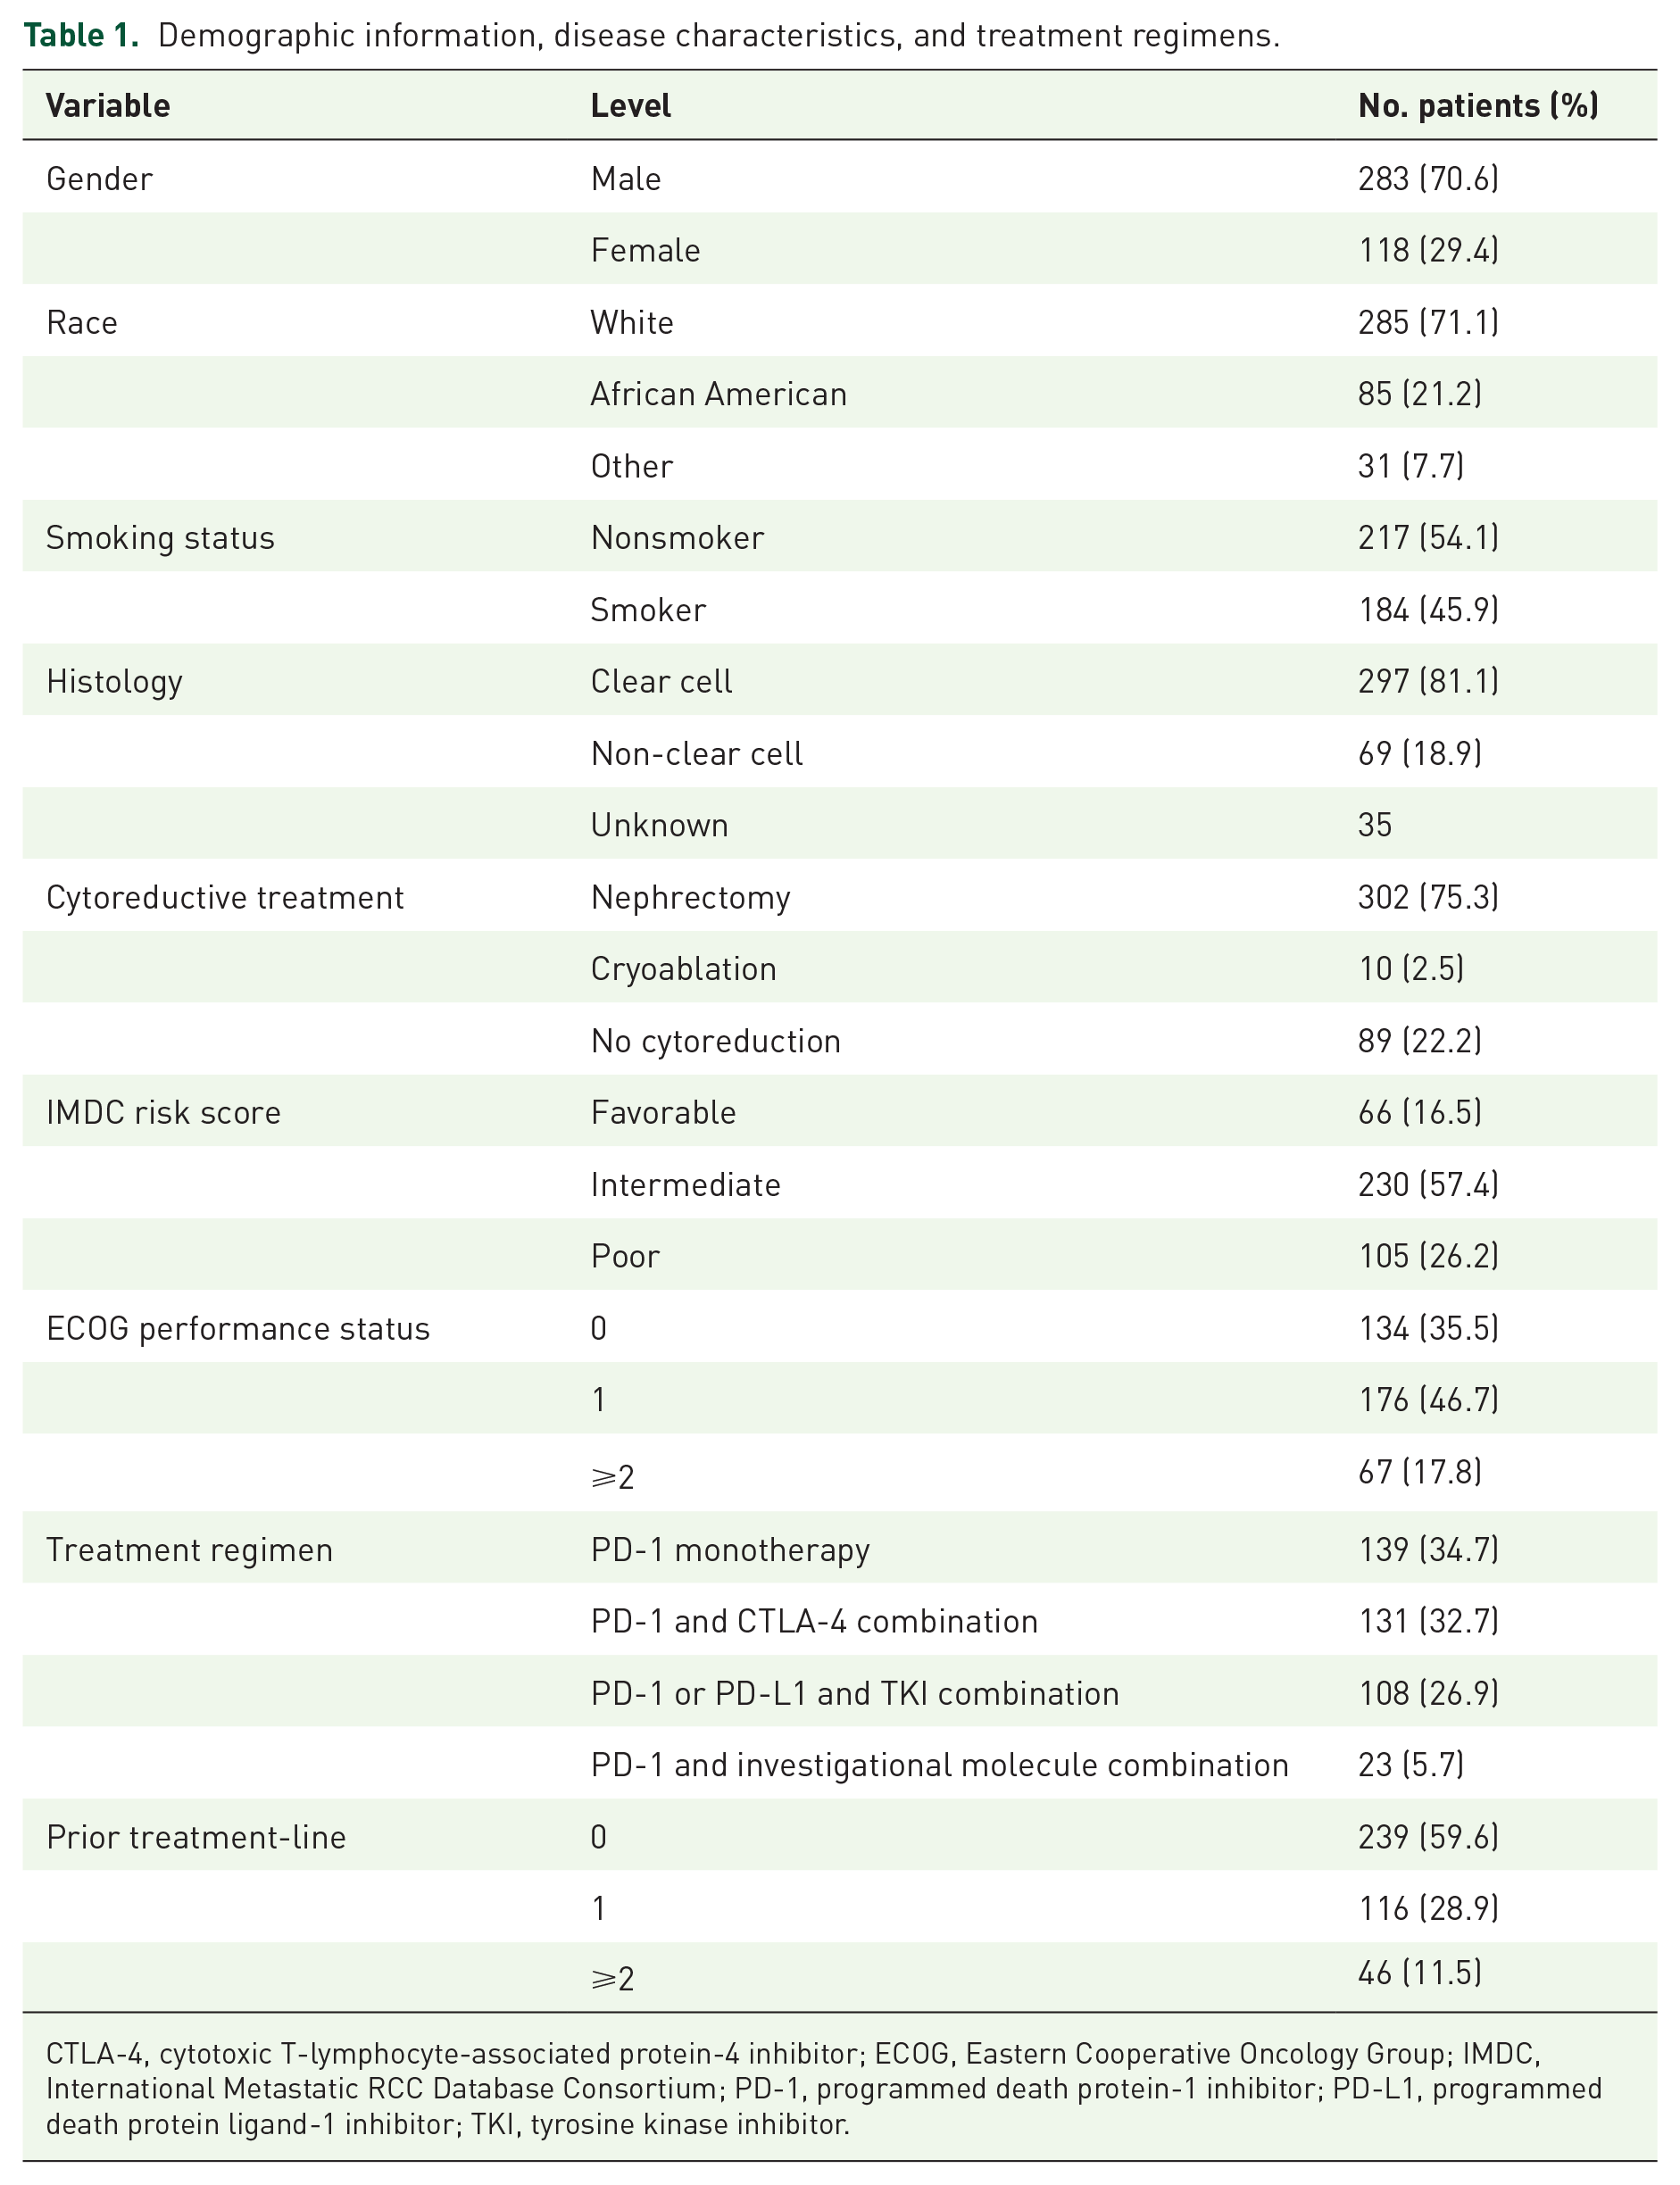
CTLA-4, cytotoxic T-lymphocyte-associated protein-4 inhibitor; ECOG, Eastern Cooperative Oncology Group; IMDC, International Metastatic RCC Database Consortium; PD-1, programmed death protein-1 inhibitor; PD-L1, programmed death protein ligand-1 inhibitor; TKI, tyrosine kinase inhibitor.
Association of biomarkers and clinical outcomes
All variables and their association with OS, PFS, and CB were investigated in UVA and MVA. The median follow-up was 43.0 months (95% CI, 36.6–51.4). The median OS and 5-year survival rates of each variable are discussed in Table 2. Kaplan–Meier plots of OS and PFS for each variable can be found in Figures 1 and 2. In UVA, a baseline mGPS of 0 was associated with longer OS compared to a score of 2 (hazard ratio (HR), 0.29; 95% confidence interval (CI), 0.19–0.45; p < 0.001). Low baseline NLR was associated with longer OS (HR, 0.55; 95% CI, 0.42–0.73; p < 0.001). Low baseline MLR (HR, 045; 95% CI, 0.34–0.60; p < 0.001), PLR (HR, 0.62; 95% CI, 0.48–0.81; p < 0.001), and NER (HR, 0.60; 95% CI, 0.45–0.78; p < 0.001) were associated with longer OS. Results from mGPS, MLR, and NER were consistent in the multivariable model (Table 3). In MVA, a baseline mGPS of 0 was associated with longer OS relative to scores 1 (HR, 0.38; 95% CI, 0.23–0.62; p < 0.001) and 2 (HR, 0.37; 95% CI, 0.20–0.67; p = 0.001). Low baseline MLR (HR, 0.60; 95% CI, 0.44–0.83; p = 0.002) and NER (HR, 0.63; 95% CI, 0.46–0.87; p = 0.004) were associated with extended OS. In MVA, a similar trend was seen in NLR; however, this was not statistically significant (HR, 0.72; 95% CI, 0.51–1.01; p = 0.056).
Association between inflammatory markers and overall survival outcomes.
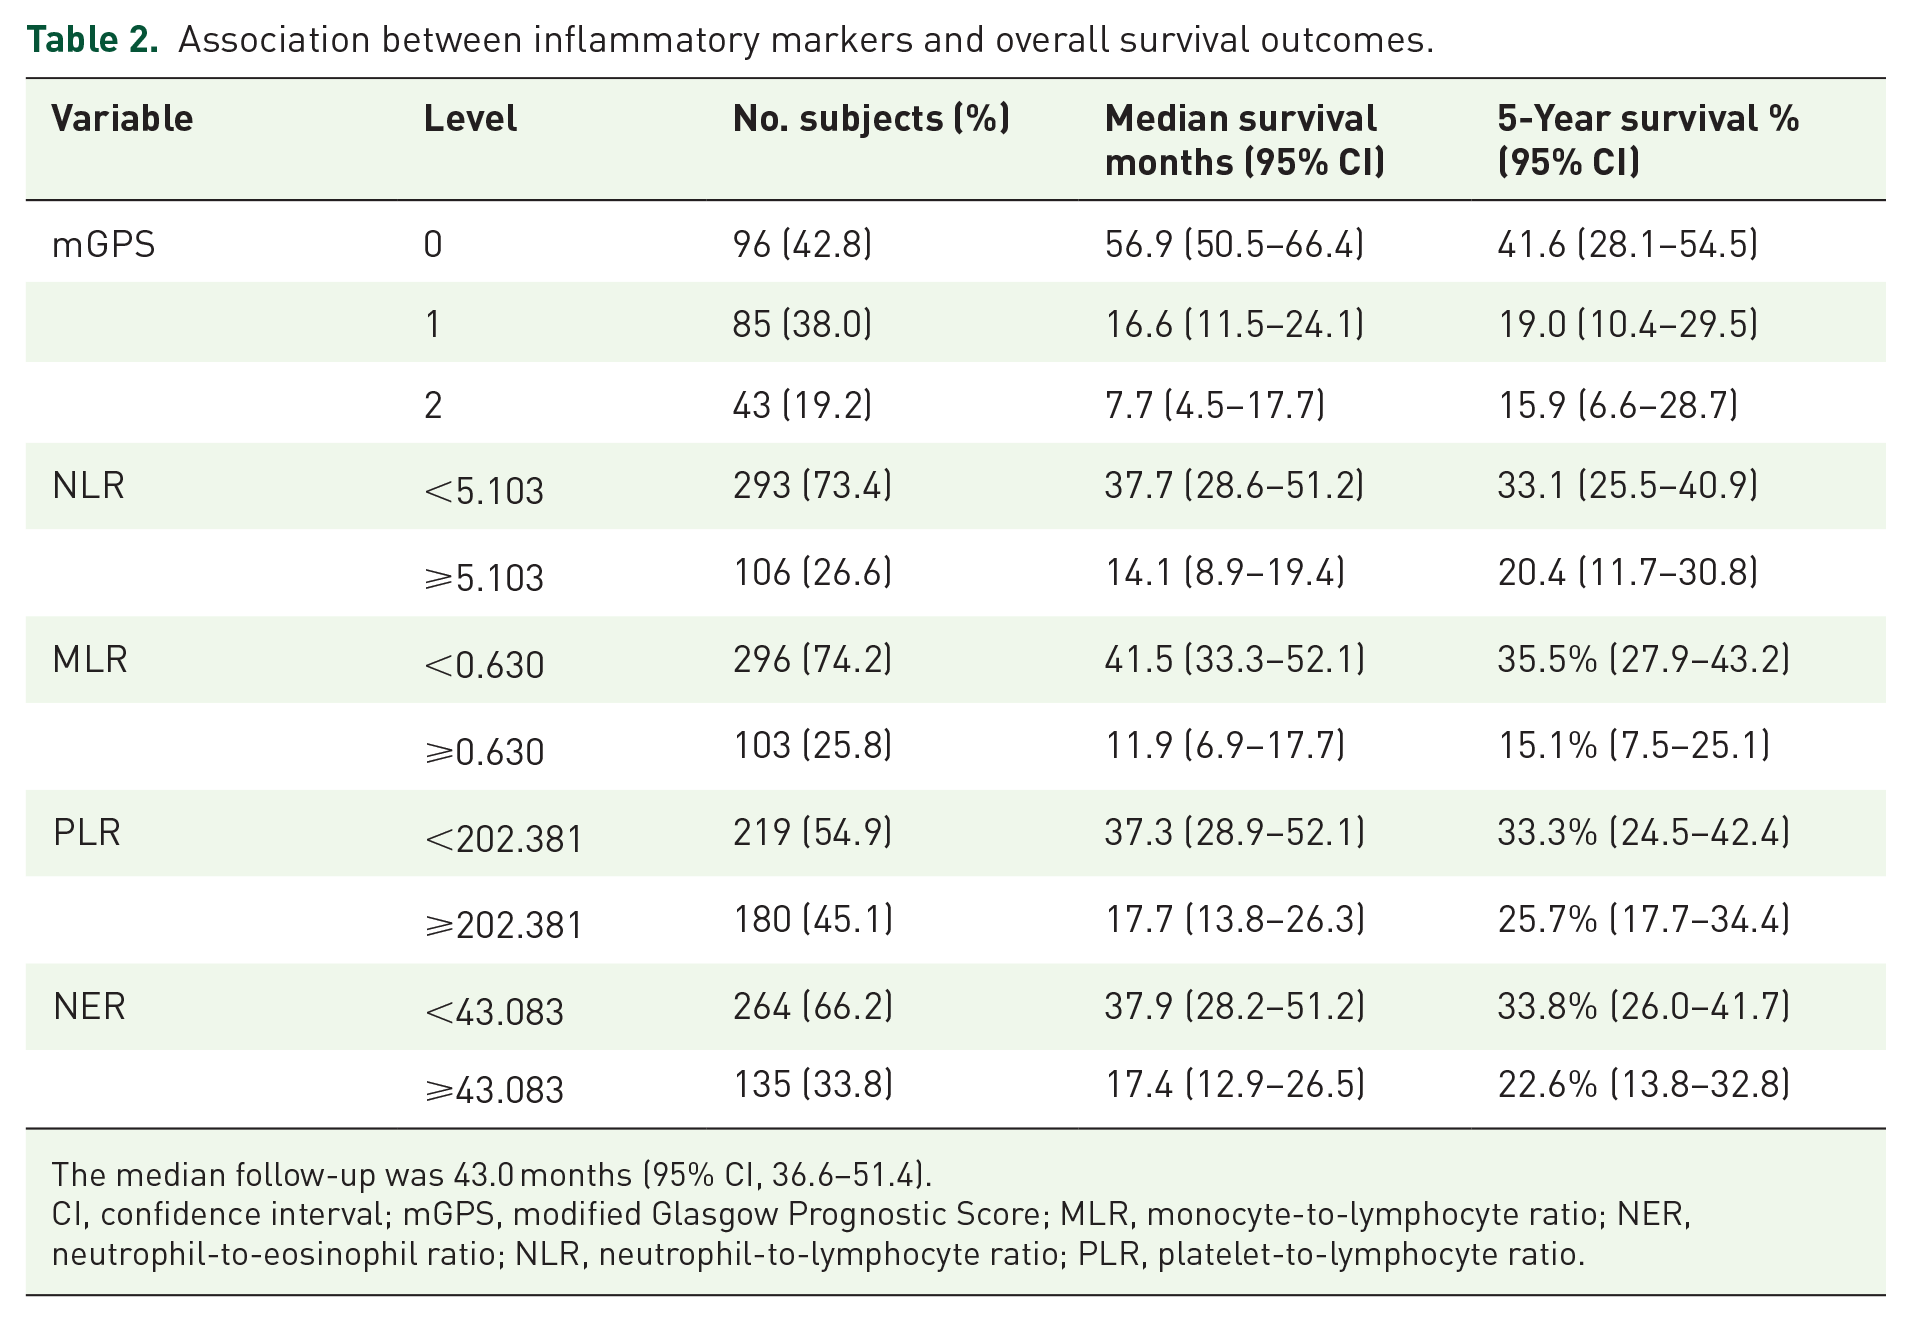
The median follow-up was 43.0 months (95% CI, 36.6–51.4).
CI, confidence interval; mGPS, modified Glasgow Prognostic Score; MLR, monocyte-to-lymphocyte ratio; NER, neutrophil-to-eosinophil ratio; NLR, neutrophil-to-lymphocyte ratio; PLR, platelet-to-lymphocyte ratio.

(a) Kaplan–Meier plots illustrate the association between baseline-modified mGPS and overall survival. (b) Kaplan–Meier plots illustrate the association between high versus low baseline NLR and overall survival. (c) Kaplan–Meier plots illustrate the association between high versus low baseline MLR and overall survival. (d) Kaplan–Meier plots illustrate the association between high versus low baseline PLR and overall survival. (e) Kaplan–Meier plots illustrate the association between high versus low baseline NER and overall survival.
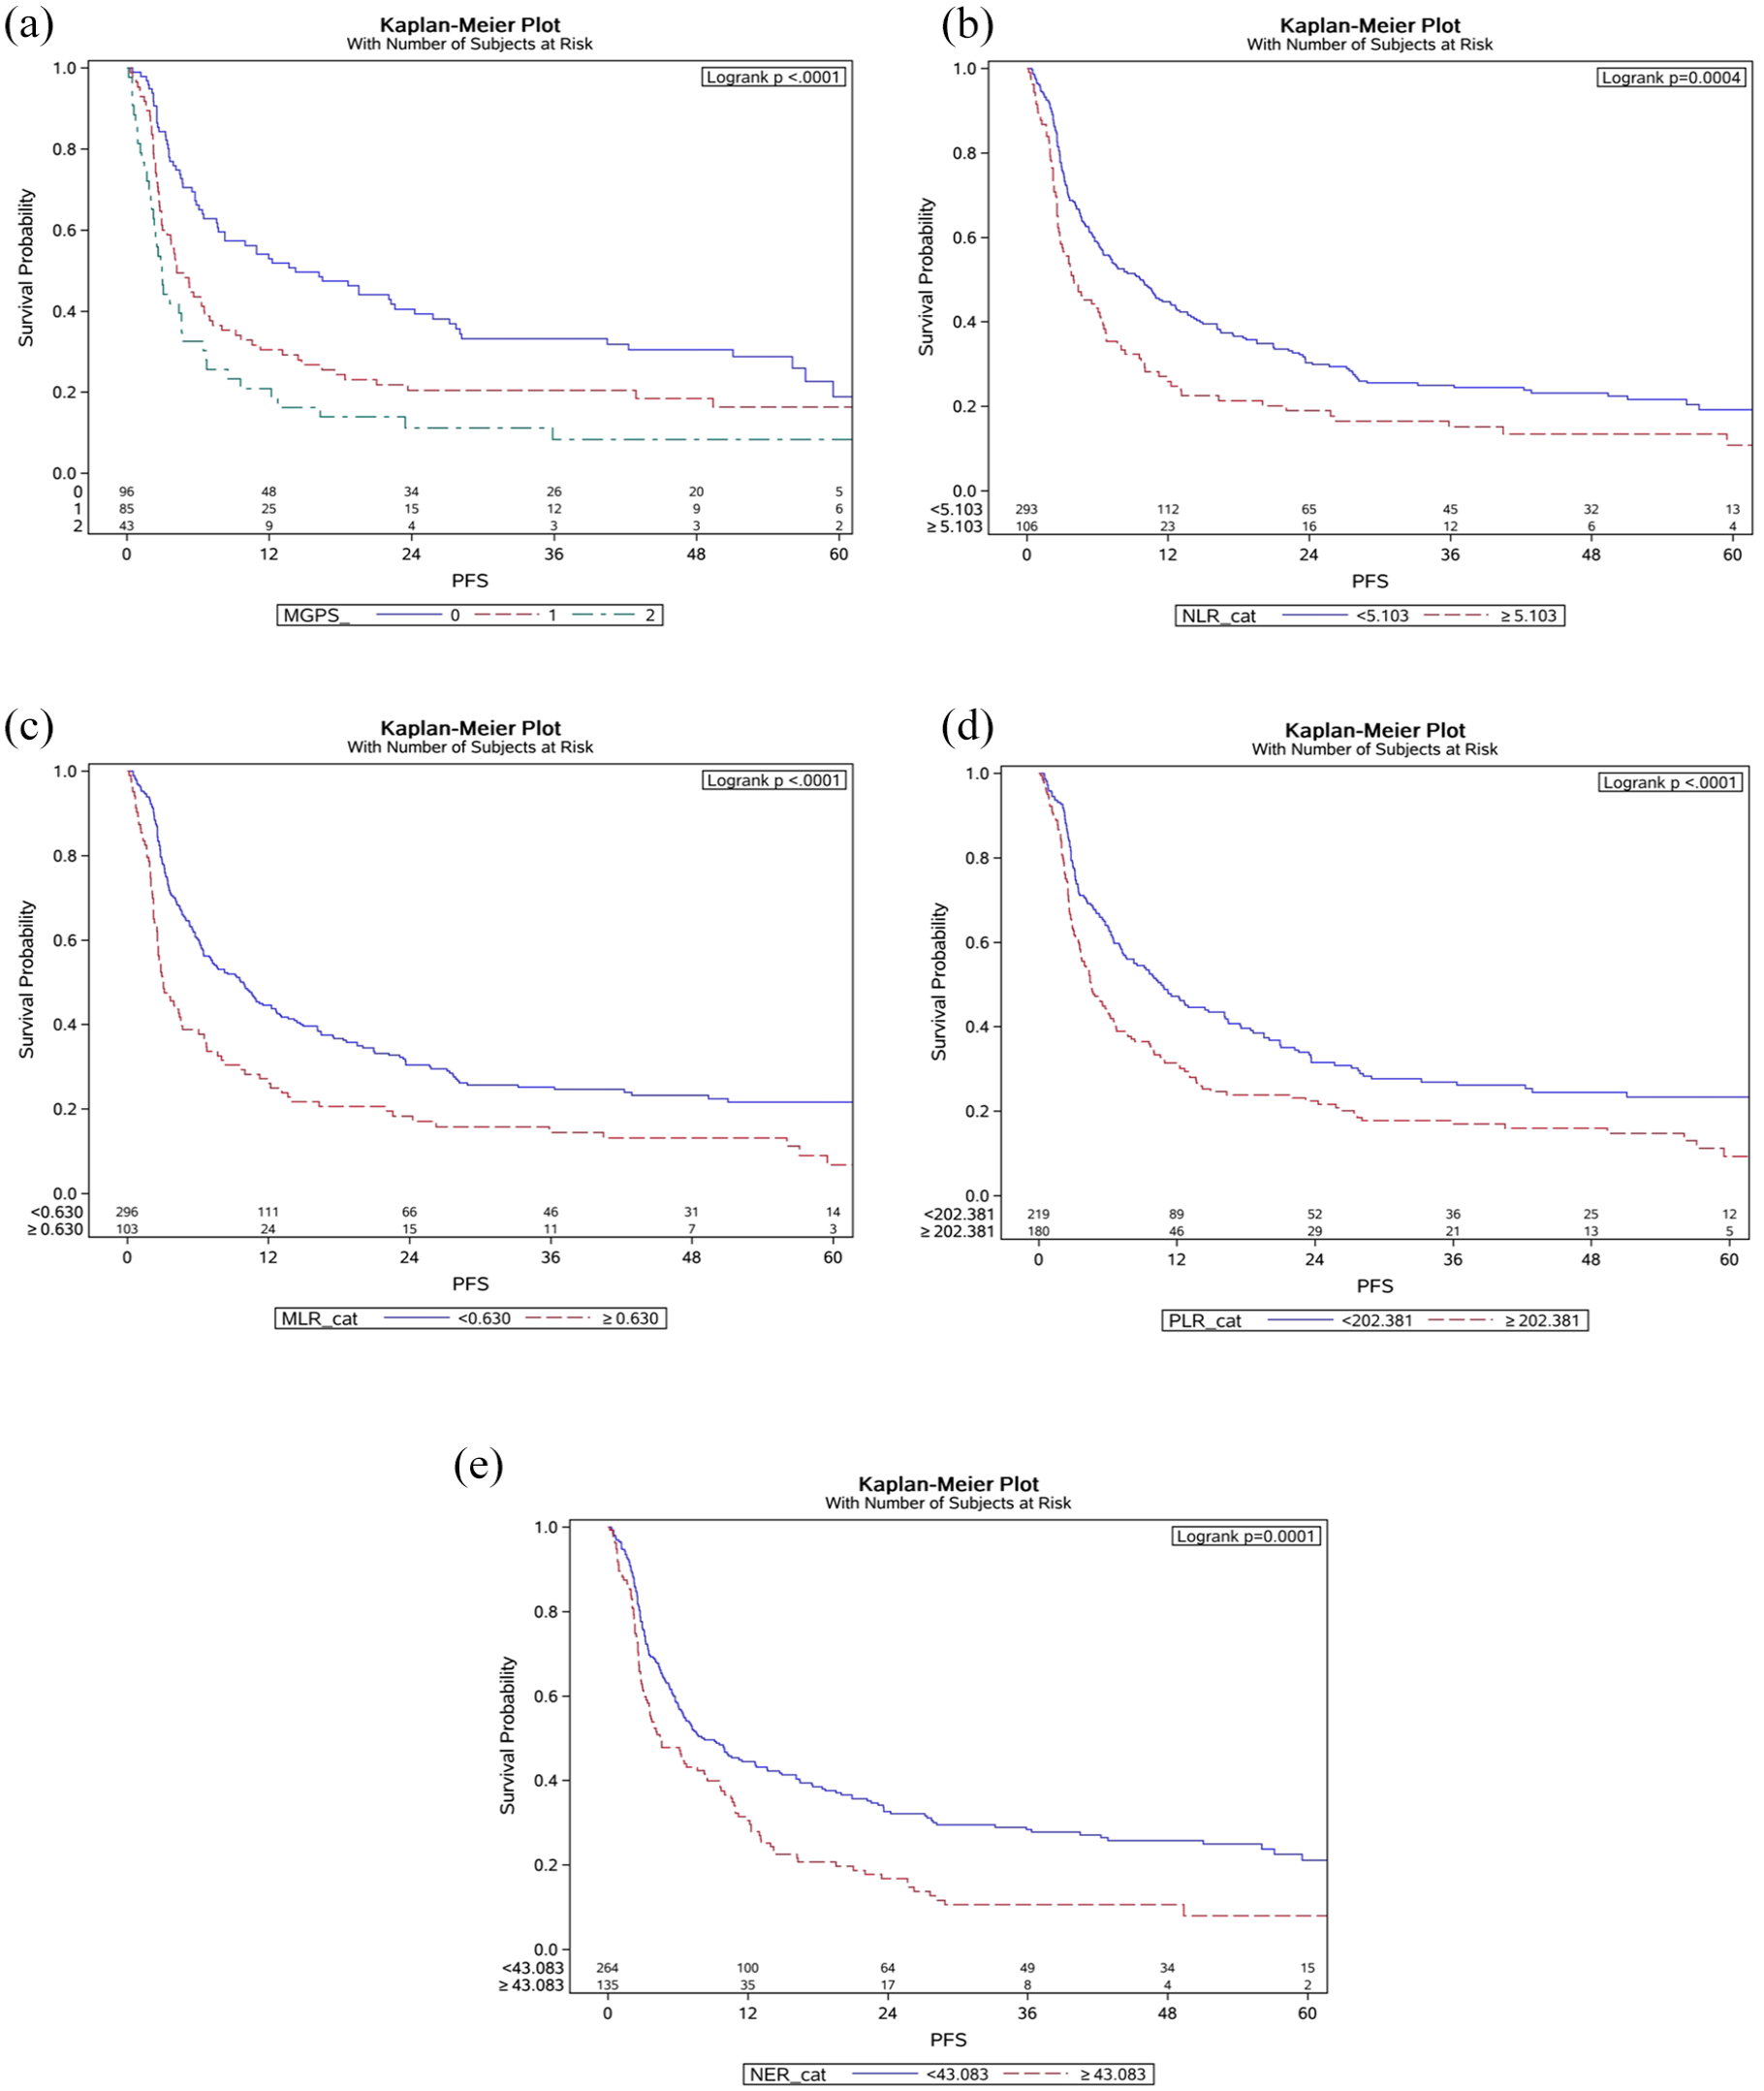
(a) Kaplan–Meier plots illustrate the association between baseline mGPS and progression-free survival. (b) Kaplan–Meier plots illustrate the association between high versus low baseline NLR and progression-free survival. (c) Kaplan–Meier plots illustrate the association between high versus low baseline MLR and progression-free survival. (d) Kaplan–Meier plots illustrate the association between high versus low baseline PLR and progression-free survival. (e) Kaplan–Meier plots illustrate the association between high versus low baseline NER and progression-free survival.
Univariate and multivariate analysis of baseline markers with overall survival.

Backward selection with an alpha level of removal of 0.2 was used while building the multivariate model for each biomarker separately. The following variables were controlled in the mGPS model: gender, BMI, IMDC risk group, clear cell histology, number of prior treatment lines, liver metastases, and ECOG performance status. The following variables were controlled in the NLR model: race, BMI, smoking status, IMDC risk group, clear cell histology, number of prior treatment lines, liver metastases, and ECOG performance status. The following variables were controlled in the MLR model: age, race, BMI, smoking status, IMDC risk group, clear cell histology, number of prior treatment lines, and liver metastases. The following variables were controlled in the PLR and the NER model: BMI, smoking status, IMDC risk group, clear cell histology, number of prior treatment lines, liver metastases, and ECOG performance status.
BMI, body mass index; CI, confidence interval; ECOG, Eastern Cooperative Oncology Group; HR, hazard ratio; IMDC, International Metastatic RCC Database Consortium; mGPS, modified Glasgow Prognostic Score; MLR, monocyte-to-lymphocyte ratio; MVA, multivariate analysis; NER, neutrophil-to-eosinophil ratio; NLR, neutrophil-to-lymphocyte ratio; OS, overall survival; PLR, platelet-to-lymphocyte ratio; UVA, univariate analysis.
In UVA of PFS, a baseline mGPS of 0 (HR, 0.42; 95% CI, 0.28–0.62; p < 0.001) and 1 (HR, 0.67; 95% CI, 0.45–0.98; p = 0.041) were associated with longer PFS compared to a score of 2. Low baseline levels of NLR (HR, 0.64; 95% CI, 0.50–0.82; p < 0.001), MLR (HR, 0.56; 95% CI, 0.44–0.72; p < 0.001), PLR (HR, 0.64; 95% CI, 0.51–0.80; p < 0.001), NER (HR, 0.63; 95% CI, 0.50–0.80; p < 0.001) were associated with longer PFS (Table 4). MVA confirmed similar results. A baseline mGPS of 0 was associated with longer PFS relative to scores 1 (HR, 0.61; 95% CI, 0.43–0.87; p = 0.006) and 2 (HR, 0.44; 95% CI, 0.29–0.67; p < 0.001). Low baseline levels of NLR (HR, 0.73; 95% CI, 0.54–0.97; p = 0.032), MLR (HR, 0.73; 95% CI, 0.55–0.97; p = 0.031), NER (HR, 0.67; 95% CI, 0.51–0.88; p = 0.003) were associated with longer PFS in our multivariate model.
Univariate and multivariate analysis of baseline markers with progression-free survival.

Backward selection with an alpha level of removal of 0.2 was used while building the multivariate model for each biomarker separately. The following variables were controlled in the mGPS model: race, BMI, treatment modality, and number of distant metastases. The following variables were controlled in the NLR group: Race, BMI, IMDC risk group, clear cell histology, number of prior treatment lines, liver metastases, treatment modality, and number of distant metastases. The following variables were controlled in the MLR model: Race, BMI, IMDC risk group, number of prior treatment lines, liver metastases, treatment modality, and number of distant metastases. The following variables were controlled in the PLR model: Race, BMI, smoking status, IMDC risk group, clear cell histology, number of prior treatment lines, liver metastases, treatment modality, and number of distant metastases. The following variables were controlled in the NER model: BMI, smoking status, IMDC risk group, clear cell histology, number of prior treatment lines, liver metastases, treatment modality, and number of distant metastases.
BMI, body mass index; HR, hazard ratio; IMDC, International Metastatic RCC Database Consortium; mGPS, modified Glasgow Prognostic Score; MLR, monocyte-to-lymphocyte ratio; MVA, multivariate analysis; NER, neutrophil-to-eosinophil ratio; NLR, neutrophil-to-lymphocyte ratio; PFS, progression-free survival; PLR, platelet-to-lymphocyte ratio; UVA, univariate analysis.
We also evaluated CB to explore associations between inflammatory markers and treatment response. UVA of mGPS showed that a baseline score of 0 (OR, 3.03; 95% CI, 1.35–6.77; p = 0.007) was associated with a higher likelihood of having benefit from the treatment relative to 2. In UVA, low baseline levels of NLR (OR, 1.86; 95% CI, 1.14–3.03; p = 0.013), MLR (OR, 1.83; 95% CI, 1.10–3.02; p = 0.019), PLR (OR, 2.37; 95% CI, 1.52–3.71; p < 0.001), and NER (OR, 1.93; 95% CI, 1.22–3.05; p = 0.005) were associated with a higher likelihood of achieving CB. MVA results indicated that low baseline levels of PLR (OR, 2.20; 95% CI, 1.31–3.69; p = 0.003) and NER (OR, 2.04; 95% CI, 1.20–3.46; p = 0.008) were associated with a higher likelihood of achieving CB (Table 5).
Univariate and multivariate analysis of baseline markers with receiving clinical benefit from immune checkpoint inhibitor treatment.
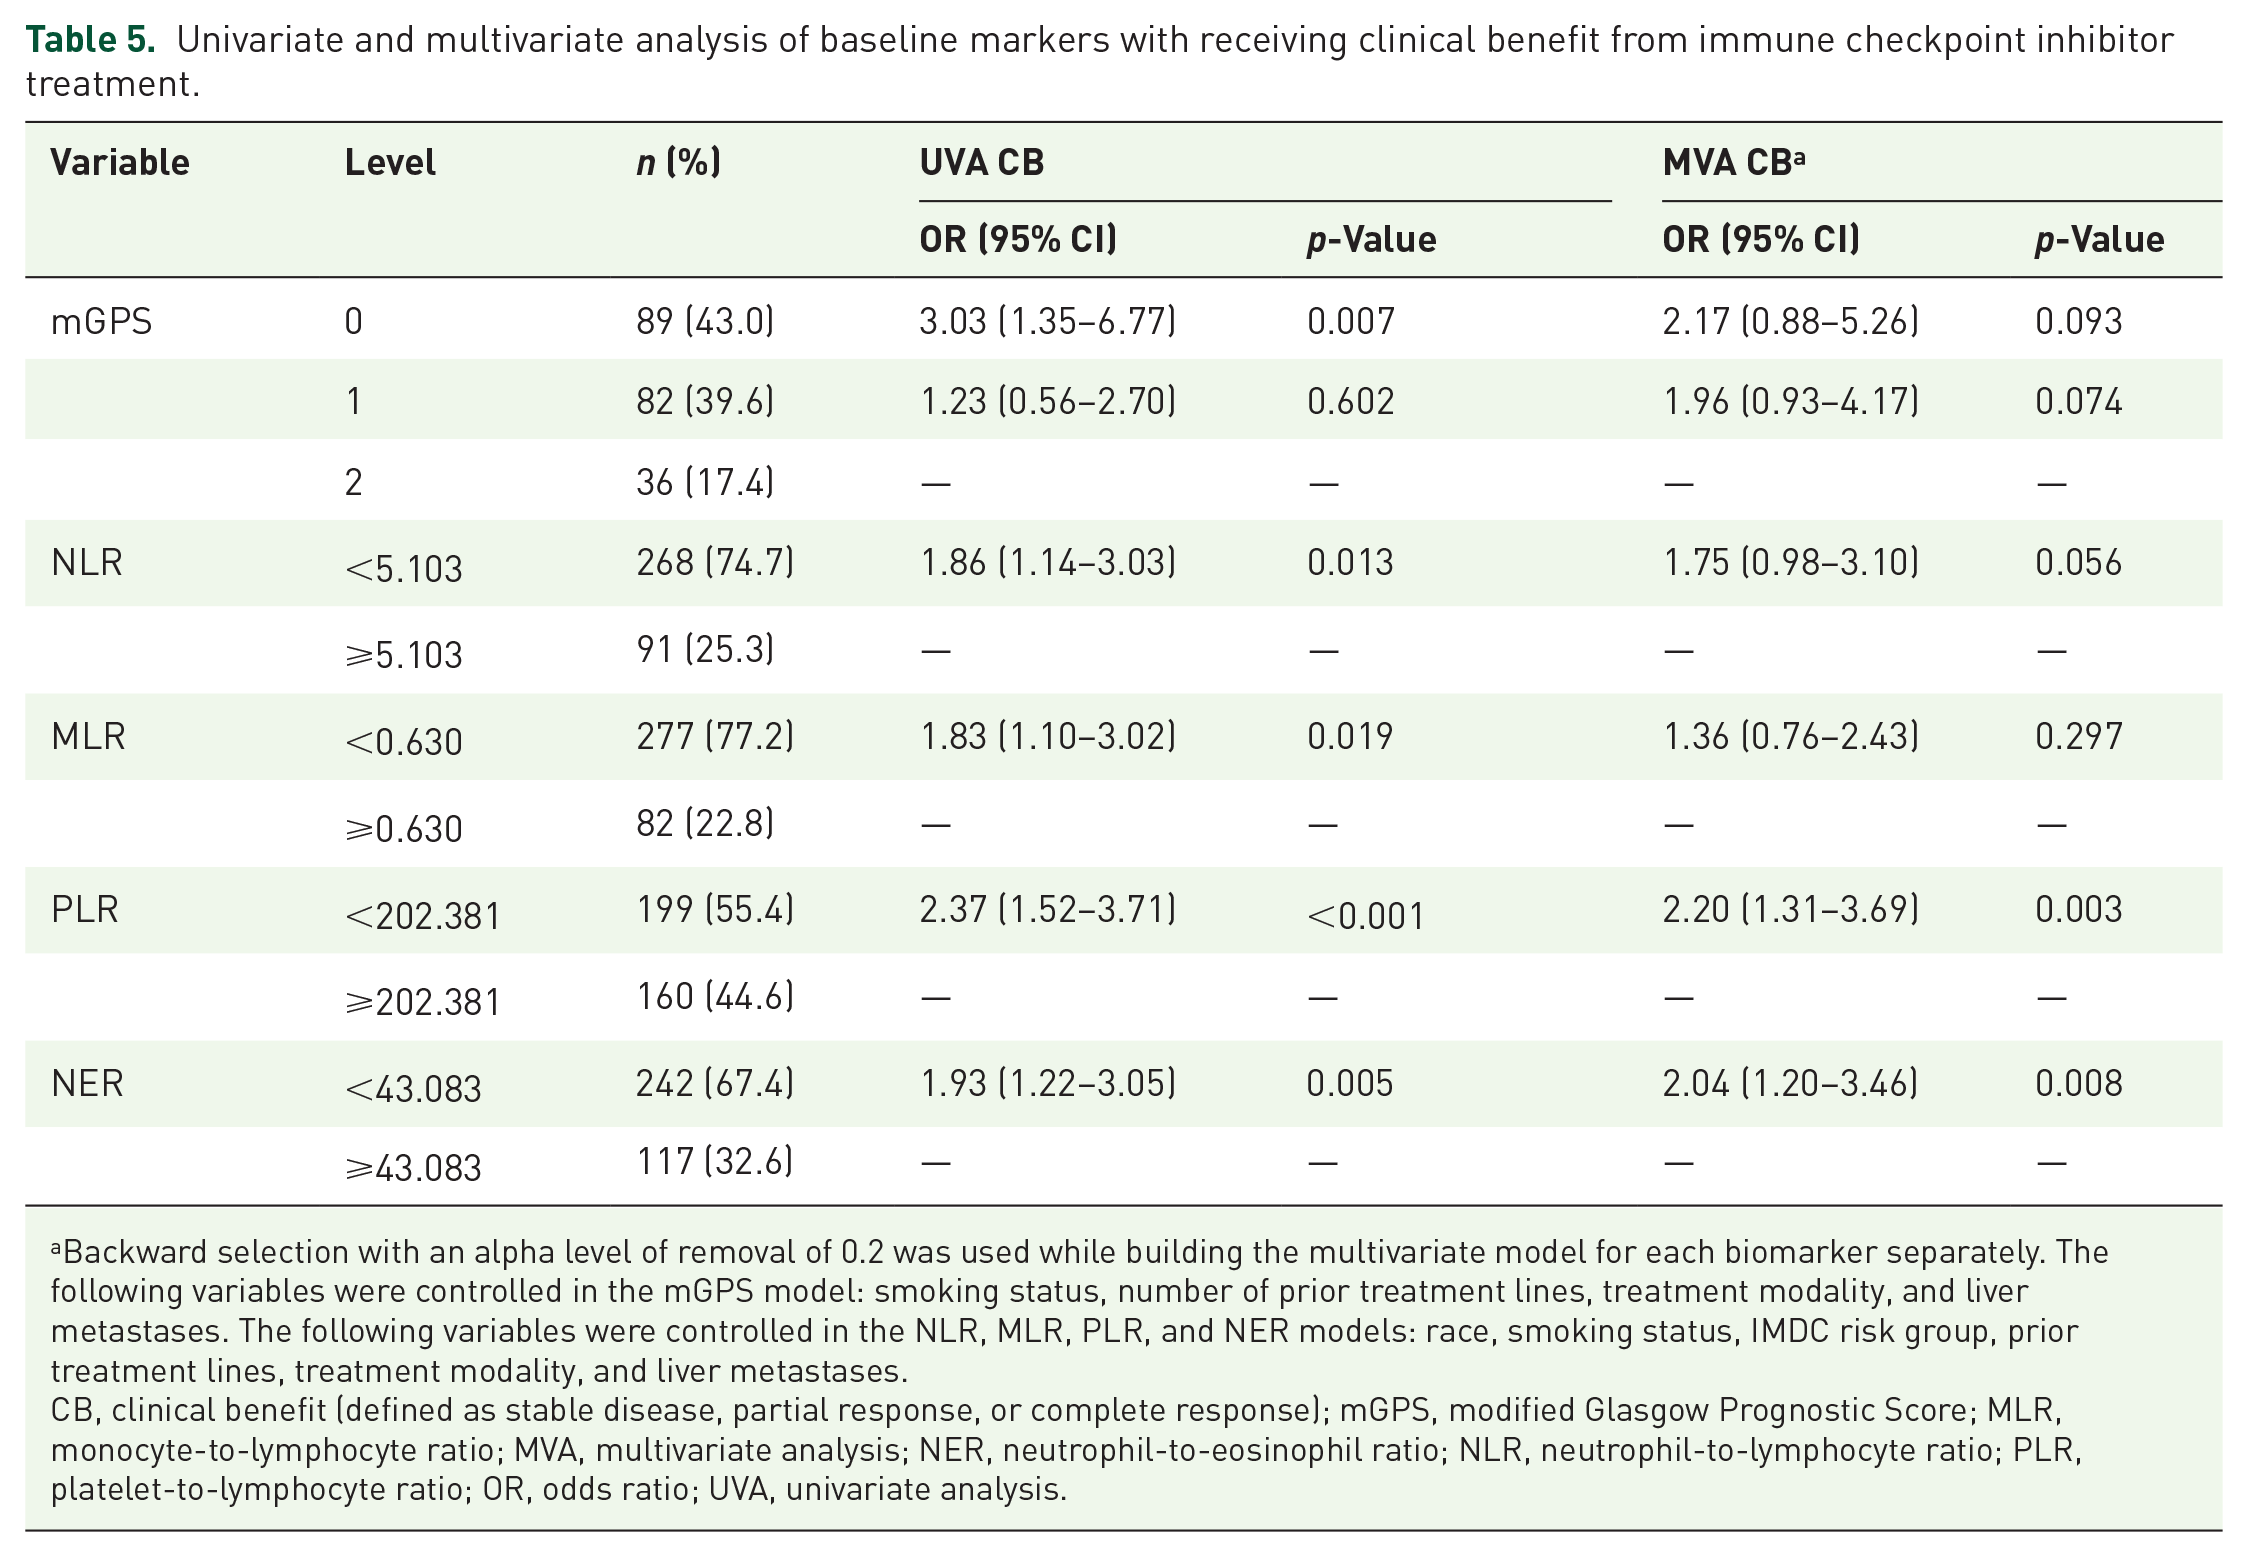
Backward selection with an alpha level of removal of 0.2 was used while building the multivariate model for each biomarker separately. The following variables were controlled in the mGPS model: smoking status, number of prior treatment lines, treatment modality, and liver metastases. The following variables were controlled in the NLR, MLR, PLR, and NER models: race, smoking status, IMDC risk group, prior treatment lines, treatment modality, and liver metastases.
CB, clinical benefit (defined as stable disease, partial response, or complete response); mGPS, modified Glasgow Prognostic Score; MLR, monocyte-to-lymphocyte ratio; MVA, multivariate analysis; NER, neutrophil-to-eosinophil ratio; NLR, neutrophil-to-lymphocyte ratio; PLR, platelet-to-lymphocyte ratio; OR, odds ratio; UVA, univariate analysis.
We conducted subgroup analyses to evaluate the consistency of associations between inflammatory biomarker levels and treatment outcomes across racial groups and treatment modalities. For OS, a lower baseline MLR was significantly associated with longer OS in African American patients (HR, 0.26; 95% CI, 0.15–0.46; p < 0.001), but not in White patients, with a significant difference between the groups (p = 0.007). No other biomarkers showed significant differences in OS between racial groups. For PFS, mGPS and MLR were significantly different. African American patients with an mGPS of 0 had longer PFS compared to those with scores of 1 (HR 0.40; 95% CI 0.17–0.91; p = 0.028) and 2 (HR 0.13; 95% CI 0.05–0.32; p < 0.001), a pattern not observed in White patients, showing a significant difference between groups (p = 0.023). In addition, African American patients with low MLR had longer PFS (HR 0.39; 95% CI 0.23–0.66; p < 0.001), which was not seen in White patients, with a significant difference (p = 0.042). The results are presented in Supplemental Tables 1 and 2.
Discussion
In this study, we found that low baseline levels of inflammatory markers were significant predictors of patient prognosis. Low baseline markers were strongly correlated with extended OS and PFS. Furthermore, patients with low baseline markers were more likely to receive CB from the treatment. Among the markers assessed, NLR and NER had notable predictive value in prognosis and treatment response. Similarly, mGPS and MLR were effective in predicting the patient’s prognosis. In addition, PLR was identified as a predictive utility for CB.
In the subgroup analyses, it was found that lower baseline MLR and mGPS were significantly associated with improved OS and PFS in African American patients, a pattern not observed in White patients. This suggests potential differences in the prognostic value of inflammatory markers across racial groups. When evaluating outcomes by treatment modality (PD-1 monotherapy, CTLA-4/PD-1 combination, and PD-1/TKI combination), the findings were consistent across subgroups, with no significant differences observed. However, the limited sample sizes within each treatment subgroup may have impacted our ability to detect subtle distinctions between treatment approaches.
These findings highlight inflammation’s complex role in cancer biology, particularly in immunotherapy settings. Inflammation, specifically tumor-associated inflammation, can be simultaneously beneficial and harmful. On the one hand, it is a necessary component of the appropriate immune response. On the other hand, it can also promote tumor growth, angiogenesis, and T-cell exhaustion. 14 T-cell exhaustion typically describes T-cells with increased inhibitory receptors and decreased capacity to secrete cytokines.36,37 T-cell exhaustion usually occurs in the presence of persistent antigens and inflammation. 38 Therefore, even with the administration of ICIs designed to block these inhibitory pathways, exhausted T-cells may remain functionally impaired, reducing overall therapeutic efficacy. 39 Inflammatory markers are widely available in clinical practice and can be particularly useful in this setting. They may help clinicians identify patients with compromised immune responses who might not receive the full benefits of ICI therapy.
Multiple studies investigating various solid tumors suggest a link between inflammatory markers and treatment outcomes.19,40–42 We previously reported an association between treatment outcomes and two markers, mGPS and NER, in metastatic RCC.43,44 In this report, we identified an extensive number of patients, with the majority of patients being treated with first-line ICIs and novel therapeutics. In addition, we evaluated the potential predictive value of these markers for the treatment response by including CB in our analysis.
Previous studies that evaluate mGPS and treatment outcomes in patients treated with targeted therapy for RCC also demonstrated similar prognostic results.16,17,45,46 This might suggest that mGPS is a prognostic marker independent of the treatment type. A multicenter retrospective study from Japan, which examined inflammatory markers in 84 aRCC patients treated with ipilimumab and nivolumab, found no significant correlation between baseline levels of NLR, PLR, MLR, and CRP. However, elevated biomarker levels at 3, 6, and 9 weeks after treatment initiation were associated with shorter OS. 47
Our study has a few limitations. While we increased the cohort size and evaluated multiple inflammatory markers, the retrospective study design should still be validated by prospective studies and a larger patient population. To minimize selection bias, we included every patient treated with ICIs at our institution from 2018 to 2023, reflecting real-world applications. To address possible confounding, we evaluated common concomitant medications such as aspirin, metformin, and statin. However, we did not evaluate other medications. In our study, we included all lines of patients; it is possible that previous therapies may affect the patient’s immune status. Moreover, we used optimal cutoffs for OS based on immune cell ratios without external validation. To address these limitations, future studies should focus on multi-institutional collaborations for external validation, prospective trials to confirm inflammatory markers as risk stratification tools, and correlative studies exploring checkpoint response biology.
Conclusion
Low baseline mGPS, NLR, MLR, PLR, and NER values are associated with more favorable clinical outcomes in patients with aRCC treated with ICIs. These inflammatory markers, which can be measured through routine, cost-effective blood workups, may help clinicians establish realistic expectations regarding treatment outcomes. Our findings should be validated prospectively in larger, and more diverse patient populations.
Supplemental Material
sj-docx-1-tam-10.1177_17588359251316243 – Supplemental material for Association of baseline inflammatory biomarkers and clinical outcomes in patients with advanced renal cell carcinoma treated with immune checkpoint inhibitors
Supplemental material, sj-docx-1-tam-10.1177_17588359251316243 for Association of baseline inflammatory biomarkers and clinical outcomes in patients with advanced renal cell carcinoma treated with immune checkpoint inhibitors by Ahmet Yildirim, Mengting Wei, Yuan Liu, Bassel Nazha, Jacqueline T. Brown, Bradley C. Carthon, Yujin Choi, Lauren Suh, Rohit V. Goswamy, Greta R. McClintock, Caitlin Hartman, Sarah Caulfield, Jordan Ciuro, Jamie M. Goldman, Wayne B. Harris, Omer Kucuk, Viraj A. Master and Mehmet A. Bilen in Therapeutic Advances in Medical Oncology
Supplemental Material
sj-docx-2-tam-10.1177_17588359251316243 – Supplemental material for Association of baseline inflammatory biomarkers and clinical outcomes in patients with advanced renal cell carcinoma treated with immune checkpoint inhibitors
Supplemental material, sj-docx-2-tam-10.1177_17588359251316243 for Association of baseline inflammatory biomarkers and clinical outcomes in patients with advanced renal cell carcinoma treated with immune checkpoint inhibitors by Ahmet Yildirim, Mengting Wei, Yuan Liu, Bassel Nazha, Jacqueline T. Brown, Bradley C. Carthon, Yujin Choi, Lauren Suh, Rohit V. Goswamy, Greta R. McClintock, Caitlin Hartman, Sarah Caulfield, Jordan Ciuro, Jamie M. Goldman, Wayne B. Harris, Omer Kucuk, Viraj A. Master and Mehmet A. Bilen in Therapeutic Advances in Medical Oncology
Supplemental Material
sj-docx-3-tam-10.1177_17588359251316243 – Supplemental material for Association of baseline inflammatory biomarkers and clinical outcomes in patients with advanced renal cell carcinoma treated with immune checkpoint inhibitors
Supplemental material, sj-docx-3-tam-10.1177_17588359251316243 for Association of baseline inflammatory biomarkers and clinical outcomes in patients with advanced renal cell carcinoma treated with immune checkpoint inhibitors by Ahmet Yildirim, Mengting Wei, Yuan Liu, Bassel Nazha, Jacqueline T. Brown, Bradley C. Carthon, Yujin Choi, Lauren Suh, Rohit V. Goswamy, Greta R. McClintock, Caitlin Hartman, Sarah Caulfield, Jordan Ciuro, Jamie M. Goldman, Wayne B. Harris, Omer Kucuk, Viraj A. Master and Mehmet A. Bilen in Therapeutic Advances in Medical Oncology
Footnotes
References
Supplementary Material
Please find the following supplemental material available below.
For Open Access articles published under a Creative Commons License, all supplemental material carries the same license as the article it is associated with.
For non-Open Access articles published, all supplemental material carries a non-exclusive license, and permission requests for re-use of supplemental material or any part of supplemental material shall be sent directly to the copyright owner as specified in the copyright notice associated with the article.