
Abstract
Background:
Parkinson’s disease mild cognitive impairment (PD-MCI) is frequent and heterogenous. There is no consensus about its influence on subthalamic deep brain stimulation (STN-DBS) outcomes.
Objective:
To determine the prevalence of PD-MCI and its subtypes in candidates to STN-DBS. Secondarily, we sought to identify MRI structural markers associated with cognitive impairment in these subgroups.
Methods:
Baseline data from the French multicentric PREDISTIM cohort were used. Candidates to STN-DBS were classified according to their cognitive performance in normal cognition (PD-NC) or PD-MCI. The latter included frontostriatal (PD-FS) and posterior cortical (PD-PC) subtypes. Between-group comparisons were performed on demographical and clinical variables as well as on T1-weighted MRI sequences at the cortical and subcortical levels.
Results:
320 patients were included: 167 (52%) PD-NC and 153 (48%) PD-MCI patients. The latter group included 123 (80%) PD-FS and 30 (20%) PD-PC patients. There was no between-group difference regarding demographic and clinical variables. PD-PC patients had significantly lower global efficiency than PD-FS patients and significantly worse performance on visuospatial functions, episodic memory, and language. Compared to PD-NC, PD-MCI patients had cortical thinning and radiomic-based changes in the left caudate nucleus and hippocampus. There were no significant differences between the PD-MCI subtypes.
Conclusion:
Among the candidates to STN-DBS, a significant proportion has PD-MCI which is associated with cortical and subcortical alterations. Some PD-MCI patients have posterior cortical deficits, a subtype known to be at higher risk of dementia.
INTRODUCTION
Subthalamic deep brain stimulation (STN-DBS) is a common therapeutic surgical procedure for patients with advanced Parkinson’s disease (PD) and with symptoms whose control by medical treatments fails. Even though various adverse effects have been reported, the efficacy of STN-DBS is established at short and longer term (for a review, see [1]). Improvement in motor symptoms is substantial and dopaminergic medication is significantly reduced, even several years after surgery [1]. Improvement in activities of daily living is observed up to five years and is more variable thereafter. Quality of life improves at short term, but improvement is lost quite rapidly (for a review, see [1]). The effects on non-motor symptoms are more variable. Regarding cognition, STN-DBS is generally considered as safe [2–4] even though a reduction in verbal fluency with an impact on communication satisfaction is systematically reported. The rate of dementia several years after STN-DBS seems similar as that observed in non-operated patients [4, 5]. Besides the accuracy of the active contacts localization, existing studies agree on the need to identify the preoperative factors associated with a better long-term outcome.
Currently, low L-dopa sensitivity of axial symptoms, age over 70 years, PD dementia and unstable neuropsychiatric disorders are considered as contraindications to STN-DBS [6]. Among the selected patients, some have mild cognitive impairment (PD-MCI). Only few studies have investigated the role of PD-MCI on the long-term outcome of DBS in general [7, 8] and of STN-DBS in particular [5, 10]. In these latest studies, the prevalence of PD-MCI at baseline ranged from 23 to 76%. At follow-up, conversion to dementia was more frequent or earlier in patients with PD-MCI at baseline compared to patients with normal cognition. However, the study populations and methods varied from one study to the other. PD-MCI subtypes were considered in only one study that distinguished amnestic vs. non-amnestic PD-MCI without finding differences at follow-up [5]. Cognitive decline can affect one single domain or be present across multiple domains [11]. Moreover, the affected domains vary and impairment in memory, visuospatial functions or language has been associated to a higher risk to develop dementia earlier [12, 13]. The “dual syndrome hypothesis” has been proposed to describe this heterogeneity by distinguishing, on the one hand, patients with a non-dopamine-mediated posterior cortical syndrome characterized by deficits in language, visuospatial functions and/or episodic memory and, on the other hand, patients with a dopamine-mediated frontostriatal syndrome characterized by deficits in executive functions, working memory and/or attention [14]. The follow-up of an incident PD cohort suggests that patients with a posterior cortical syndrome would have a faster progression to dementia than patients with a frontostriatal syndrome [15–17]. This heterogeneity has never been considered in the context of STN-DBS. Though, the issue is crucial. Indeed, even if having PD-MCI is not a contraindication to STN-DBS, certain subtypes seem to be more at risk of bad cognitive outcome in the short or medium term. Screening for them and determining whether they are associated with specific structural characteristics seem essential.
The main aim of the present study was to characterize the cognitive status of PD patients, candidates to STN-DBS, in order to determine the prevalence of PD-MCI and of its subtypes according to the dual syndrome hypothesis. The secondary objective was to identify MRI structural markers associated with the different cognitive subgroups.
Our hypothesis was that a certain proportion of PD patients, selected for STN-DBS, had PD-MCI, including posterior cortical deficits. We expected specific structural alterations associated with the PD-MCI subtypes.
MATERIALS AND METHODS
Patients
PD patients, candidates to STN-DBS, were included in Predictive Factors and Subthalamic Stimulation in Parkinson’s Disease (PREDISTIM), an ongoing prospective, multicentric cohort study sponsored by the University Hospital of Lille, conducted in 17 PD excellence centers from the clinical research network in France (NS-Park/F-Crin), approved by the CPP Nord Ouest-IV Ethical Committee (CPP 2013-A00193-42) and registered in the ClinicalTrials.gov website (NCT02360683). The objective of PREDISTIM is to identify risk factors of disease progression after STN-DBS in PD. Briefly, patients undergoing STN-DBS in one of the participating centers were consecutively included into the study between 11/2013 and 09/2019. Inclusion criteria were a diagnosis of PD according to the UK Brain Bank diagnostic criteria for PD [18], disease duration ≥5 years, age between 18 and 75 years and indication of STN-DBS. Exclusion criteria were atypical parkinsonism, severe cognitive impairment, severe psychiatric disorders, levodopa motor response lower than 30% and contra-indications to surgery. All participants gave informed written consent. Data collection was compliant with general data protection regulation rules.
In this ancillary study, we included only baseline data collected from participants in PREDISTIM who underwent a complete comprehensive neuropsychological assessment according to the consensus assessment procedure described below and 3T MRI scan.
Demographic and clinical variables
Sex, age, level of education, disease duration, and age at onset were recorded. The Movement Disorder Society-Unified Parkinson’s disease rating scale (MDS-UPDRS, section 1 to 4) was used to measure the severity of non-motor and motor symptoms [19]. MDS-UPDRS-3 scores were collected in the OFF-drug and best-ON conditions during a standardized acute levodopa challenge. Dopa-sensitivity was computed from these scores using the following formula: (OFF – best-ON)/OFF*100. The items of the MDS-UPDRS-3 scored at the left and the right side in the OFF condition were used to determine the dominant side of motor symptoms. Based on the sum for each side, a ratio (Left-Right)/(Left+Right) was calculated. A negative ratio indicated a right dominance of the motor symptoms, a positive one a left dominance and 0 no dominant side. Hoehn and Yahr staging was used to define disease severity [20]. Motor disability with/without treatment was assessed with the Schwab and England scale [21]. Quality of life was assessed by the Parkinson’s disease questionnaire-39 (PDQ39) [22]. Depression, anxiety, and apathy were assessed using the Hamilton depression rating scale [23], the Hamilton anxiety rating scale [24], and the Lille apathy rating scale [25], respectively. L-Dopa equivalent daily dosage was calculated using a modified version of the algorithm developed by Tomlinson et al. [26]. The frequency of patients taking antipsychotic, antidepressant, and anxiolytic medications was also recorded.
Cognitive assessment and subtyping
A consensus assessment procedure [27] meeting the MDS recommendations [28] for checking PD-MCI - level 2 criteria [11] was adopted for this ancillary study. Overall efficiency was assessed by the score at the Montreal Cognitive Assessment (MoCA) [29] and five cognitive domains (attention/working memory, executive functions, episodic memory, visuospatial functions, and language) were assessed with at least two tests by domain (details are shown in Table 2). A test was considered failed if the z-score on at least one test variable was ≤–1. Moreover, a cognitive domain was considered impaired when two tests in that domain were failed. Patients were classified as having normal cognition (PD-NC) or PD-MCI based on the clinical observation of the absence/presence of cognitive decline not sufficient to interfere significantly with functional independence and absence/presence of significant deficits on at least one cognitive domain. Within the PD-MCI group, we distinguished: (a) patients with frontostriatal subtype (PD-FS), i.e., deficits in attention/working memory and/or executive functions only, and (b) patients with at least posterior cortical subtype (PD-PC), i.e., deficits in visuospatial functions, memory and/or language isolated or in association with attention/working memory and/or executive deficits. To be able to distinguish subtypes according to the dual syndrome hypothesis, we were forced to slightly adapt the consensus MDS criteria for PD-MCI according to which deficits concern either two tests in one cognitive domain or one test in two different cognitive domains.
MRI acquisition
The imaging protocol included an anatomical three-dimensional T1-weighted sequence (3DT1) on 3T scanners using the similar parameters in all sites: voxel size:1×1×1 mm3; repetition time: 7.03 ms; echo time: 3.18 ms; matrix size: 256×256×176 voxels; FA: 9°.
The harmonization of inter-site imaging protocol along with the collection and quality control of acquired MRI data were performed by the center for imaging acquisition and treatment (CATI) [30], a platform dedicated to multicenter neuroimaging. All 3DT1 sequences were reviewed and scored from 0 (bad quality) to 4 (excellent quality). For the present study, imaging data with quality evaluation strictly lower than 2 were excluded.
MRI pre-processing
3DT1 images were processed using the Human Connectome Project pipeline in the software workbench 1.4.2 [31]. This optimized processing pipeline includes steps for non-uniform signal correction, signal and spatial normalizations, skull stripping based on the Freesurfer software (version 6.0, Massachusetts General Hospital, Boston, MA; https://surfer.nmr.mgh.harvard.edu/) and then provides parcellations and registrations using up-to-date libraries.
Subcortical MRI analyses
Segmentation of subcortical structures
Segmentation of bilateral caudate nuclei, thalami and hippocampi was performed online with volBrain, an automated MRI brain volumetry tool (https://volbrain.upv.es) [32]. Then, the masks were visually checked and manually corrected by a trained operator in their native space using Freeview 5.3 (http://surfer.nmr.mgh.harvard.edu). These masks were used as inputs for the volumetric, shape and radiomic analyzes. The same operation was applied to the Montreal Neurological Institute (MNI) 152 template to obtain an explicit mask with the 6 structures for voxel-based morphometry.
Volumetric analysis
Volume of each subcortical structure was computed with volBrain [32]. The total intracranial volume was also extracted.
Subcortical voxel-based morphometry
Preprocessed 3DT1 images were spatially normalized into the MNI152 space. Thereafter, the MNI152-based explicit mask was applied to extract the grey matter of our six subcortical structures from each 3DT1 image. The obtained volumes were finally smoothed with a 3-mm full width at half maximum Gaussian kernel prior to voxel-wise statistical analysis. Voxel-wise comparisons were performed within the MNI152-based explicit mask.
Shape analysis
Shape analysis of each subcortical structure was performed using the SPHARM-PDM method [33] in 3DSlicer (www.slicer.org) via the SlicerSALT project [34]. Manually corrected masks from volBrain [32] were used as inputs and converted to a spherical harmonic description (SPHARM), which was then sampled into a triangulated mesh (SPHARM-PDM). Fifteen harmonics were computed to obtain the best compromise between mesh smoothness and precision, thus generating 1,002 corresponding vertices on each surface. For each structure, meshes were aligned and spatially normalized with the mesh of the first patient using a rigid-body Procustes alignment. The quality of the meshes was visually assessed with the ShapePopulationViewer tool. For each patient and for each subcortical structure, a three-dimensional matrix containing spatial coordinates (x,y,z) was extracted from the mesh and used for statistical comparisons.
Analysis of radiomic features
After bias field correction, radiomic features were extracted from 3DT1 sequences with the open-source package Pyradiomics [35] using the manually corrected masks. First-order radiomic features were directly calculated from normalized grey levels for each subcortical structure, namely median, interquartile range, kurtosis (measures the ‘’peakedness” of the distribution of voxel values) and skewness (measures the asymmetry of the distribution of voxel values about the mean). Second-order radiomic features were also calculated from grey level co-occurrence matrices in 3DT1 MRI sequences [36]. These matrices are second-order histograms, which capture spatial relationships between voxels with predefined intensities in different directions (here, 26 connected directions) and with a predefined distance between voxels (here, the distance was set at 1 voxel). Thereafter, for each subcortical structure, seven second-order statistics were computed: inverse difference and normalized inverse difference moment (measure the local homogeneity of an image), contrast (measures the local intensity variation of voxel values), difference entropy (measures the randomness in neighborhood intensity value differences), correlation (measures the dependency of grey level values to their respective voxels in grey level co-occurrence matrices), difference variance (measures the heterogeneity of voxel intensity values and attributes higher weights to pairs, whose intensity level deviates more from the mean) and sum average (measures the relationship between occurrences of pairs with lower intensity values and occurrences of pairs with higher intensity values).
Cortical thickness analysis
For each vertex, cortical thickness was calculated in 3DT1 preprocessed images using a surface-based approach [37]. After automatic segmentation, cortical masks were systematically checked and manually corrected. Cortical thickness maps (32k vertices) were smoothed with a 15-mm full width at half maximum Gaussian kernel. The global average thickness for both hemispheres was also computed as a measure of global atrophy [38].
Statistical analyses
Demographic and clinical variables were reported as mean (standard deviation) for continuous variables and frequency (percentage) for categorical variables. They were compared between PD-NC and PD-MCI on the one hand and between PD-FS and PD-PC on the other hand using Mann-Whitney’s U test for numerical variables and Fisher’s exact test for categorical variables, with the R software version 4.0.4 [39]. Cognitive variables were compared using ANCOVA with permutation test (number of permutations = 10,000) controlling for age, sex, and level of education with the R package permuco version 1.1.0 [40]. The mean z-score of a cognitive domain was computed by averaging the z-scores from the test variables that assessed this domain.
Regarding MRI parameters, ANCOVA with permutation test (number of permutations = 10,000) was used to compare PD-NC and PD-MCI groups with age, sex, level of education and center of recruitment as covariates. In case of significant result, comparison between PD-FS and PD-PC was performed within the concerned subcortical structures or cortical clusters. For all analyses, correction for multiple comparisons was applied with a false discovery rate (FDR) [41] fixed at 0.05. Finally, Spearman’s partial correlation coefficients were computed between significant MRI measures and mean z-scores for each cognitive domain, controlling for age, sex, level of education and center, with the R package ppcor [42].
More precisely, volumes, radiomic features and mean cortical thickness with the R package permuco [40]. For voxel-based morphometry and vertex-wise cortical thickness, it was performed with the permutation analysis linear model (PALM) in the FMRIB software library (FSL 5.0.11) [43]. In addition, shape analysis was performed on the 3-dimensional matrices using MANCOVA with permutation test, with the R package geomorph version 3.3.2 [44]. Furthermore, it is noteworthy that subcortical volumes were normalized with the total intracranial volume computed with volBrain [32] to account for brain size differences between subjects. Likewise, voxel-based morphometry analyses were adjusted with the total intracranial volume using a proportional scaling approach with PALM [43]. For cortical thickness, information about significant clusters of cortical thinning were extracted using workbench 1.4.2 [31] with a minimum surface set at 20mm2. Finally, Spearman’s partial correlation coefficients were computed between significant MRI measures and mean z-scores for each cognitive domain, controlling for age, sex, level of education and center, with the R package ppcor [42].
RESULTS
The ancillary study flowchart is presented in Fig. 1. After exclusion of patients with missing or inconsistent data, 320 patients were included. Based on their performance at the neuropsychological test battery, 167 (52%) were classified as PD-NC patients and 153 (48%) as PD-MCI patients (Fig. 2A). Moreover, within the PD-MCI group, 123 (80%) had a PD-FS subtype and 30 (20%) a PD-PC subtype (Fig. 2A).
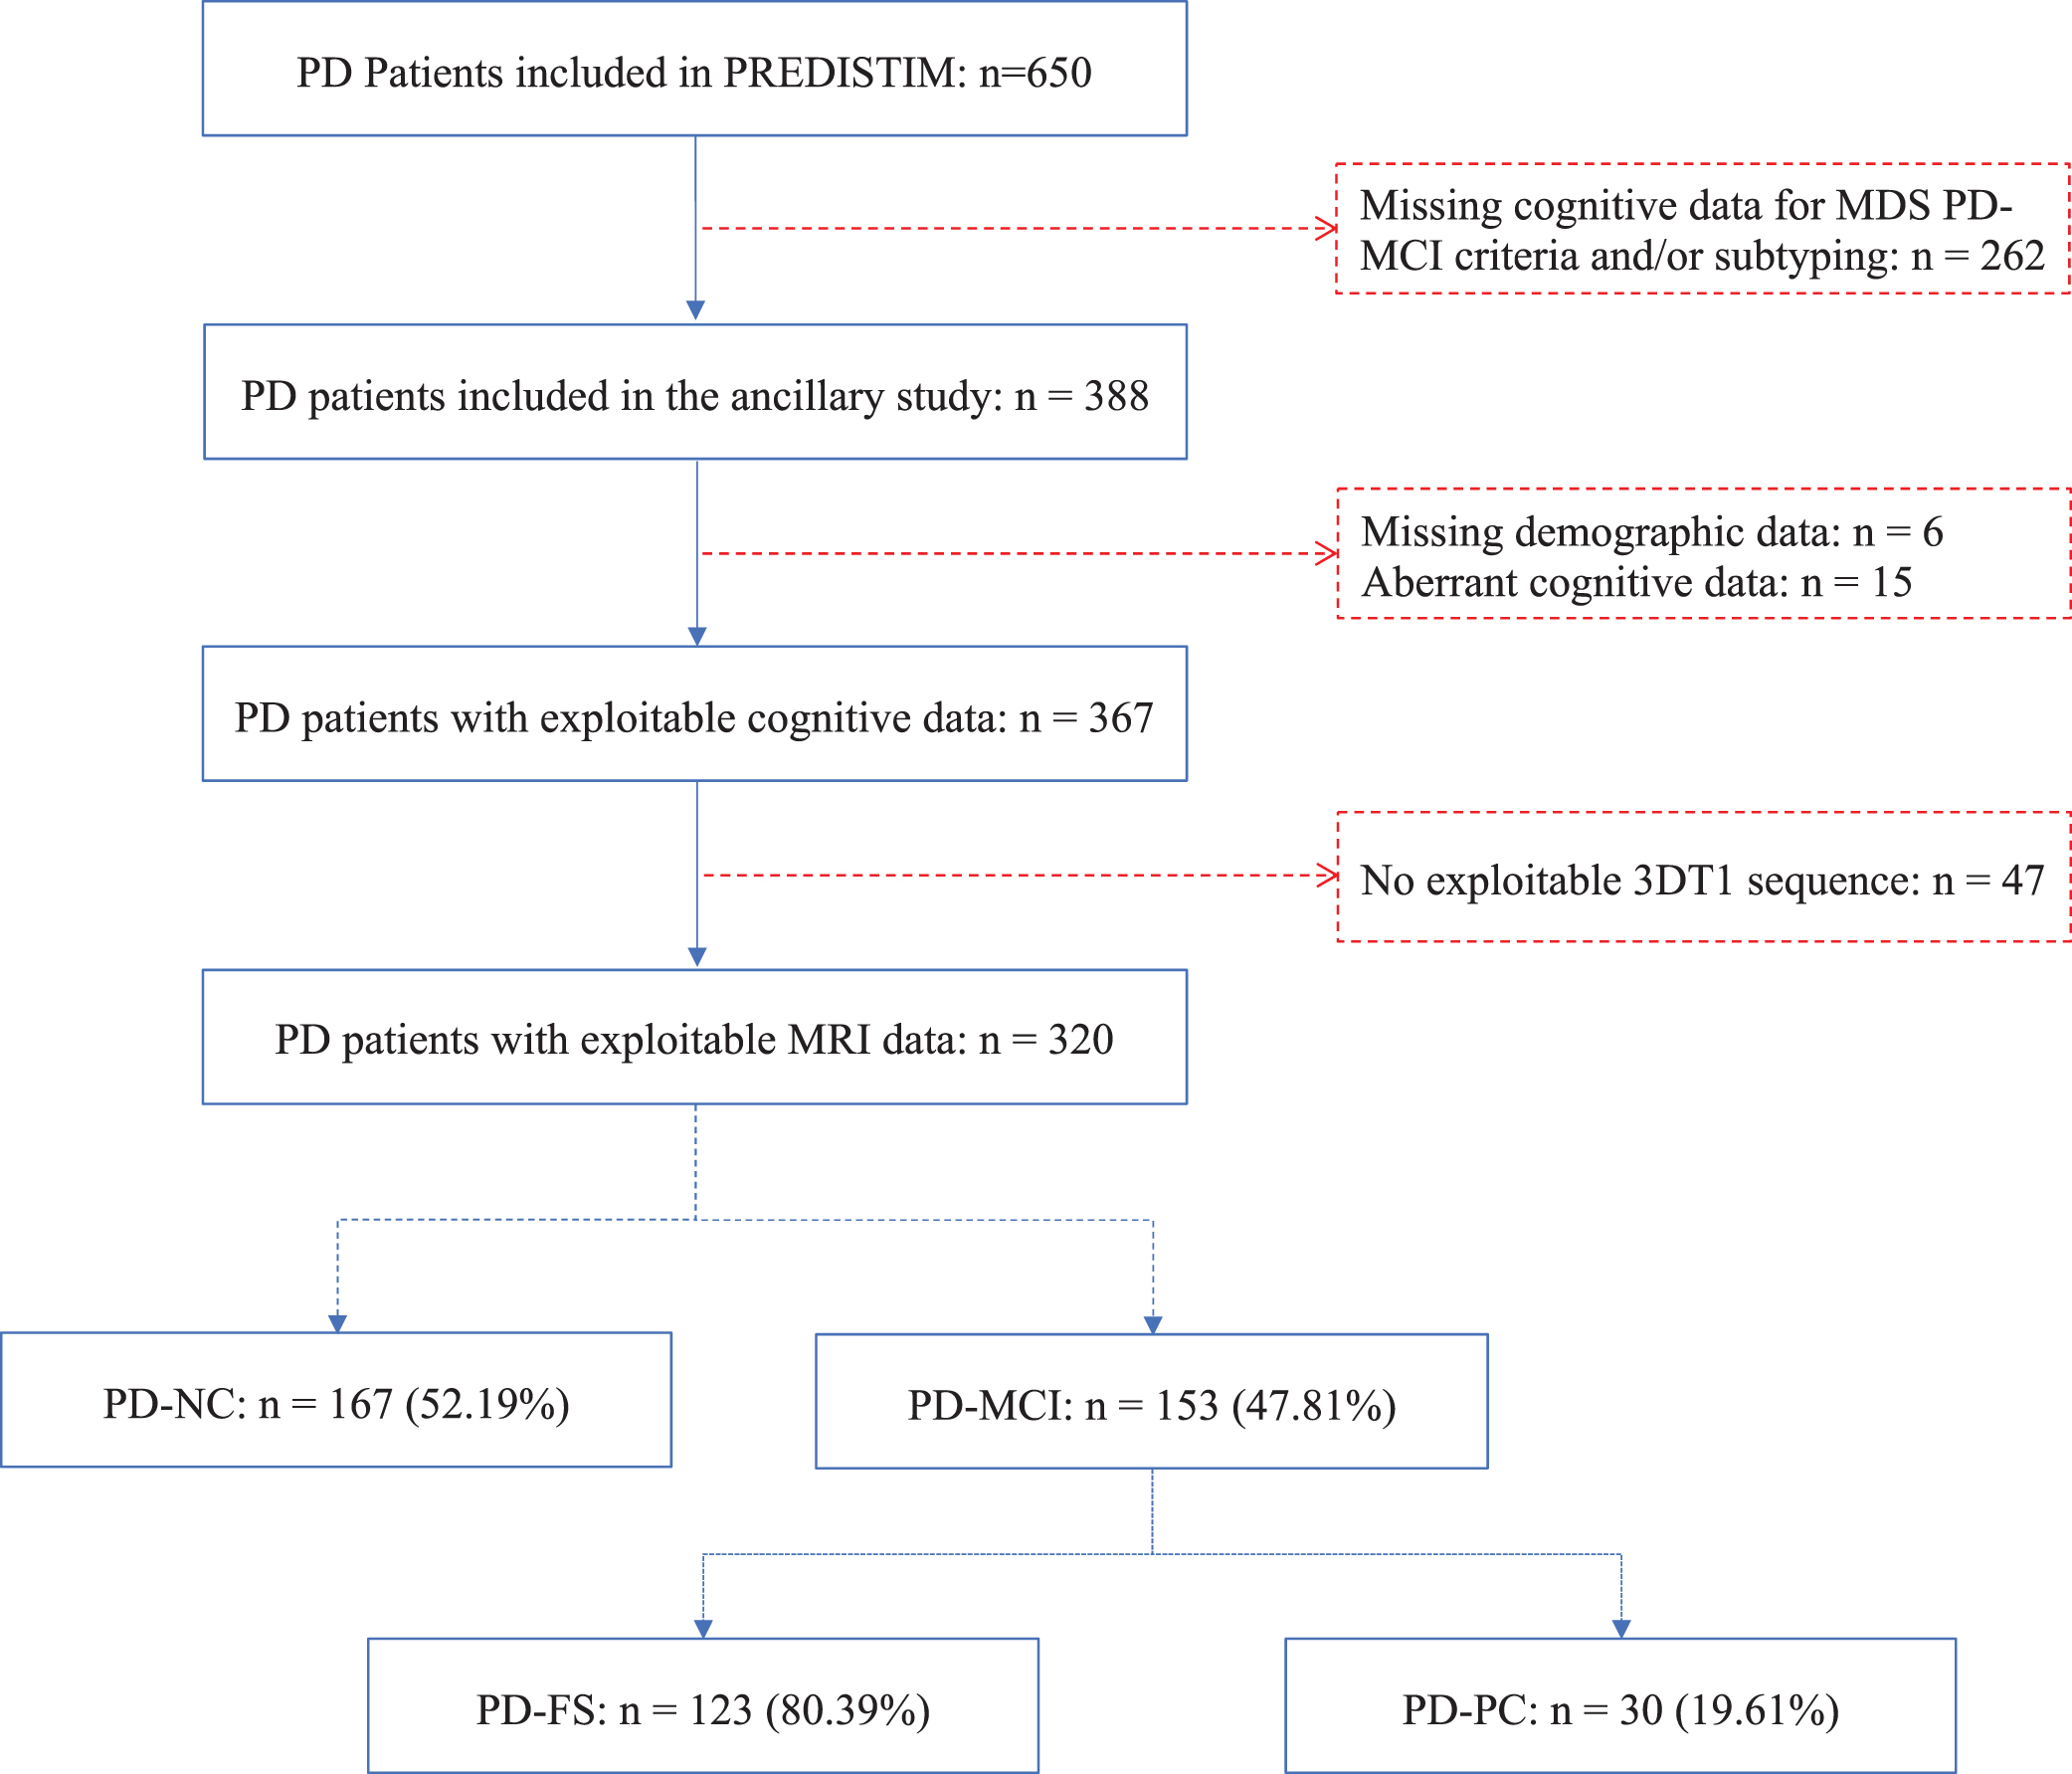
Study flowchart. PREDISTIM, Predictive Factors and Subthalamic Stimulation in Parkinson’s Disease; 3DT1, 3-dimensional T1-weighted; MRI, magnetic resonance imaging; PD, Parkinson’s disease; PD-FS, PD-frontostriatal subtype; PD-MCI, PD-mild cognitive impairment; PD-NC, PD-normal cognition; PD-PC, PD-posterior cortical subtype.
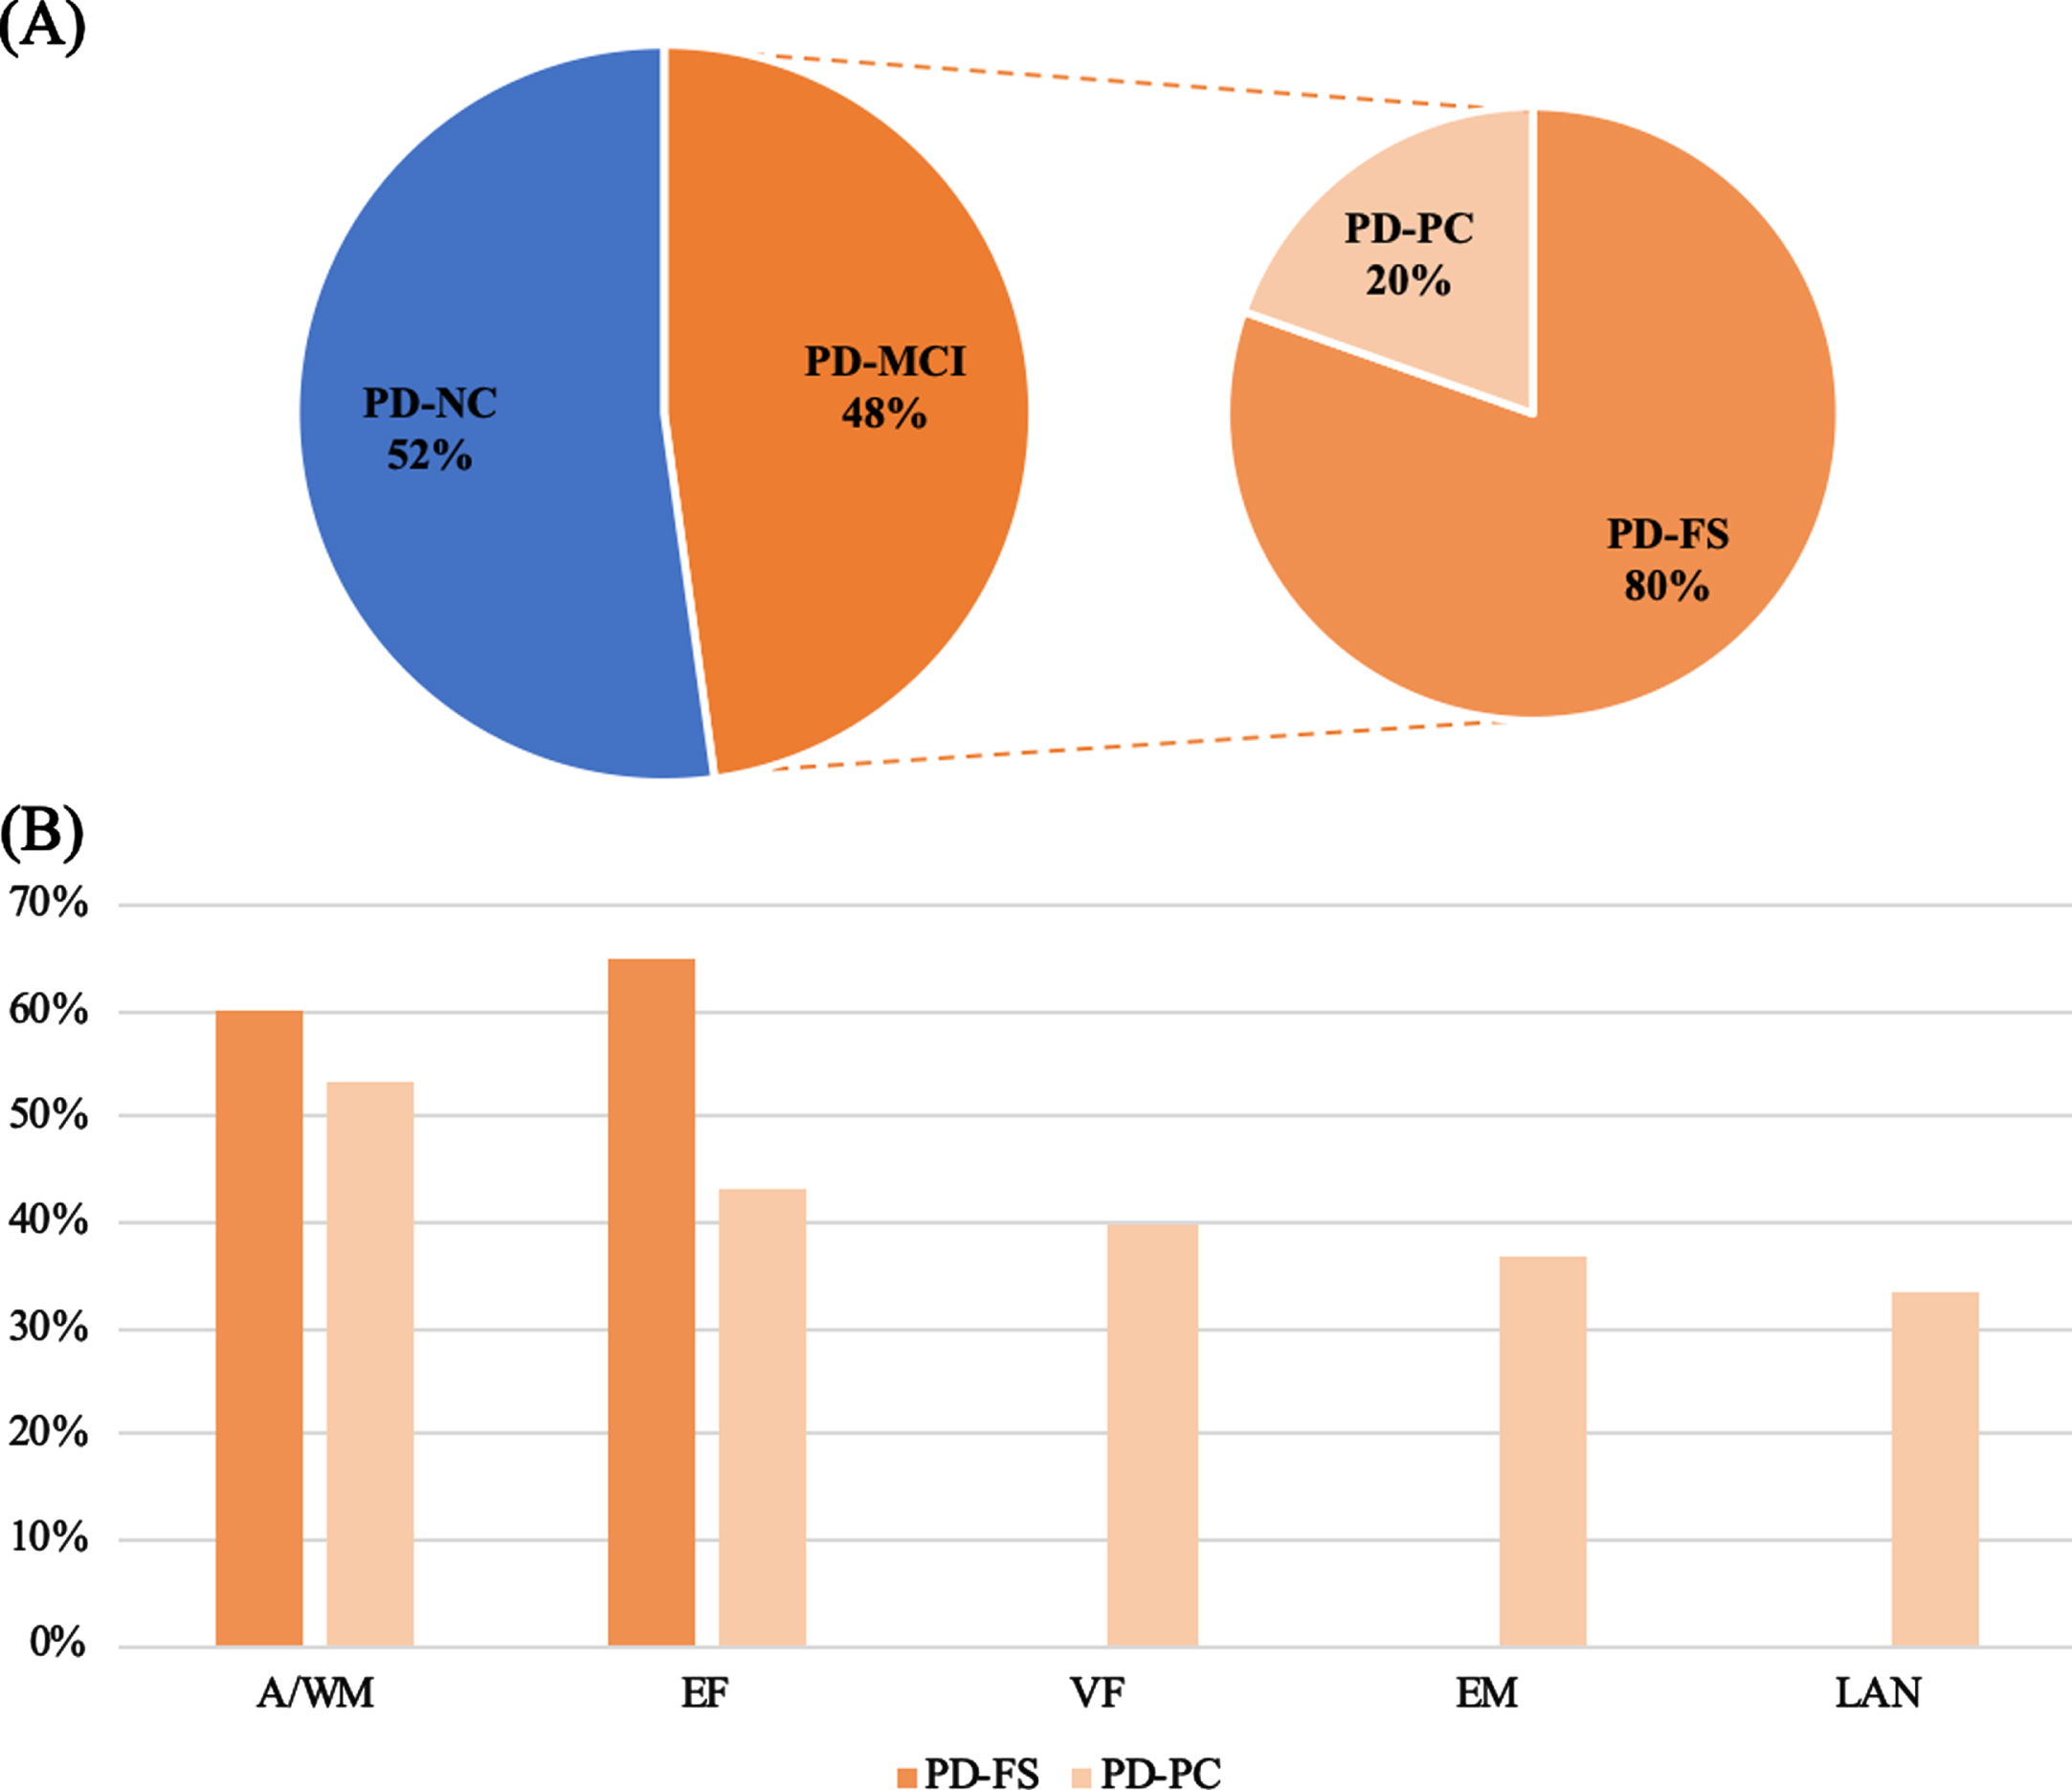
Proportion of each group (A) and frequencies of impaired cognitive function according to PD-MCI subtypes (B). A/WM, attention/working memory; EF, executive functions; EM, episodic memory; LAN, language; PD, Parkinson’s disease; PD-FS, PD-frontostriatal subtype; PD-PC, PD-posterior cortical subtype; VF, visuospatial functions.
Demographic and clinical variables
Demographic and clinical characteristics are shown in Table 1. No imputation for missing data was used since only 1.58% of data were missing. Population’s main characteristics were: mean age = 60.03 (±7.69) years; 203 (63%) men; mean disease duration = 9.72 (±3.85) years; mean MDS-UPDRS 3 total score = 9.67 (±7.51) in the Best-ON-medication state and 39.84 (±15.94) in the off-medication state; mean Hoehn and Yahr stage = 1.25 (±0.79) on-medication and 2.58 (±0.87) off-medication. Regarding subgroups, PD-MCI patients scored higher than PD-NC patients on the Lille Apathy Rating Scale [25]. There was no other significant between-group difference. Finally, demographic and clinical characteristics of PD-FS and PD-PC subtypes are presented in Table 2. No significant demographic or clinical difference was found between these subtypes.
Sociodemographic and clinical characteristics of the patient groups
Mean (standard deviation) is presented for continuous variables and frequency (percentage) for categorical variables. For the dominant side of motor symptoms, a positive score indicates a left dominance and a negative one a right dominance. Results are significant at *pFDR≤0.05. FDR, false discovery rate; LEDD, levodopa equivalent daily dose; MDS-UPDRS 1.2, Movement Disorder Society – Unified Parkinson’s disease Rating Scale, part I, item 2 (hallucination); MDS-UPDRS 3, Movement Disorder Society – Unified Parkinson’s disease Rating Scale, part 3 (severity of motor symptoms); PD, Parkinson’s disease; PD-MCI, PD-mild cognitive impairment; PD-NC, PD-normal cognition; PDQ39, Parkinson’s disease questionnaire –39.
Sociodemographic and clinical characteristics for the PD-MCI subtypes
Mean (standard deviation) is presented for continuous variables and frequency (percentage) for categorical variables. FDR, false discovery rate; LEDD, levodopa equivalent daily dose; MDS-UPDRS 1.2, Movement Disorder Society – Unified Parkinson’s disease Rating Scale, part 1, item 2 (hallucination); MDS-UPDRS 3, Movement Disorder Society – Unified Parkinson’s disease Rating Scale, part 3 (severity of motor symptoms); PD, Parkinson’s disease; PD-FS, PD-frontostriatal subtype; PD-PC, PD-posterior cortical subtype.
Cognitive variables
Detailed cognitive performance is provided in Table 3. There was no missing data since only complete cases were considered. PD-MCI patients had significantly lower global cognitive efficiency than PD-NC patients. In addition, PD-MCI patients had lower performance than PD-NC patients in all cognitive domains. Most PD-MCI patients had a PD-FS subtype (80%) with similar frequencies of attention/working memory (60%) and executive (65%) deficits (Fig. 2B). In the PD-PC subtype, 40% of patients had visuospatial deficits, 37% episodic memory deficits and 33% language deficits (Fig. 2B). PD-FS and PD-PC cognitive performance is presented in Table 4. PD-PC patients had significantly lower global efficiency than PD-FS patients. Finally, PD-PC patients had significantly poorer performance on visuospatial functions, episodic memory and language than PD-FS patients, while there was no significant between-group difference in attention/working memory and executive functions.
Cognitive performance of patient groups
Mean (standard deviation) raw score at each cognitive parameter according to PD-MCI subtype. Results are considered significant at *pFDR≤0.05. CLOX, clock-drawing test; CWIT, color-word interference test; FCRT, free and cued recall test –16 items; FDR, false discovery rate; SDMT, symbol digit modalities test; SRT, spatial recall test; WAIS-R, Wechsler’s adult intelligence scale – revised.
Cognitive performance of the PD-MCI subtypes
Mean (standard deviation) raw score at each cognitive parameter according to PD-MCI subtype. Results are considered significant at *pFDR <0.05. CLOX, clock-drawing test; CWIT, color-word interference test; FCRT, free and cued recall test –16 items; FDR, false discovery rate; PD, Parkinson’s disease; PD-FS, PD-frontostriatal subtype; PD-PC, PD-posterior cortical subtype; SDMT, symbol digit modalities test; SRT, spatial recall test; WAIS-R, Wechsler’s adult intelligence scale – revised.
Brain structural data
Significant differences between the PD-NC and PD-MCI patients were observed for vertex-wise cortical thickness, global average cortical thickness and first-order radiomic analyses. Other analyses did not reveal any significant difference. Furthermore, there was no significant difference between PD-FS and PD-PC subtypes.
Vertex-wise cortical thickness
Vertex-wise comparisons of cortical thickness revealed one significant cluster of cortical thinning in left hemisphere (Fig. 3A) and two significant clusters in right hemisphere (Fig. 3B) of PD-MCI patients compared with PD-NC. Details regarding these clusters, including the corresponding areas, are shown in Table 5. Besides, there were significant positive correlations between (a) the mean cortical thickness within the cluster #1 and the mean z-score for executive functions (rs = 0.21; pFDR = 0.002) (Fig. 4A), and (b) the mean cortical thickness within the cluster #2 and the mean z-score for attention/working memory (rs = 0.19; pFDR = 0.003) and for executive functions (rs = 0.21; pFDR = 0.001) (Fig. 4B, C).
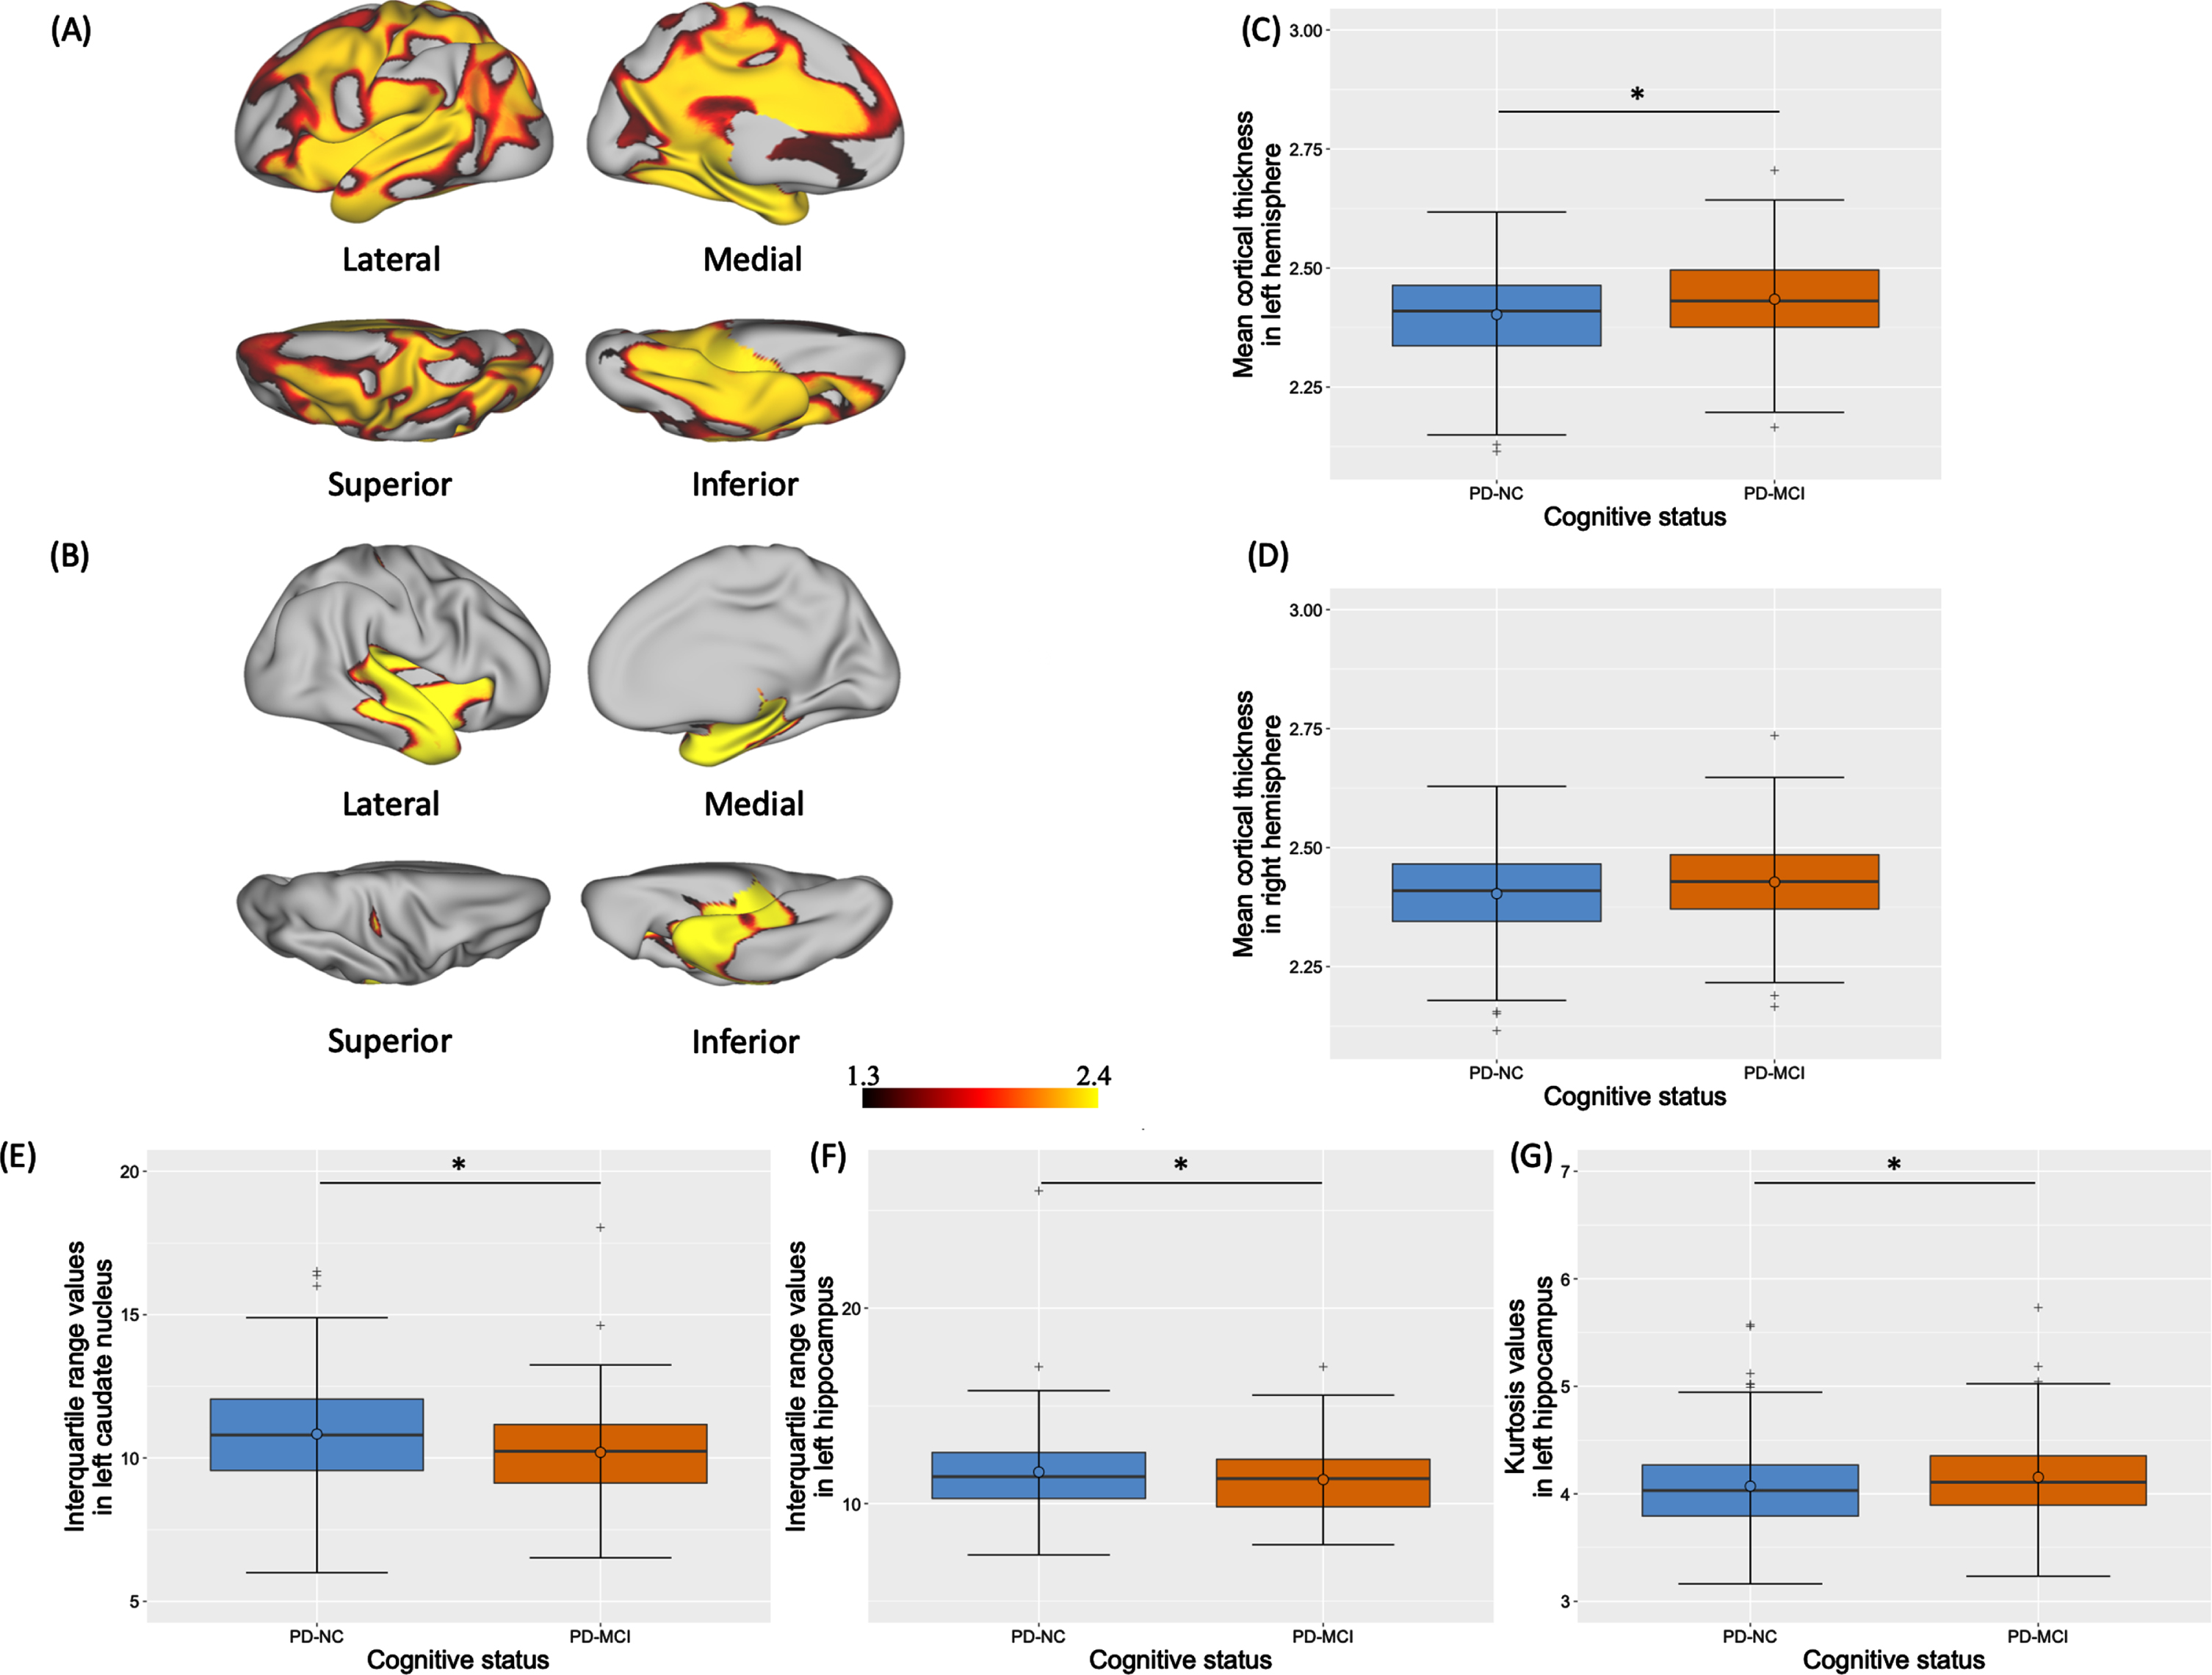
Significant MRI results for vertex-wise cortical thickness (A-B), global mean cortical thickness (C-D) and radiomic parameters (E-G) according to cognitive status. Significant clusters of cortical thinning in left (A) and right (B) hemispheres of PD-MCI patients compared to PD-NC are represented with – log(pFDR) values ≥1.3. Boxplots of mean cortical thickness (in mm) in left (C) and right (D) hemispheres and of significant radiomic-based parameters in left caudate nucleus (E) and in left hippocampus (F-G) are also represented. Results are significant at *pFDR≤0.05. FDR, false discovery rate; PD, Parkinson’s disease; PD-MCI, PD-mild cognitive impairment; PD-NC, PD-normal cognition.
Characteristics of the significant clusters of cortical thinning in PD-MCI compared to PD-NC
Data represent the label and surface (mm2) of each cluster, the corresponding cortical areas in the Freesurfer atlas as well as the coordinates in the MNI152 space, t- and p-value of the most significant vertex. Clusters were significant at *pFDR < 0.05. bankssts, banks of the superior temporal sulcus; FDR, false discovery rate; MNI, Montreal Neurological Institute space; PD, Parkinson’s disease; PD-MCI, PD-mild cognitive impairment; PD-NC, PD-normal cognition.
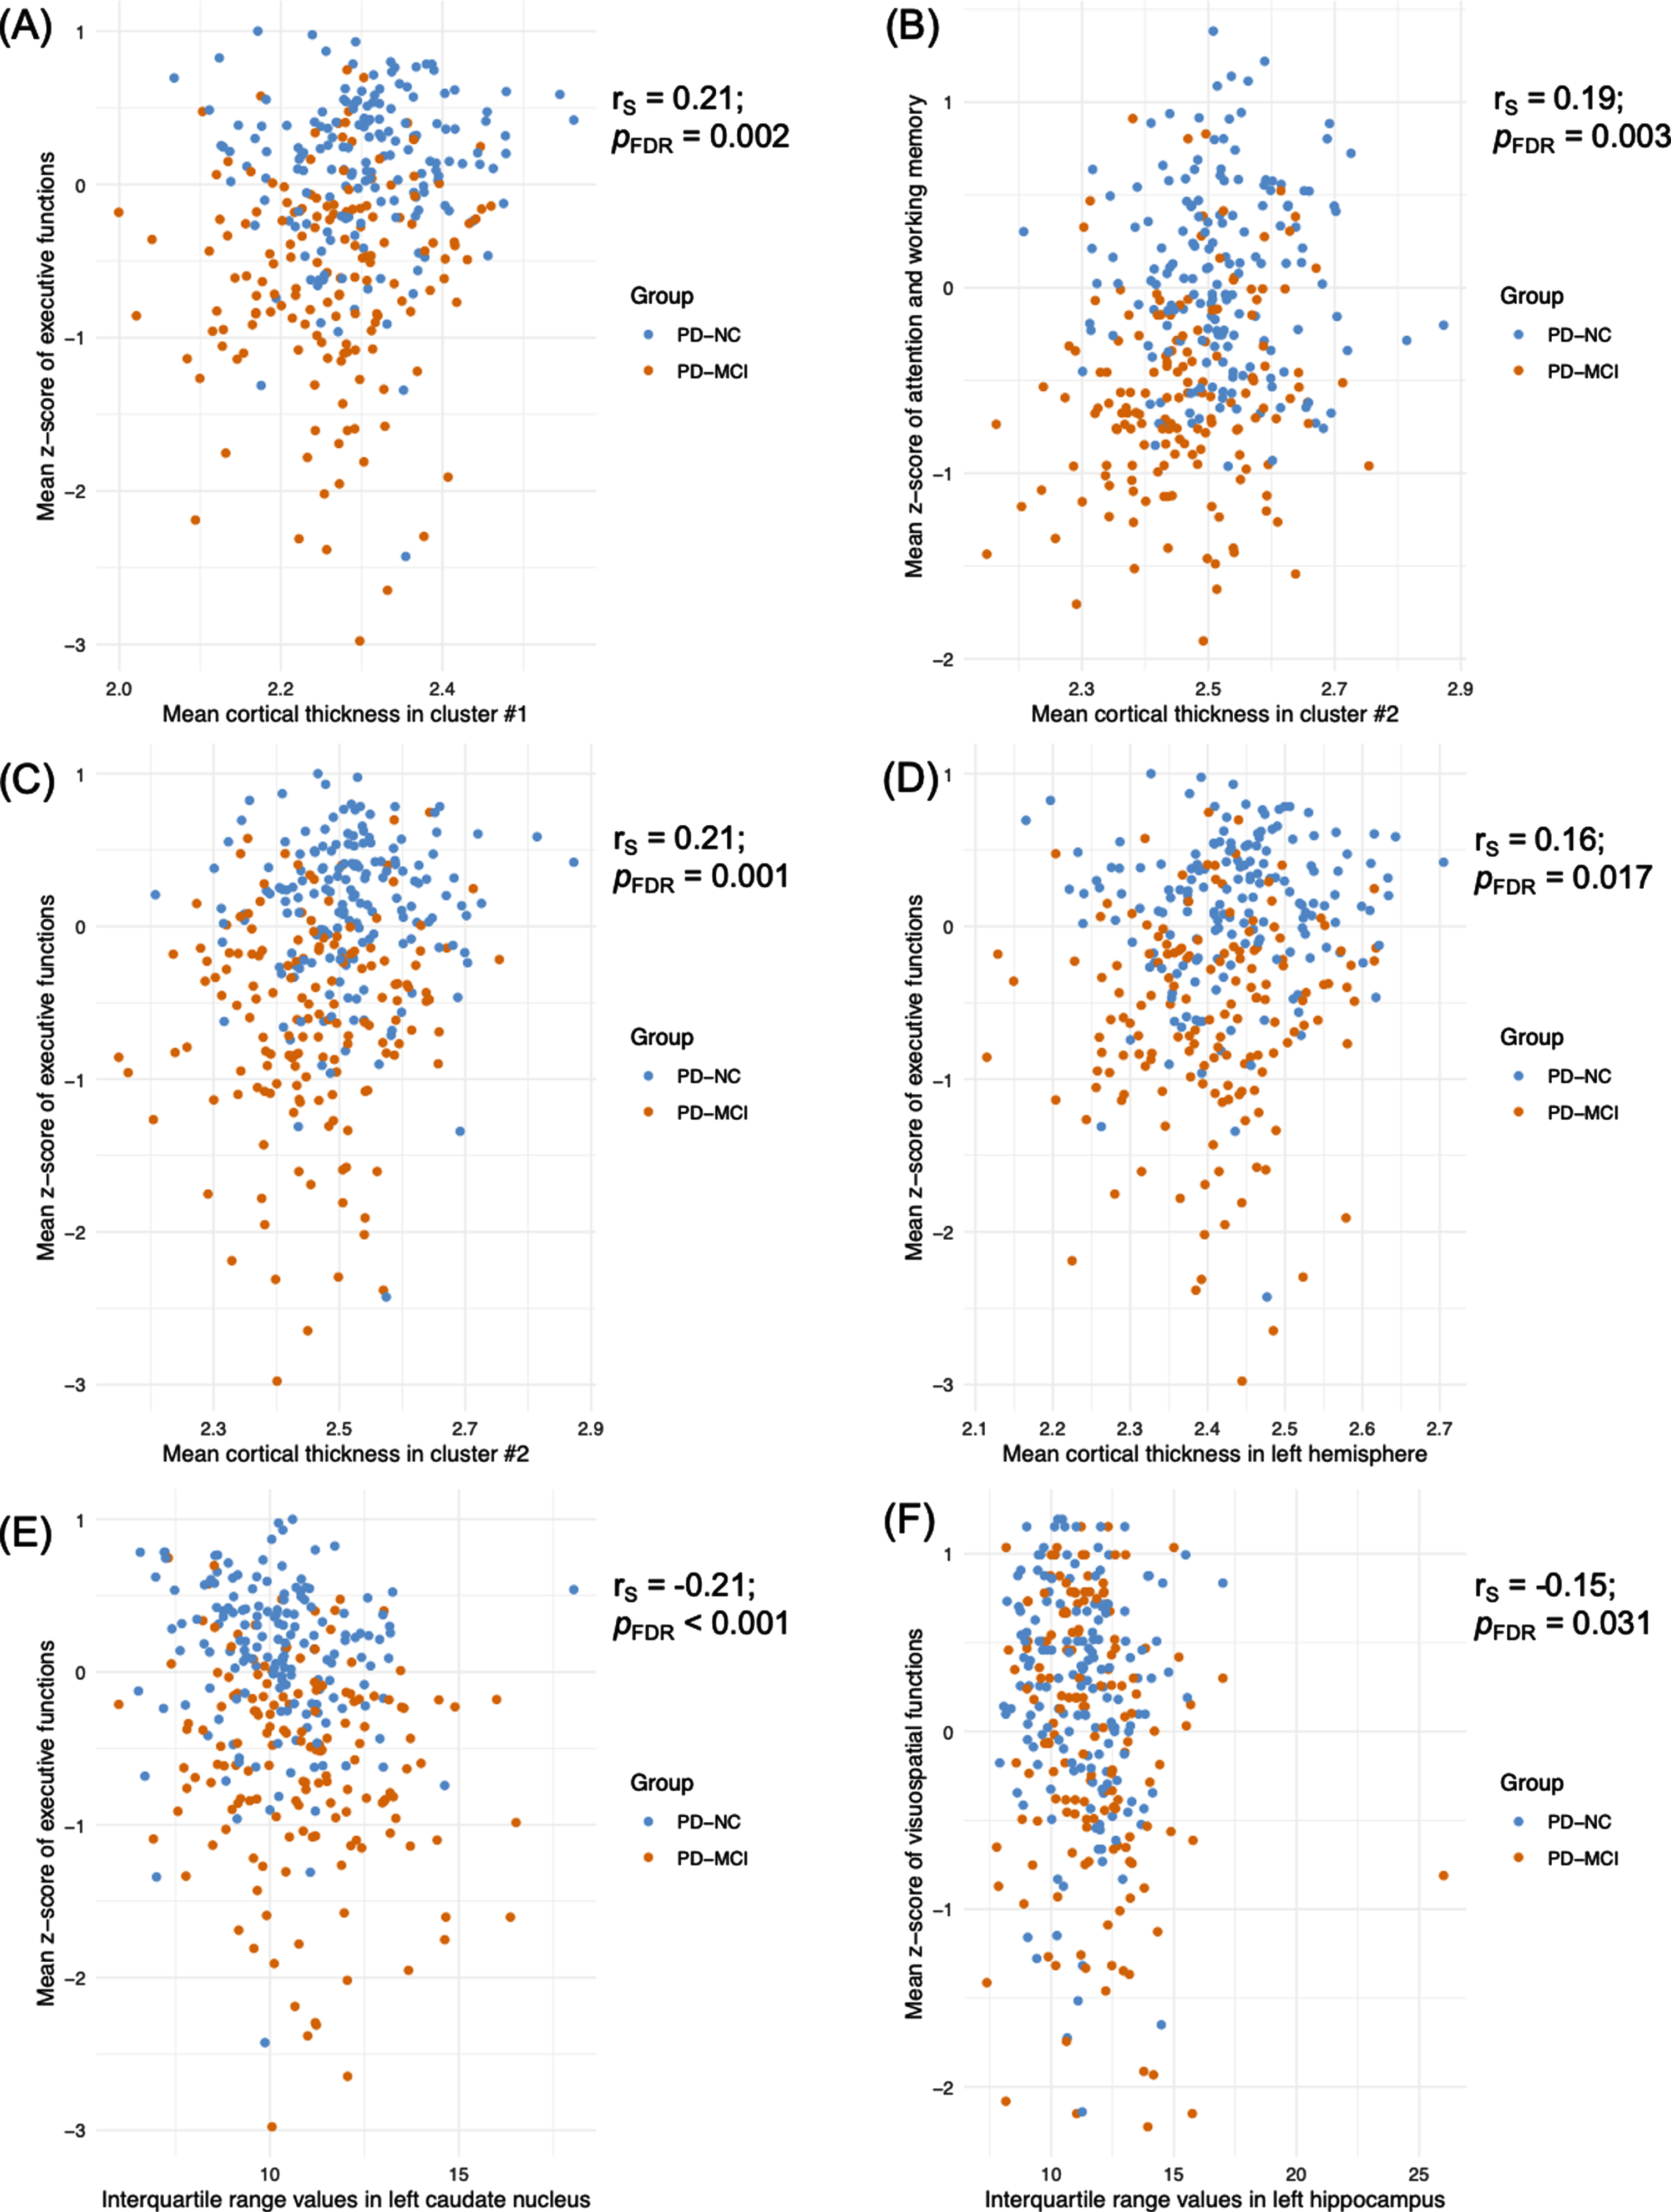
Significant correlations between cognitive z-scores and MRI parameters according to PD group. FDR, false discovery rate; PD, Parkinson’s disease; PD-MCI, PD-mild cognitive impairment; PD-NC, PD-normal cognition; rs, Spearman Rho.
Global average cortical thickness
PD-MCI patients had significantly lower average cortical thickness in the left hemisphere compared to PD-NC (pFDR = 0.012) (Fig. 3C). A tendency was also noticed in the right hemisphere (pFDR = 0.058) (Fig. 3D). A significant positive correlation was found between the mean z-score for executive functions and the average cortical thickness in the left hemisphere (rs = 0.16; pFDR = 0.017) (Fig. 4D).
First-order radiomic features
Between-group comparisons of first-order radiomic features revealed significantly higher interquartile range values in the left caudate nucleus (pFDR = 0.006) (Fig. 3E) and hippocampus (pFDR = 0.009) (Fig. 3F) along with lower kurtosis values in the left hippocampus (pFDR = 0.009) (Fig. 3G) of PD-MCI patients compared to PD-NC patients. Finally, significant negative correlations were found between (a) the mean z-score for executive functions and the interquartile range values in the left caudate nucleus (rs = –0.21; pFDR < 0.001) (Fig. 4E) and (b) the mean z-score for visuospatial functions and the interquartile range values in the left hippocampus (rs = –0.15; pFDR = 0.031) (Fig. 4F).
DISCUSSION
In this large cohort of PD patients, candidates to STN-DBS, about half had PD-MCI at baseline. Among them, about 20% had posterior cortical deficits, a subtype considered to be at higher risk of developing earlier dementia [16]. Compared to PD-NC, PD-MCI patients had structural cortical and subcortical alterations, namely several clusters of cortical thinning and changes in grey levels distribution of the left caudate nucleus and hippocampus. All these modifications were independent of age, disease duration and severity. However, we found no brain alteration specifically associated with each PD-MCI subtype.
PD-MCI is frequent among candidates for STN-DBS
In the few previous studies, the rate of PD-MCI among candidates to STN-DBS ranged from 23 to 76% [5, 10]. Two were retrospective and used a neuropsychological test battery that does not comply with current guidelines [9, 10]. PD-MCI was defined according to the level I of the MDS criteria but only one study indicated the used cut-off [5]. Here, PD-MCI was diagnosed according to an adaptation of the MDS consensus criteria-level 2 allowing to define subtypes and with a z-score set at ≤–1. We adopted this cut-off because, in clinical practice, before being screened for STN-DBS, patients are already strongly selected. Namely, patients with severe cognitive impairment are discarded. This cut-off is thus adapted to this specific patient population. Moreover, we have considered heterogeneity of PD-MCI since patients were categorized into two subtypes according to the dual syndrome hypothesis [14]. The PD-FS subtype was the most frequent (80%). Overall cognitive efficiency was significantly lower in PD-PC compared to PD-FS, suggesting that this subtype may need specific attention. As expected, PD-PC performed significantly lower than PD-FS for visuospatial functions, episodic memory and language. However, there was no significant difference between the two PD-MCI subtypes regarding attention/working memory and executive functions. As previously shown, many PD-PC patients have concomitant frontostriatal deficits, i.e., a mixed syndrome [45]. We recently showed that PD patients with posterior cortical deficits, isolated or not, had more abundant and more extensive structural alterations than PD patients with isolated frontostriatal deficits, suggesting that posterior cortical deficits are associated with more advanced degenerative lesions [45].
PD-MCI is associated with structural changes among PD candidates to STN-DBS
Although it was a secondary objective, our study is the first to reveal structural cortical and subcortical alterations in candidates to STN-DBS with PD-MCI. Namely, we found significant cortical thinning in both hemispheres of PD-MCI compared to PD-NC patients. They also had significantly higher interquartile range values in the left caudate nucleus and hippocampus and lower kurtosis values in the left hippocampus. Outside the context of deep brain stimulation, regional brain atrophy has already been reported in PD-MCI compared to PD-NC [46] and healthy controls [47] but results were inconsistent. Few neuroimaging studies have considered cognitive heterogeneity in PD-MCI. Some reported changes in amnestic PD-MCI compared to healthy controls [48–50]. Again, results were inconsistent. To our knowledge, no previous study has identified grey matter alterations associated with cognitive impairment in candidates to STN-DBS, considering the PD-MCI subtypes. Our results suggest that, even in patients selected for STN-DBS, neurodegeneration is more advanced in PD-MCI than PD-NC.
Cortical thickness analysis revealed several clusters of significant cortical thinning in PD-MCI compared to PD-NC, predominant in the left hemisphere. Moreover, PD-MCI patients displayed lower global average cortical thickness in the left hemisphere compared to PD-NC, suggesting global atrophy. Cortical thinning concerned large associative cortical areas and was mainly associated with deficits in attention/working memory and executive functions whatever the cognitive subtype. These results are consistent with studies showing cortical thinning in temporal, parietal, frontal, and occipital areas in PD-MCI patients compared with PD-NC [38, 52]. Besides, cortical thinning in some of these regions has been suggested to be a marker of conversion from PD-MCI to PDD in longitudinal studies [53, 54]. The follow-up of our cohort is thus essential to provide the meaning of this marker of cortical atrophy in PD-MCI patients selected for STN-DBS, namely if it is a marker of bad cognitive outcome after surgery.
The significant increase in interquartile range values and decrease in kurtosis values of the left caudate nucleus and hippocampus in PD-MCI were the other structural markers revealed by our analyses of radiomic features. Betrouni et al. found significant associations between early cognitive impairment in PD and alteration of texture features in 3DT1 sequences, including the skewness of the left hippocampus [55]. Taken together, these results suggest that structural changes of the left caudate nucleus and hippocampus might play a role in the pathophysiology of PD-MCI in general, and that they might be interesting biomarkers for the cognitive outcome of STN-DBS. Radiomic features were reported as having a better sensitivity than volumes and shapes analysis methods to detect early morphological changes [55]. Interquartile range quantifies the variation of the grey-levels distribution, while kurtosis quantifies tailedness of the signal distribution. Higher interquartile range and lower kurtosis represent higher heterogeneity of the grey-levels distribution within the subcortical structures. Although they are both thought to reflect biological alterations, it remains difficult to give a pathophysiological interpretation to these features in the absence of a histological study associating biological lesions to radiomic features. To our knowledge, this issue was addressed in a mouse model of Alzheimer’s disease, in which the authors showed that the kurtosis of the hippocampus and thalamus was associated with the tau burden in these nuclei in T2 sequences [56]. In a preclinical model of middle cerebral artery transient occlusion, our group found that texture features were correlated with neural density in the hippocampus contralateral to the ischemic area [57].
The MRI analyses did not reveal any significant anatomical differences between the PD-MCI subtypes. This is inconsistent with our hypothesis that specific structural alterations would be associated with PD-MCI subtypes as defined by the dual syndrome hypothesis in PD patients, selected for STN-DBS. Recently, in a study aiming at identifying structural markers of PD-MCI subtypes, our team reported significant changes in radiomics features and more abundant deformation fields in PD-PC compared to PD-FS and PD-NC patients [45]. These discrepancies might be due to the differences in study population, in one hand PD patients selected for STN-DBS with a strong clinical pre-selection, on the other hand, PD patients without specific exclusion criteria, apart moderate to severe dementia. The study population in PREDISTIM was very homogeneous regarding demographic and clinical characteristics, contrary to other cohorts. Cognition was also less variable. This may explain the small rate of PD-PC patients, which might have limited the power of our statistical analyses.
Strengths and limitations of the study
This study was the first to investigate the neuroimaging markers associated with PD-MCI among PD patients, candidates to STN-DBS. A comprehensive cognitive assessment of PD patients that fulfilled MDS guidelines was performed, with at least two tests for each of the five assessed cognitive domains. Furthermore, we used innovative and sensitive imaging methods such as analyses of shape and radiomic features to explore the structural brain markers. Finally, the effect of potential nuisance variables was highly controlled in our MRI analyses.
Our study also has some limitations. Firstly, only baseline data are reported here and, of course, it will be essential to determine whether PD-MCI influence the long-term outcome of STN-DBS and if the identified MRI alterations are markers of this outcome. However, as it is the first study on such a large multicentric cohort associating cognitive and MRI data, it was worth to communicate these results. Secondly, to be able to distinguish PD-MCI subtypes, we had to adapt the consensus MDS criteria for PD-MCI [11]. Our adapted criteria were stricter since a cognitive domain was considered impaired and the patient as having PD-MCI when two tests in that domain were failed. This introduces a bias by reducing the frequency of PD-MCI compared to the criteria. Thirdly, the small number of subjects in our PD-PC group might have limited the power of our statistical analyses when comparing the PD-MCI subtypes. Fourthly, our data were acquired in multiple centers and were consequently subject to inter-operator variability. However, the center effect was controlled and this multicentric design provided a more representative sample of PD patients, candidates to STN-DBS. Finally, despite multicentric, our study was not international. Therefore, national habits may have influenced selection of patients and may have induced selection bias.
CONCLUSIONS AND PERSPECTIVES
Among PD patients, candidates to STN-DBS, a significant proportion has PD-MCI. Cognitive deficits in this subgroup of patients were associated to both cortical and subcortical structural alterations. Follow-up is necessary to determine whether this cognitive status and the associated MRI biomarkers influence STN-DBS outcomes.
Footnotes
ACKNOWLEDGMENTS
We thank all the participants and their families for their cooperation. The authors are grateful for financial support from the France Parkinson charity, French Ministry of Health (National PHRC 2012), support from the French clinical research network NS-Park/F-Crin and the Fédération de la Recherche Clinique du CHU de Lille (with Alain Duhamel, Maeva Kheng, Julien Labreuch, Dominique Deplanque, Edouard Millois, Nolwen Dautrevaux, Victor Laugeais, Maxime Caillier, Aymen Aouni, Pauline Guyon, Francine Niset, Valérie Santraine, Marie Pleuvret, Julie Moutarde and Laetitia Thibault)
The study was funded by the France Parkinson charity and French Ministry of Health (PHRC National 2012) and promoted by CHU of Lille (coordinated by Pr Devos and Pr Corvol) with the support of the French network NS-Park. This is an ancillary study to protocol 2013-A00193-42; ClinicalTrials.gov: NCT02360683. The research leading to these results has received funding from the program “Investissements d’Avenir” ANR-10-IAIHU-06.
CONFLICT OF INTEREST
None of the authors had a conflict of interest related to the present research.