
Abstract
Background:
Visual impairment is frequent and highly disabling in Parkinson’s disease (PD); however, few studies have comprehensively evaluated its impact on vision-related quality of life.
Objective:
To evaluate the relationship between visual function tests and the visual impairment perceived by PD patients in daily living activities.
Methods:
We cross-sectionally evaluated 62 PD patients and 33 healthy controls (HC). Visual disability was measured with a comprehensive battery of primary visual function and visual cognition tests (visual outcomes), and vision-related quality of life was evaluated with the National Eye Institute 25-Item Visual Function Questionnaire (NEI VFQ-25). The relationship between visual outcomes and NEI VFQ-25 sub-scores was analyzed with Pearson’s correlations and stepwise linear regression.
Results:
In PD patients, and not in HC, most NEI VFQ-25 sub-scores were significantly correlated with Cube Analysis and Dot Counting from Visual Object and Space Perception (VOSP) battery (visual perception), Clock Drawing Test (visuoconstructive capacity) and Trail Making Test part-A (visual attention and processing speed) and to a lesser extent with high- and low-contrast visual acuity. Dot Counting (VOSP) was the test primarily associated with most NEI VFQ-25 sub-scores (5 out of 12). Roth-28 color test was the one that best explained the variance of Peripheral Vision (R2: 0.21) and Role Difficulties (R2: 0.36) sub-scores of NEI VFQ-25, while photopic contrast sensitivity explained 41% of Driving sub-score variance.
Conclusion:
Vision-related quality of life in PD is mainly influenced by alterations in visual perception, visuoconstructive capacity and visual attention and processing speed. Future studies are warranted to confirm and further extend our findings.
Keywords
INTRODUCTION
Visual manifestations of Parkinson’s disease (PD) are gaining importance as key non-motor biomarkers of the disease, being now considered potential predictors of cognitive deterioration [1]. It is estimated that almost 80% of PD patients report some type of vision-related problems [2], including double vision, difficulty reading despite adequate refractive correction, freezing of gait in narrow spaces or abnormal judgment of objects when walking, and complex visual hallucinations, among others [3, 4]. Moreover, PD patients exhibit alterations in visual function, like reduced low-contrast visual acuity and contrast sensitivity, impaired perception of colors, patterns, depth and movement of stimuli, and altered high-order visual processing [5]. These visual abnormalities are allegedly caused by PD-related injury to the afferent visual pathway, from low-level neural processing structures like the retina [6] to high-level visual regions and networks of the brain [7–9]. Visual disability has a significant impact on the quality of life of PD patients, affecting activities of daily living (ADL) [10, 11] and specific tasks such as driving vehicles [12, 13], use of utensils [14], object identification and search [15, 16], facial expression recognition [17], and mobility in low light conditions [18]. Despite this evidence supporting alterations in visual function and reduced vision-related quality of life in PD patients, no prior studies have comprehensively evaluated the specific influence that each of the visual function abnormalities has on vision-related quality of life, ADL, emotional well-being, or social function in patients with PD. Therefore, in this work we aimed to evaluate the relationship between a wide set of primary and high-order visual function tests and the visual limitations reported by patients in PD.
MATERIAL AND METHODS
Study design and participants
We performed a cross-sectional study of 62 patients with PD and 33 controls. Study participants were recruited between 2015 and 2018 in the Department of Neurology at Cruces University Hospital and in the Biscay PD Association (ASPARBI). Patients with PD fulfilled Parkinson’s UK Brain Bank criteria for the diagnosis of PD [19], and they were studied in an on-medication condition. Among PD patients, n = 49 were idiopathic PD (no first-degree relatives with a family history of PD or other movement disorders) and n = 13 genetic PD. Of the genetic PD patients, n = 6 were carriers of the E46K mutation of the alpha-synuclein gene (PARK1), n = 4 Parkin gene mutation carriers (PARK2), and n = 3 carriers of the leucine-rich repeat kinase 2 gene mutation (PARK8) [20]. Control participants were the companions or spouses of the patients included in the study and were selected so that they maintained a mean age and gender distribution comparable to that of the patients. Before inclusion all participants underwent a screening process consisting in a comprehensive questionnaire on co-morbidities and an ophthalmological examination, as part of a strict protocol to rule out ophthalmological, neurological, or systemic pathologies other than PD that could influence visual function. Accordingly, we excluded any subject with history of severe smoking (> 20 cigarettes/day) or heavy alcohol use (> 4 drinks/day for men or > 3 drinks/day for women), diagnosis of any type or grade of diabetes, uncontrolled or resistant elevated blood pressure, obesity (body mass index > 30), chronic inflammatory systemic diseases (e.g., lupus erythematosus, sarcoid, Bechet disease), carotid or cerebral artery disease, history of brain trauma or other central nervous system diseases different from PD. Additionally, candidates with spherical equivalent refractive error above 4.00 diopters or more than 3.00 diopters of astigmatism or any other ocular condition potentially affecting proper image formation in the retina were discarded. Lastly, patients with severe cognitive deterioration meeting the clinical criteria for dementia associated with PD were also excluded [21]. The study protocol was approved by the regional Basque Clinical Research Ethics Committee. All participants gave written informed consent prior to their participation in the study, in accordance with the tenets of the Declaration of Helsinki.
Demographics and PD-related variables
Age and sex were recorded for all participants. Two neurologists experienced in the field of movement disorders recorded disease duration, Hoehn & Yahr (HY) scale score, Unified Parkinson Disease Rating Scale part I (Mentation, Behavior, and Mood), part II (Activities of Daily Living), part III (Motor Manifestations), and part IV (Complications of Therapy), and Levodopa Equivalent Daily Dose (LEDD).
Vision-related quality of life
All participants were evaluated with the National Eye Institute 25-Item Visual Function Questionnaire (NEI VFQ-25) [22] which has been validated for Spanish population [23]. The questionnaire was administered by a single examiner, expert in neuropsychology. The NEI VFQ-25 was initially aimed to measure self-perceived vision-targeted health status of patients suffering from chronic eyes diseases, and afterwards it has been used to evaluate visual quality of life in patients with neurological diseases, such as multiple sclerosis [24], neuromyelitis optica [25], or PD [26]. It consists of 25 vision-targeted questions representing 11 vision-related domains, each one quantified in 11 independent sub-scores, plus an additional 12th sub-score evaluating General Health. Among the 11 vision-related sub-scores of the NEI VFQ-25, six quantify the Quality of Vision (global vision rating or General Vision, Ocular Pain, difficulty with Near Activities, difficulty with Distance Activities, limitation with Peripheral Vision and with Color Vision) and five evaluate Vision-Related Quality of Life (limitations in Social Functioning due to vision, Role Difficulties due to vision, Dependency on others due to vision, Mental Health symptoms due to vision, Driving difficulties). Using the latter 12 NEI VFQ-25 sub-scores, a total Composite NEI VFQ-25 score is calculated ranging from 0 to 100, with 0 meaning complete loss of perceived visual function and 100 meaning full perceived visual function.
Primary visual function
Visual function was measured binocularly with best-corrected refraction. We registered high-contrast and low-contrast visual acuity (VA) as the total number of letters correctly identified in, respectively, standard Early Treatment Diabetic Retinopathy Study (ETDRS) charts and Sloan 2.5% charts (Precision Vision, La Salle, IL) mounted in a retro-illuminated cabinet at 4 meters. The ETDRS and Sloan charts have a total of 70 letters each, and the value of VA for each is computed as the total number of correctly identified letters out of a total of 70. Therefore, the fewer letters identified, the lower the VA. Contrast sensitivity (CS) was measured with a Pelli-Robson chart at 1 meter under photopic (280 lux) and mesopic (15 lux) conditions and the lowest contrast at which two letters in a triplet were correctly identified was recorded in standard logCS units. Color vision was evaluated with Roth-28 test, from which Total Error Score was calculated.
General cognition and high-order visual function (visual cognition)
General cognition was assessed with Montreal Cognitive Assessment (MoCA). Neuropsychological tests evaluating visual cognition included the number of correct answers in Salthouse Perceptual Comparison Test, Symbol Digit Modalities Test, Picture Completion subtest of the Wechsler Adult Intelligence Scale (WAIS) IV and the sum of forward and backward digit repetition of WAIS III, Benton Judgement of Line Orientation Test (H-form), Number Location, Cube Analysis, Dot Counting, Incomplete Letters, and Silhouettes tests of the Visual Object and Space Perception (VOSP) battery, time to complete Trail Making Test part-A and part-B, Brief Visuospatial Memory Test-Revised (total score + delayed recall), Wechsler Memory Scale (WMS) –III Faces test, and the score in Clock Drawing Test (Cacho scoring method). Finally, the presence or absence of visual hallucinations within the month prior to being included in the study was assessed in patients using the screening section of the North-East Visual Hallucinations Interview questionnaire [27].
Statistical analysis
Statistical analysis was performed in R (version 3.6.1) and RStudio (version 1.2.1335). Categorical variables were computed with pairwise Fisher’s exact tests. Continuous variables were assessed for normality with Shapiro–Wilks’s test. Normally distributed continuous variables were analyzed with T-test and continuous variables that violated this assumption were analyzed using Mann–Whitney U test for pairwise comparisons. We calculated Pearson correlation coefficients between NEI VFQ-25 subitems and visual outcomes. Correction for multiple comparisons was performed via False Discovery Rate (FDR). Then, significantly correlated variables were introduced in linear regression analysis with stepwise selection, setting visual outcomes as independent predictors and NEI VFQ-25 subitems as dependent variables, while controlling for the effect of age and LEDD. The effect size to reflect the standardized difference between group means was calculated with Cohen’s d.
RESULTS
Demographic and clinical characteristics of study participants are summarized in Table 1. PD patients and controls were comparable in terms of age and gender; however, patients had significantly fewer years of education and poorer general cognitive performance (MoCA). The mean disease duration of PD patients was 6.6±4.6 years, and they presented a mild to moderate motor disability, with a median HY score of 2 and mean UPDRS III score of 26.9±11.7. From the 62 PD patients, 12 (19%) had recently experienced visual hallucinations. PD patients with visual hallucinations had significantly longer disease duration and higher UPDRSIII score than the other patients (mean disease duration: 8.4 years versus 6.1 years; mean UPDRS III: 33 versus 25; both p < 0.05), but the latter groups did not have significant differences in MoCA, in the dosage of levodopa or in the percentage of patients in dopamine agonist therapy (data not shown).
Demographic and clinical features of participants
Sex is expressed as the proportion of females in each group, whereas quantitative data is expressed as mean (standard deviation). Ordinal data is expressed as median (interquartile range). PD, Parkinson’s disease; MoCA, Montreal Cognitive Assessment; UPDRS, Unified Parkinson’s Disease Rating Scale; HY, Hoehn and Yahr score; LEDD, Levodopa Equivalent Daily Dose.
Vision-related quality of life and PD-related variables
Table 2 shows the results of NEI VFQ-25 in PD patients and controls. The overall visual quality of life represented by the mean Composite NEI VFQ-25 score and the mean General Health sub-score were significantly lower in PD patients than in controls. Similarly, the mean sub-scores from “Quality of vision” section of NEI VFQ-25, including Near Activities and Distance Activities, Ocular Pain and Peripheral Vision, were significantly lower in patients. Contrarily, sub-scores from “Vision-Related Quality of Life” section were not statistically different between groups, except for Social Functioning and Dependency. Interestingly, patients with visual hallucinations had a significantly lower Composite NEI VFQ-25 score than patients without visual hallucinations, with respective values of 78 and 91.5 (p = 0.01). When we evaluated the relationship between NEI VFQ-25 sub-scores and PD-related variables (UPDRS and disease duration) we observed that mental status, behavior, and mood (UPDRS I) and activities of daily living (UPDRS II) were positively and significantly correlated with most NEI VFQ-25 sub-scores, except for the Driving item. Contrarily, FDR-corrected significant correlations between NEI VFQ-25 sub-items and PD motor manifestations (UPDRS III) or treatment complications (UPDRS IV) were much less frequent, and only 4 out of 12 subitems of NEI VFQ-25 significantly correlated with UPDRS IV (data not shown). Disease duration was only correlated with “General Health” subitem (r = –0.40, p = 0.001).
Results for National Eye Institute Visual 25-Item Visual Function Questionnaire (NEI VFQ-25)
Data is expressed as mean (standard deviation). Effect size was calculated with Cohen’s d. PD, Parkinson’s disease.
Visual function impairment
Compared to controls, PD patients showed significantly lower scores on high- and low-contrast VA (p = 0.031 and p < 0.001, respectively) and decreased CS both under photopic and mesopic conditions (p = 0.002 and p < 0,001, respectively), while color vision (Total Error Score from Roth-28 test) was not significantly different between groups (Table 3). We also found that PD patients performed significantly worse than controls in most tests measuring visual cognition. The differences between PD patients and controls were especially prominent for low-contrast VA (effect size 0.77), Symbol Digit Modality Test (processing speed, effect size 0.66) and Trail Making Test part- B (executive functions, effect size –1.83) (Table 3). In addition, relative to the other PD patients, PDs with visual hallucinations had no significant differences in most tests of visual function and visual cognition, except for having worse performance in mesopic contrast sensitivity (1.59 vs. 1.69 logCS, p < 0.05) and in Cube analysis test from VOSP (7 vs. 9, p < 0.05) and Clock Drawing Test (6.1 vs. 8.2, p < 0.05), which respectively assess visuospatial perception and visuoconstructive functions.
Results for visual function testing
Data is expressed as mean (standard deviation). Effect size was calculated with Cohen’s d. VA, visual acuity; CS: contrast sensitivity; VOSP, Visual Object and Space Perception battery; WAIS, Wechsler Adult Intelligence Scale; WMS, Wechsler Memory Scale.
Relationship between vision-related quality of life and visual function impairment
Within PD patients, the correlation analyses between NEI VFQ-25 sub-scores and visual function outcomes revealed several statistically significant relationships after correcting for multiple comparisons (FDR). However, in controls, only the correlation between few NEI VFQ-25 items (General Vision, Mental Health, Composite) and high- and / or low-contrast VA remained significant (Fig. 1). In PD patients, we noticed that Dot Counting and Cube Analysis subtests from VOSP and Clock Drawing Test were the visual cognition tests most frequently correlated with the NEI VFQ-25 sub-scores. In particular, Dot Counting showed the highest number of positive significant correlations, being correlated with all NEI VFQ-25 subitems, except for General Health, Role Difficulties and Driving sub-scores. Trail Making Test part-A and MoCA total score displayed a great number of significant correlations with NEI VFQ-25 sub-scores as well, namely with General Vision, Ocular Pain, Near Activities, Mental Health, Role Difficulties, Dependency and Peripheral Vision sub-scores and with NEI VFQ-25 Composite score. In controls, we only found significant correlations between long-term face recognition from WMS-III and General Health NEI VFQ-25 sub-score (r = 0.45, p = 0.047), between low-contrast VA and General Vision NEI VFQ-25 sub-score (r = 0.53, p = 0.010), and between high-contrast VA and Mental Health NEI VFQ-25 sub-score (r = 0.45, p = 0.044).
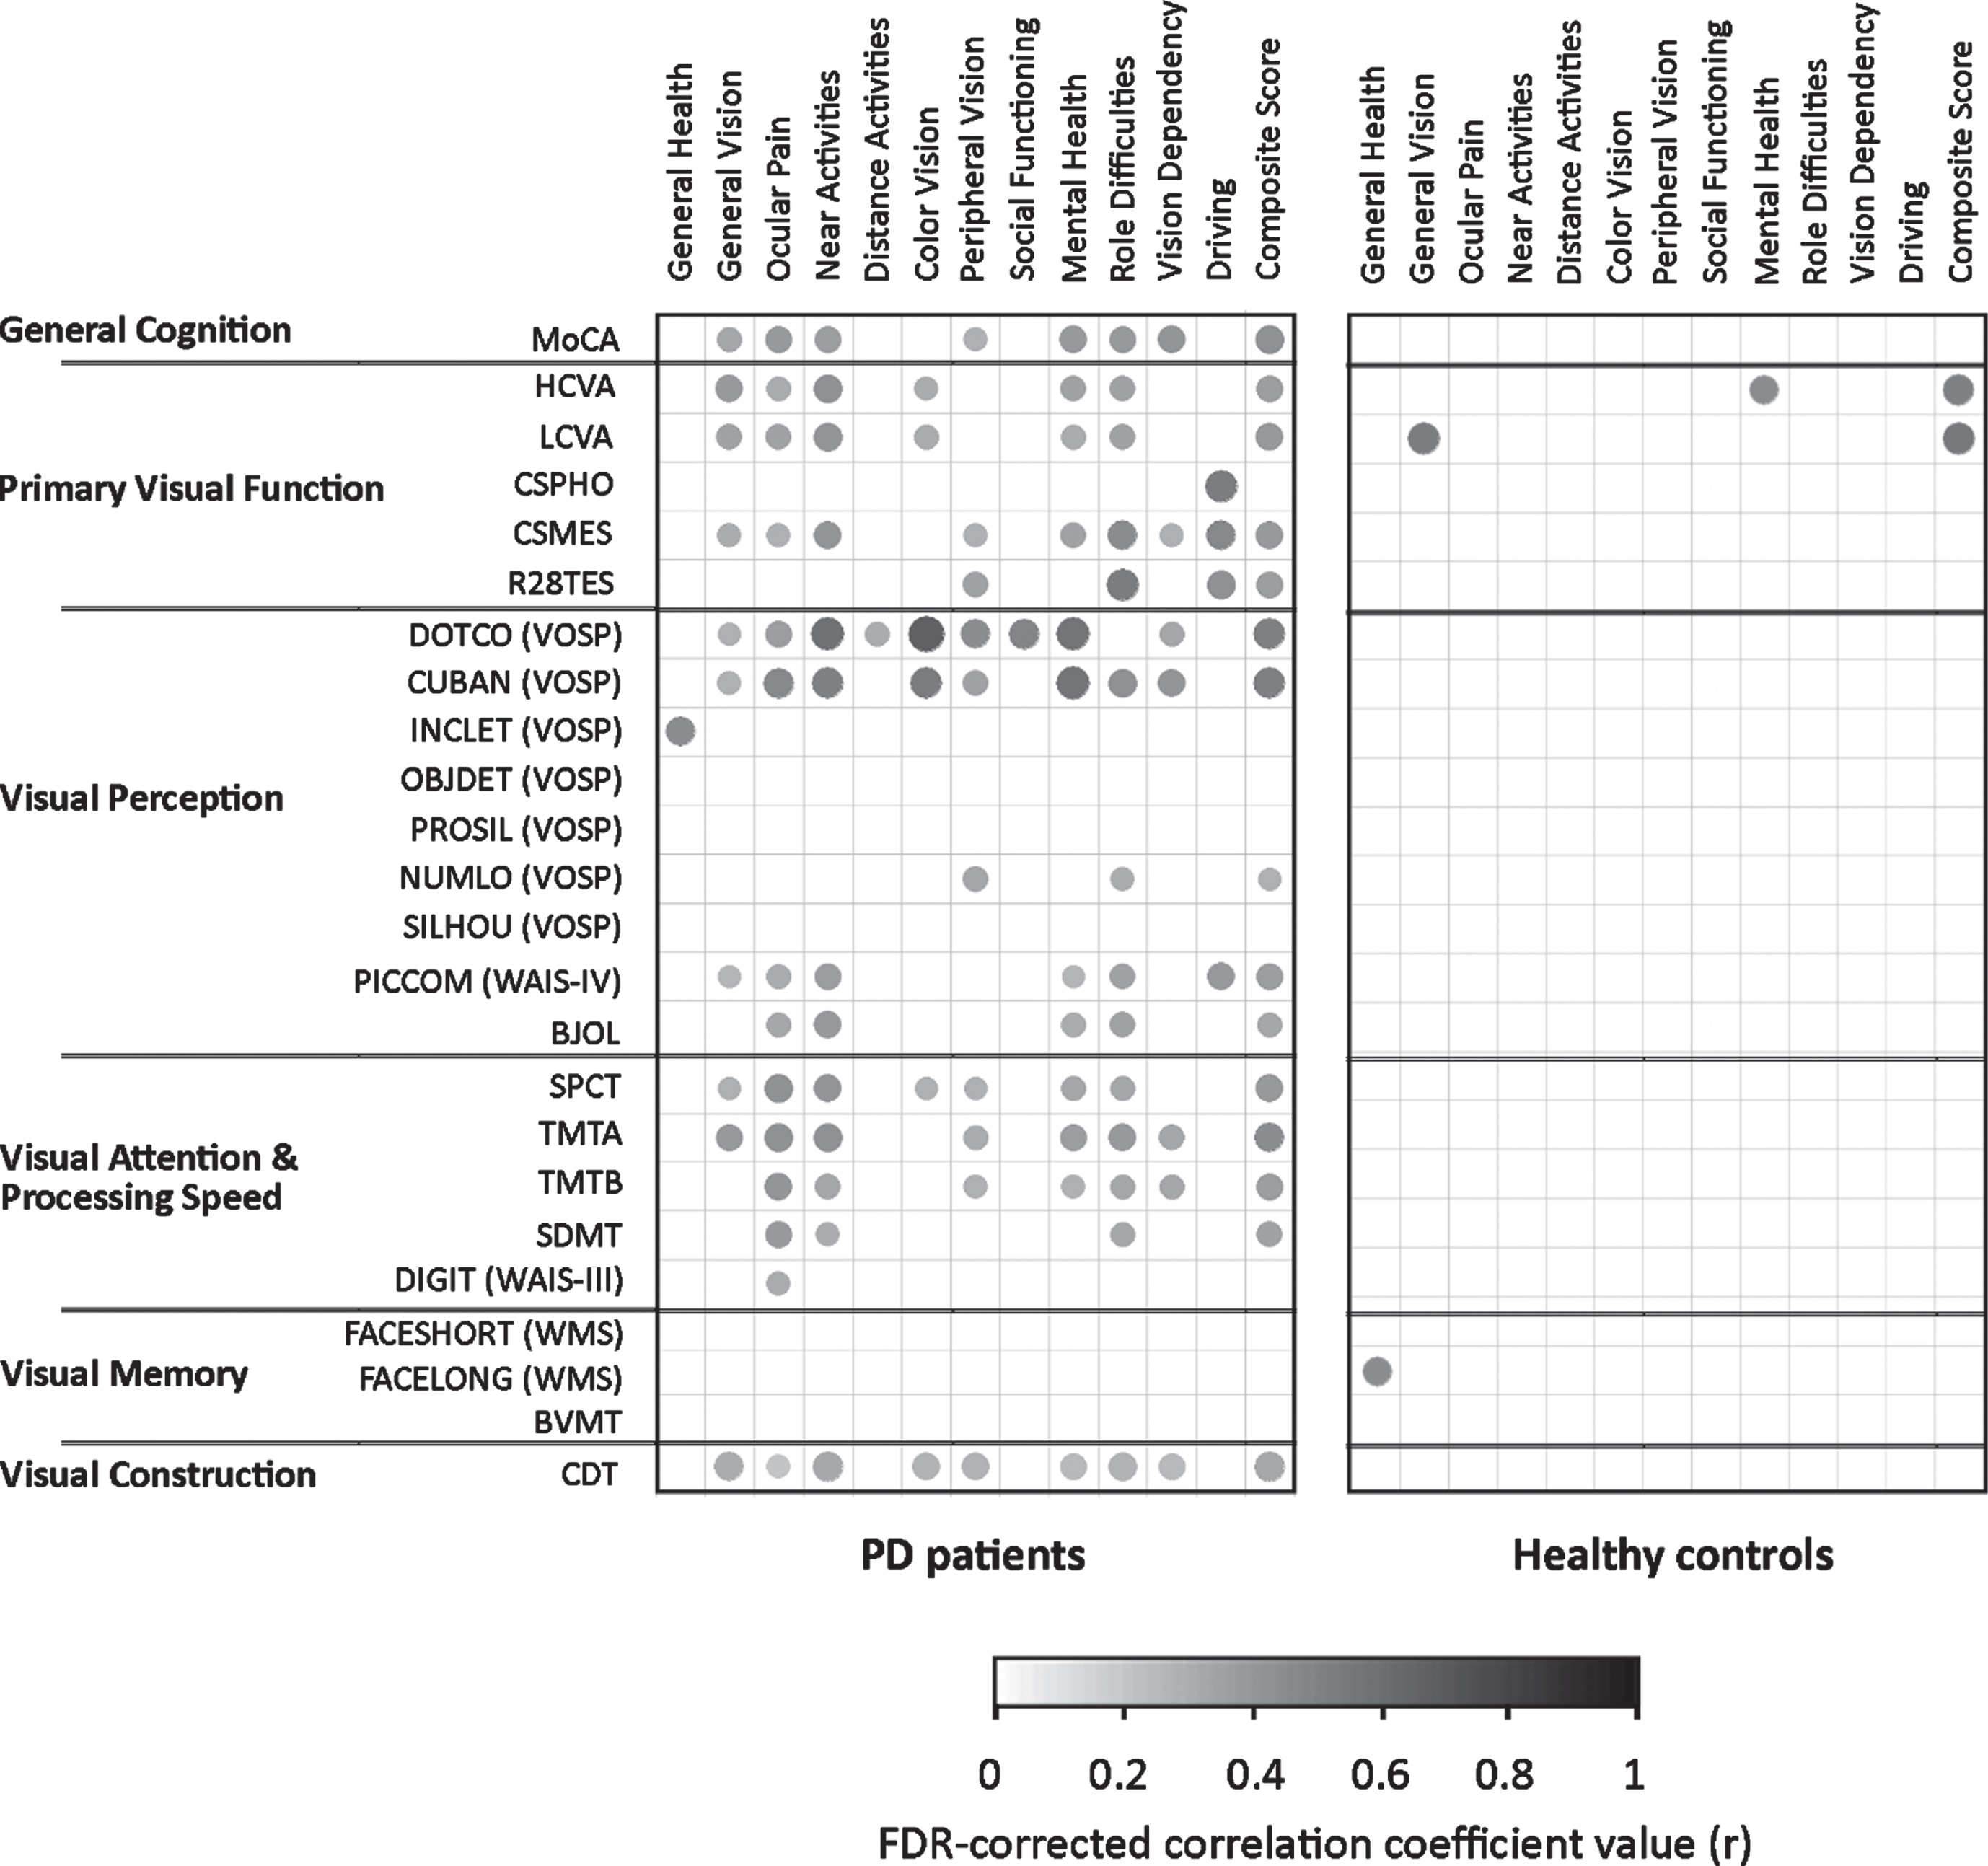
Correlations between NEI VFQ-25 sub-scores and visual outcomes in PD patients and healthy controls. Correlation plots are shown for PD patients (left) and for healthy controls (right), with the NEI VFQ-25 sub-scores on the upper horizontal axis and the parameters of general cognition, primary visual function and visual cognition (including Visual Perception, Visual Attention & Processing Speed, Visual Memory and Visual Construction) on the left vertical axis. Correlation coefficients (r) that were significant after correction for multiple comparisons (FDR) are shown in the grids as points, whose intensity in grayscale and point size represents the magnitude of the correlation coefficient, ranging from 0 (null) to 1 (maximum). Please, note that the time values (s) from TMT-A and TMT-B were converted into negative values (-s). PD, Parkinson’s disease; FDR, False Discovery Rate; MoCA, Montreal Cognitive Assessment; HCVA, High-contrast Contrast Visual Acuity; LCVA, Low-contrast Contrast Visual Acuity; CSPHO, Photopic Contrast Sensitivity; CSMES, Mesopic Contrast Sensitivity; R28TES, Total Error Score from Roth-28 color test; VOSP, Visual Object and Space Perception battery; DOTCO, Dot Counting; CUBAN, Cube Analysis; INCLET, Incomplete Letters; OBJDET, Object Detection; PROSIL, Progressive Silhouettes; NUMLO, Number Location; SLHOU, Silhouettes; PICCOM (WAIS-IV), Picture Completion subtest of the Wechsler Adult Intelligence Scale IV; BJOL, Benton Judgment of Line Orientation; SPCT, Salthouse Perceptual Comparisons Test; TMTA, Trail Making Test part-A; TMTB, Trail Making Test part-B; SDMT, Symbol Digit Modalities Test; DIGIT (WAIS-III), digit repetition test of WAIS III; FACESHORT (WMS), Wechsler Memory Scale (WMS) - III Faces test short-term recall; FACELONG (WMS), WMS-III Faces test long-term recall; BVMT: Brief Visuospatial Memory Test - Revised; CDT, Clock Drawing Test.
To further establish how visual dysfunction could be related to reduced vision-related quality of life in PD patients, we performed stepwise hierarchical linear regression analyses. We introduced visual outcomes as independent factors and the subitems of NEI VFQ-25 as dependent variables. We only included as predictors visual function variables significantly correlated with NEI VFQ-25 sub-scores after FDR p-value correction, while controlling for the effect of age and LEDD, given that both could act as confounding factors of visual outcomes. Results are shown in Fig. 2. In PD patients, we observed that the visual cognition parameters better explained the NEI VFQ-25 sub-scores than primary visual function. In fact, Trail Making Test part-A and dose of dopaminergic medication (LEDD) were significantly associated with NEI VFQ-25 Composite score, but visual outcomes on primary visual function tests were not. Remarkably, Dot Counting form VOSP was the test that explained most of the variance in NEI VFQ-25 sub-scores, since it was significantly associated with 5 out of 12 sub-scores. One of the NEI VFQ-25 sub-scores that was associated with Dot Counting test was Color Vision, a subitem that was not associated with Total Error Score from the Roth-28 color test. Interestingly, the former parameter was the one that best explained the variance of the NEI VFQ-25 sub-scores Peripheral Vision (R2-change: 0.21) and Role Difficulties (R2-change: 0.36). Another notable association was the one observed for the NEI VFQ-25 sub-score Driving and photopic CS, the latter explaining 41% of its variance. As expected, due to the known influence of circulating dopamine levels on motor, cognitive and visual function, LEDD was the variable most often associated with NEI VFQ-25 sub-scores, explaining between 5% and 10% of the variances in 6 out of 12 subitems.
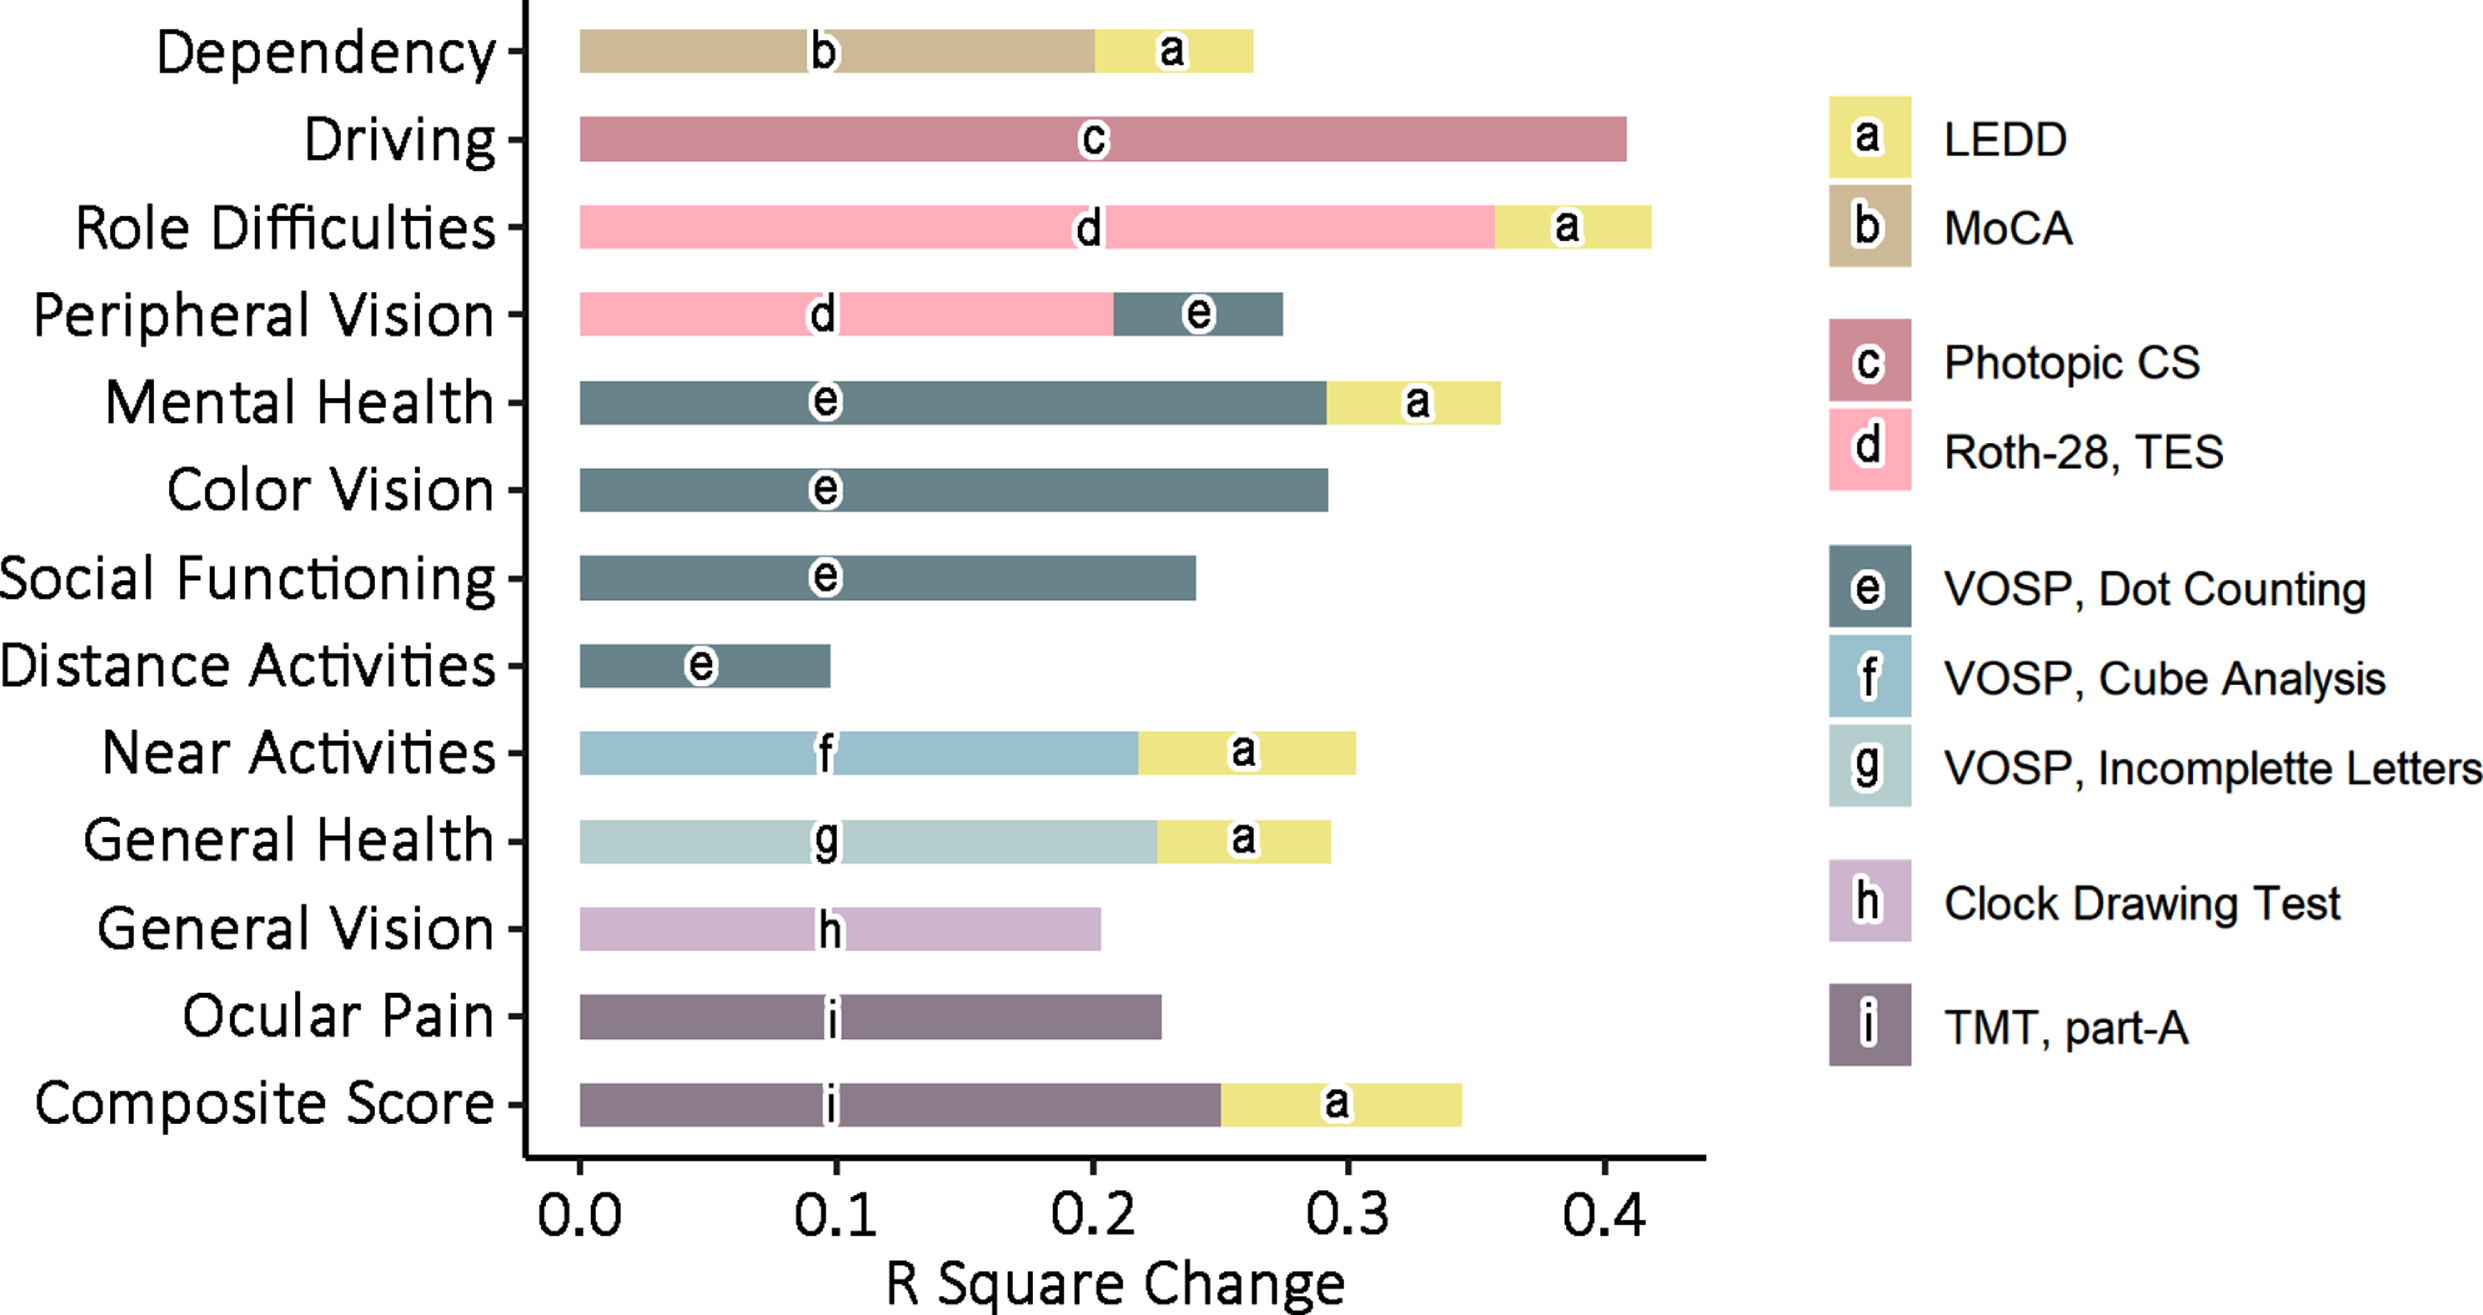
Predicted effects of visual outcomes and PD-related variables on NEI VFQ-25 sub-scores. Bar charts represent the R-squared change (the improvement in the proportion of explained variance) of each significant predictor variable selected in stepwise linear regression. In stepwise regression analyses, significantly correlated visual outcomes, age and LEDD were introduced as independent variables, whereas NEI VFQ-25 sub-scores were introduced as dependent variables. The legend on the right illustrates the color assigned to each significant predictor. PD, Parkinson’s disease; MoCA, Montreal Cognitive Assessment; Photopic CS, Photopic Contrast Sensitivity; Roth-28 TES, Total Error Score from Roth-28 color test; VOSP, Visual Object and Space Perception battery; TMT part-A, Train Making Test part-A; LEDD, Levodopa Equivalent Daily Dose.
On the other hand, in controls, significant associations for NEI VFQ-25 sub-scores were primarily found with primary visual outcomes. Concretely, after controlling for the effect of age, low-contrast VA was significantly associated with the NEI VFQ-25 Composite and General Vision sub-scores, and high-contrast VA and age explained about 25% of the variability of Mental Health sub-score. General Health was the only subitem significantly related to visual cognition tests. Specifically, long-term face recognition from WMS-III explained 26.7% of the variance in General Health NEI VFQ-25 sub-score in controls.
DISCUSSION
In the present study, we analyzed the relationship between the perceived visual quality of life and the impairment of primary and visual cognitive function in PD patients and controls. As the most notable result, we observed that in PD patients most of the domains of the NEI VFQ-25 questionnaire were associated with visual cognition tests that assessed visual perception, visuoconstructive abilities and visual attention and processing speed, and to a lesser extent, with high- and low-contrast VA. In controls, however, only high- and low-contrast VA were associated with few domains of visual quality of life (NEI VFQ-25 sub-scores). To the best of our knowledge, this is the first study in PD patients that has analyzed the association between the perceived visual quality of life and a comprehensive battery of visual tests, quantifying not only primary visual function but also visual cognition outcomes.
As far as we know, at present only three publications evaluated the NEI VFQ-25 in PD patients [28–30]. Although they also reported a relationship between NEI VFQ-25 scores and disease severity or visual outcomes, the sample sizes were smaller, not all studies analyzed NEI VFQ-25 sub-scores and none investigated the relationship with visual cognition tests. In fact, in our study we found that certain visual cognition domains better explained NEI VFQ-25 items than low-contrast VA or contrast sensitivity, two primary visual function measures that are typically affected in PD. Nonetheless, we found that NEI VFQ-25 Driving sub-score was mainly explained by photopic contrast sensitivity. This is in line with previous studies in PD, where contrast sensitivity has been related to driving performance [12]. On the other hand, in controls, few NEI VFQ-25 items correlated with visual outcomes. We observed that high- and low-contrast VA were associated with General Vision, Mental Health, and the Composite Score of NEI VFQ-25, and long-term face recognition sub-test from WMS-III was associated with General Health NEI VFQ-25 sub-score. Like PD patients, controls in our study underwent an exhaustive ophthalmological and neurological screening to rule out structural or functional alterations in the eye or the visual pathway. Therefore, we interpret that the observed relationship of high- and low-contrast VA with General Health and Mental Health sub-items in controls could be explained by the effect of age, among other potential idiosyncratic conditioning factors. At present, it is well established that in the healthy population without ocular pathologies aging is associated with a deterioration in contrast sensitivity and low-contrast VA, which has been related to a decrease in the efficiency and absorption rate of the cones [31] and that has a decisive influence on vision-related quality of life [32]. Similarly, it is well established that PD patients have a deterioration in low-contrast VA and contrast sensitivity greater than what is observed in age-matched healthy controls, and these primary visual function disorders critically influence patient’s performance on visual cognition tests [33]. According to the results of our present work, it seems that in PD patients the difficulties to carry out a higher order processing of visual stimuli, reflected by the visual cognition tests, have a greater impact on the vision-related quality of life than the disturbances of more primary visual function, such as low-contrast VA or contrast sensitivity. This finding is to some extent expected since it is well established that cognitive impairment is one of the main contributory factors to overall quality of life in PD [34]. In any case, it is important to highlight that the most recommended PD-specific health-related quality of life scales and questionnaires [35] do not include vision-related specific items, so the use of scales such as NEI VFQ-25 is essential to be able to quantify the specific impact that the deterioration of visual function has on the quality of life of PD patients. More importantly, we observed that the visual cognition tests that were more frequently associated with visual quality of life, like Dot Counting and Cube Analysis from VOSP or Trail Making Test, have in common that all require a precise visual scenery screening for completion. Interestingly, we also found that PD patients with visual hallucinations had significantly worse VOSP Cube Analysis scores than patients without visual hallucinations, and, while the former group did not have a higher percentage of dopamine agonist use than the latter, the patients with visual hallucinations had significantly lower NEI VFQ-25 scores than the remaining patients. Thus, it could be interpreted that a poorer visuospatial perception could be an important factor contributing to the worse vision-related quality of life observed in PD with visual hallucinations. Although these three tests allegedly pertain to different visual cognitive domains (Dot Counting and Cube Analysis from VOSP to Visual Perception and Trail Making Test to Attention and Processing Speed), the oculomotor requirements are similar, and it could be that the dysfunctional eye movements acted as a primary trigger for impairment in visual information processing that subsequently resulted in reduced quality of vision. Similarly, we found that Trail Making Test part-A was significantly associated with Ocular Pain sub-item of NEI VFQ-25. Although, as explained before, we performed an ophthalmological examination and a detailed clinical interview to rule out conditions other than PD that could alter the afferent visual pathway, we did not exclude participants with dry eye or blepharitis [36]. Both conditions are known to influence the performance on visual function tests and are more common in PD patients than in controls. Therefore, we cannot rule out that the associations between some visual cognition tests and NEI VFQ-25 subitems that we observed were confounded by ocular surface pathologies that we did not control for.
The NEI VFQ-25 questionnaire has some recognized psychometric limitations in terms of unidimensionality and interval-level measurement [37], and methodological solutions have been proposed to minimize them, including different analytical techniques than simply summing up the NEI VFQ-25 sub-scores, such as Rasch-based approach, which allows to transform the raw questionnaire data into an interval-level scale [38, 39]. Despite its psychometric limitations, in the present work we decided to use the originally proposed scoring method of NEI VFQ-25 in order to maintain a consistent methodology with previous articles that used this questionnaire in PD [28–30]. Another limitation of the NEI VFQ-25 version that we used in this work is that it does not have normative values for the healthy Spanish population. In fact, there are few publications that offer normative data or reference values for healthy populations of NEI VFQ-25 scores [39–42]. Unfortunately, these reference values are not directly applicable to our work, not only because they are based on other NEI VFQ-25 versions from other populations, but also because they are based on transformations of the Rasch-based approach [39, 40], consist of medians instead of means [41] or they are already corrected for age and education [42]. Instead, we included a group of controls that was comparable to the group of PD patients in terms of age and sex to provide reference values in the Spanish population and evaluated which items of NEI VFQ-25 questionnaire were significantly worse in PD patients and calculated the effect sizes of these differences. We faced a similar problem when interpreting the clinical relevance of the observed differences in visual function outcomes between PD and controls. The magnitudes for clinically significant changes in visual function tests are specific for each disease, and reference values in high- or low-contrast VA in PD have not yet been established. However, in other neurodegenerative diseases a reduction of 5 letters in high-contrast VA and 10 letters in low-contrast VA are considered clinically meaningful [27]. Based on this approximation, we could speculate that in our study the mean difference between controls and patients for low-contrast VA was clinically meaningful as it was greater than 10 letters (PD: 27.0, controls: 38.2), while the high-contrast VA was not because the group difference was less than 5 letters (PD: 59.1, controls: 61.9).
Finally, some limitations of our study need to be considered. Although some visual tests that we have used have a motor component (such as the Clock Drawing Test and the Trail Making Test, both also included in the MoCA, Salthouse Perceptual Comparison Test, Brief Visuospatial Memory Test or Symbol Digit Modality Test), we have not specifically analyzed the visual-motor abilities, typically affected in PD and that probably have an important impact on the quality of life of patients. Intriguingly, while we did observe a correlation of UPDRS I (mental status, behavior, and mood) and UPDRS II (activities of daily living) with NEI VFQ-25, we did not observe a significant correlation between the motor disability (UPDRS III) and NEI VFQ-25 sub-items. Thus, further research would be required to evaluate the specific influence of PD-related visual-motor abnormalities on the perceived visual quality of life of patients. Similarly, future studies should more exhaustively control for ocular surface pathology and oculomotor deficits, as both can influence on the observed associations in PD. Lastly, the NEI VFQ-25 is a generic questionnaire on vision-related quality of life and does not contain specific questions on vision-related problems typically referred by PD patients, such as difficulties when crossing narrow places or locations with low light, problems with visual-motor tasks that require some degree of visual attention and mental planning, difficulties with depth perception, double vision, and visual hallucinations [5]. In this sense, a questionnaire on PD-related visual manifestations has been recently developed, the Visual Impairment in Parkinson’s Disease Questionnaire (VIPD-Q), with which it has been shown that ophthalmological symptoms reported by PD patients significantly interfere with daily activities [43]. The analysis of the relationship between the scores in the VIPD-Q and the outcomes from visual function tests could give an even more precise idea of the relationship between the visual manifestations reported by the patients and the visual dysfunction that we can measure in the clinics. However, because the VIPD-Q was first published in 2019 (after the data for the present work were acquired), we were unable to apply this more specific PD questionnaire in our study. In addition, as far as we know, there are currently only validated versions of the VIPD-Q translated into English, French, and German, but there is no validated version of the questionnaire for the Spanish population, so it would not yet be possible to use it in our population.
In conclusion, the present work supports that the vision-related quality of life of PD patients is especially influenced by alterations in visual cognition tests that assess visual perception, visuoconstructive abilities and visual attention, and processing speed, and to a lesser extent by high- and low-contrast VA and contrast sensitivity. Future studies are warranted to confirm our results and to specifically evaluate the extent to which the visuoperceptive and visuomotor disorders referred by PD patients are related to the visual dysfunction that can be quantified with psychophysical and neuropsychological tests.
Footnotes
ACKNOWLEDGMENTS
The authors also want to thank the Biscay Parkinson’s disease Association (ASPARBI) and all the patients and participants involved in the study.
This work was partially co-funded by Michael J. Fox Foundation [RRIA 2014 (Rapid Response Innovation Awards) Program (Grant ID: 10189)], by the Instituto de Salud Carlos III through the project “PI14/00679” and “PI16/00005”, the Juan Rodes grant “JR15/00008” (IG) (Co-funded by European Regional Development Fund/European Social Fund - “Investing in your future”), and by the Department of Health of the Basque Government through the projects “2016111009” and “2019111100”.
CONFLICT OF INTEREST
The authors have no conflict of interest to report.