
Abstract
Background:
Objective:
We tested the hypothesis that structural integrity of brain regions (subthalamic nucleus and globus pallidus internus, GPi) which link basal ganglia to the mesencephalic locomotor region (MLR), a region involved in automatic gait, would be associated with FOG response to dopaminergic therapy.
Methods:
In this observational study, thirty-six participants with PD and definite FOG were recruited to undergo diffusion kurtosis imaging (DKI) and multiple assessments of dopa responsiveness (UPDRS scores, gait times ON versus OFF medication).
Results:
The right GPi in participants with dopa-unresponsive FOG showed reduced fractional anisotropy, mean kurtosis (MK), and increased radial diffusivity relative to those with dopa-responsive FOG. Furthermore, using probabilistic tractography, we observed reduced MK and increased mean diffusivity along the right GPi-MLR tract in dopa-unresponsive FOG. MK in the right GPi was associated with a subjective dopa-response for FOG (r = –0.360, df = 30, p = 0.043) but not overall motor dopa-response.
Conclusion:
These results support structural integrity of the GPi as a correlate to dopa-response in FOG. Additionally, this study suggests DKI metrics may be a sensitive biomarker for clinical studies targeting dopaminergic circuitry and improvements in FOG behavior.
INTRODUCTION
Freezing of gait (FOG) is a common, disabling feature of Parkinson’s disease (PD) that results in an increased frequency of falls and reduced quality of life [1, 2]. Although there is no effective approach to the management of FOG, some patients have a robust response to dopaminergic therapy while others do not [3, 4]. Even for dopa-responsive FOG, management is limited by motor fluctuations, which can become increasingly complex and eventually lead to loss of response. These observations implicate the dopaminergic system in FOG pathophysiology and suggest that further understanding of the biological underpinnings of dopa-response in FOG may provide an important therapeutic target. FOG has been classified based on its dopa-response in several ways: OFF-FOG is the term commonly used to refer to FOG that occurs in the practically defined OFF medication state, while ON FOG occurs in the practically defined ON medication state; however, FOG may only occur in the ON-state which has been referred to as dopa-induced FOG [5]. When FOG occurs in both ON and OFF-state and improves with a further increase in dose, participants are referred to having pseudo-ON FOG, and more recently diphasic FOG has been described [5]. If there is no effect derived at all from dopaminergic therapies on FOG, this is termed dopa-resistant FOG [6]. For the sake of this study, we classify patients as dopa-responsive if there is a clinically significant improvement in FOG with dopaminergic therapy, or dopa-unresponsive if there is no change, as in dopa-resistant FOG.
To date, a limited number of studies have investigated the neurobiological basis for dopa-response and empirically based treatments to improve FOG in dopa-unresponsive individuals, which has remained elusive [7, 8]. Thus, establishing brain-based markers of FOG response to dopaminergic therapies is needed to advance our understanding of dopa-unresponsive FOG. The objective of the current study was to establish the relationship between structural changes in the brain of participants with and without dopa-responsive FOG.
Dopamine has a central role in basal ganglia circuitry as it inhibits the indirect pathway and facilitates the direct pathway, facilitating movement. Dopamine deficiency at the striatal level in PD leads to overactivity of the indirect pathway and underactivity the direct pathway which can be normalized using dopaminergic therapy. The mesencephalic locomotor region (MLR), which includes the pedunculopontine nucleus (PPN) is an upper brainstem structure, critical to the production of locomotion and automatic gait [9, 10]. Degeneration of the MLR and disrupted functional connectivity of the MLR to cortical structures are associated with poor motor planning and greater freezing severity [11–13]. The MLR receives input from descending basal ganglia inputs via GABAergic projections from globus pallidus internus (GPi) and glutamatergic projections from the subthalamic nucleus (STN). This is demonstrated by studies in non-human primates demonstrating GPi stimulation reduces the mean discharge rate of PPN neurons and GABA antagonists alleviate akinesia [14]. In rodent models, high-frequency stimulation of STN directly modulates PPN neural activity via excitatory fibers [15]. Given the importance of the GPi and STN in linking the dopamine-rich basal-ganglia circuitry to the brainstem’s locomotor center (see diagram in Fig. 1), we hypothesize that disruption of the structural integrity of these regions would be associated with a reduction in FOG responsiveness to dopaminergic therapy.
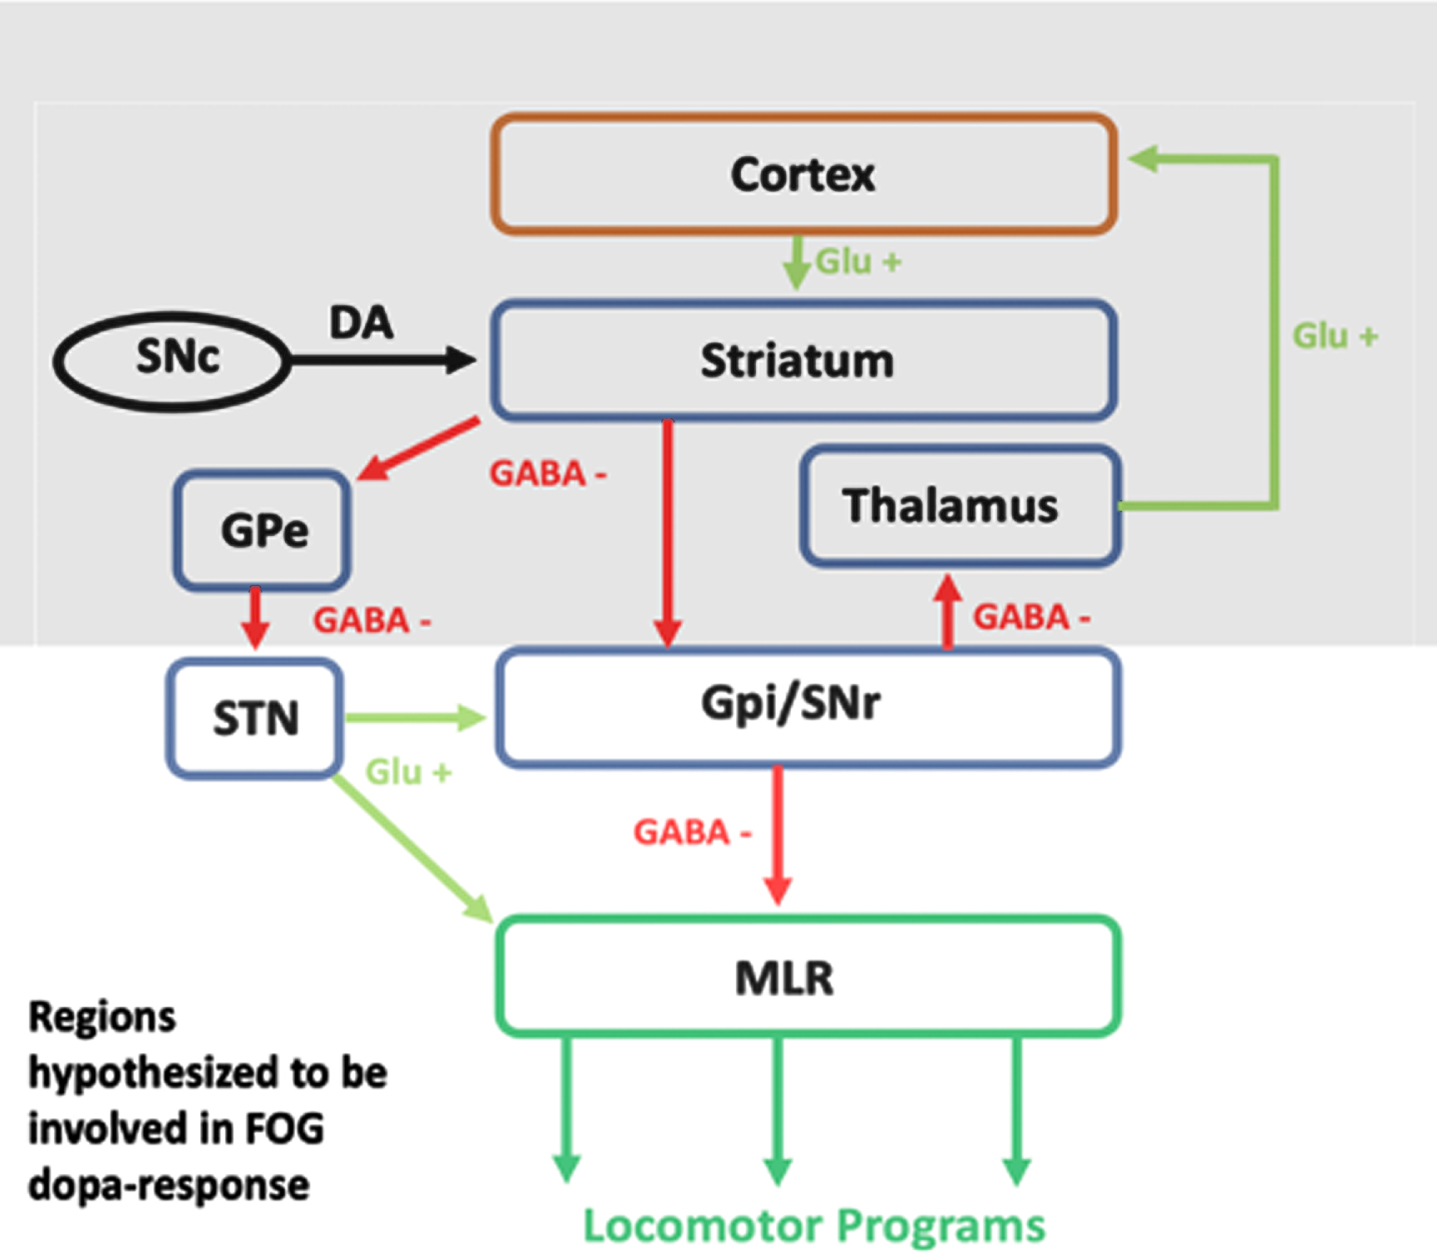
Conceptual Model Demonstrating the Connection Between Dopamine and Locomotor Programs. Dopamine (DA) depletion as a result of PD is associated with disruptions to the direct and indirect basal-ganglia pathways [16]. Treatment with dopaminergic medications normalizes this circuit and as a result downstream MLR function; however, some patients do not experience improvements in FOG, which may be the result of disrupted structural integrity along this circuit.
Idiopathic PD is associated with the progressive, widespread degeneration of basal-ganglia nuclei, cerebellar, and brainstem structures [17–19]. In PD participants with FOG, this degeneration appears to be magnified [20–22]. While a relationship between structural changes and FOG has been described, the relationship to dopa-response has yet to be determined. Diffusion imaging methods allow for the non-invasive assessment of subcortical gray matter and white matter pathways and advancements in this technique have improved the sensitivity of diffusion metrics in brain tissue by estimating the kurtosis of the water diffusion probability distribution function [23]. In the current study, we sought to evaluate changes in GPi, STN, and MLR structural integrity using diffusion kurtosis imaging (DKI) to compare participants with dopa-responsive and dopa-unresponsive FOG.
MATERIALS AND METHODS
Subjects
This study was approved by the Institutional Review Board at the Medical University of South Carolina, Charleston, SC. All participants provided written informed consent to take part in the study. Thirty-six participants with a diagnosis of PD (based on the UK Brain Bank Criteria) and definite [24] FOG were recruited from the Medical University of South Carolina Movement Disorders clinic and the Ralph H. Johnson VA Movement Disorders clinic to participate in an observational study. Participants were categorized in one of two groups: a dopa-responsive FOG group consisting of 21 participants and a dopa-unresponsive group consisting of 15 participants. Freezing status and categorization was based on objective clinical evaluation which required direct observation of FOG by a movement disorder neurologist. Patients were identified as potential subjects for the study if they scored at least a 1 in question 1 the new Freezing of Gait Questionnaire (nFOGQ) “Did you experience freezing episodes over the past month?”, and > 1 on Item-14 on the Unified Parkinson’s Disease Rating Scale (UPDRS) “Freezing when walking” where 0 = None, 1 = Rare freezing when walking; may have start hesitation, 2 = Occasional freezing when walking, 3 = Frequent freezing, occasionally falls from freezing, and 4 = Frequent falls from freezing). Definite [24] freezing and dopa-response categorization for each participant was objectively confirmed by a movement disorders neurologist (G.J.R.) via visualization of FOG during clinical evaluation of the participant’s gait, and a time up and go task with and without dual tasking in the OFF and ON state. All participants had their dopamine regimens clinically optimized prior to participation in this study to minimize the likelihood of a false non-response categorization. Exclusionary criteria for both groups included MRI contraindications (ferromagnetic materials), severe cognitive dysfunction whereby subjects would not be able to follow directions or study procedures (based on Mini-Mental State Examination (MMSE) score and PI judgement), deep brain stimulation surgery, and gait dysfunction for reasons other than PD.
MRI data acquisition
MRI scans were collected at MUSC’s Center for Biomedical Imaging on a 3T Siemens Trio scanner, which was later upgraded to a 3T Siemens Prismafit scanner. On both scanners, data were acquired using a 32-channel head coil. Sequences were closely matched to minimize potential for differences in diffusion metrics (see Supplementary Material for test-retest reliability of diffusion metrics). For all subjects, we obtained T1 structural scans (TR = 2300 ms, TE = 2.26 ms, TI = 900 ms, voxel size = 1 mm isotro-pic, field of view = 256 mm, flip angle = 8°) and diffusion weighted images (TE = 99 ms, voxel size =3 mm isotropic, field of view = 222 mm, bandwidth =1352 Hz/Pz, phase-encoding direction A > P, number of diffusion encoding directions = 30 with two b-values (1000, 2000 s/mm2) for each direction, 10 images for b-value = 0 s/mm2). On the Trio scanner, the TR for the diffusion images was 6100 ms, TE was 99 ms and the number of oblique axial slices was 46. On the Prisma scanner the TR was 5400 ms, the TE was 99 ms and there were 40 slices per volume.
Behavioral data collection
Behavioral assessments included the new nFOG-Q, the UPDRS, parts I–IV, and laboratory-based gait assessments. The UPDRS and gait assessments were performed in the ON and OFF states to capture the effects of dopaminergic medication on motor behavior and freezing. OFF assessments were made at least 12 h OFF all dopaminergic medication (24 h OFF extended-release formulations or in the practically defined OFF state), ON assessments were made at least 30 min after taking the first dose of medications on the same day (practically defined ON). Objective gait metrics were collected using a GAITRite© digital walkway in which participants performed time timed up and go (TUG) trials while either single tasking (walking at self-selected speed) or dual tasking (serial 7s and/or every other letter of the alphabet). Turn duration was calculated as the time it took for a participant to turn around a cone placed at a predetermined distance at the center of a digital mat (M2), as previously described [25]. Dopa responsiveness as a variable was determined by subtracting the score during the ON state from the score during the OFF state. Demographic and behavioral group comparisons were performed using a 2-sample t-tests or χ2 tests (significant if p < 0.05). Due to the non-normal distribution of gait times group comparisons were performed using the non-parametric Mann-Whitney U test.
Diffusion image processing and analysis
Preprocessing
Raw DKI data (see above) were preprocessed using PyDesigner which includes the following pipeline: denoising to remove thermal noise artifact, correction for Gibb’s ringing, susceptibility distortion correction, eddy current correction, brain masking, smoothing, and Rician noise bias correction. Diffusion tensor and kurtosis metrics were calculated included mean diffusivity, fractional anisotropy, axial diffusivity, radial diffusivity, mean kurtosis, axial kurtosis, and radial kurtosis. DKI metrics have been shown to be reproducible over multiple scanning sessions and random errors for parameters estimated with DKI (ex. MK) are approximately 3% [26].
Regions of interest (ROIs) and exploratory tractography analysis
ROIs were transformed from MNI space into subject diffusion space using SPM12. The left and right PPN ROIs were manually drawn onto diffusion weighed scans by using the following anatomical landmarks: a superior boundary including the inferior colliculus, an inferior boundary including the floor of the fourth ventricle and center cleft of the cerebellum, 3mm anterior to the floor of the fourth ventricle, and 6–7 mm lateral to the midline. The GPi (ATAG-Atlas) [27] and STN ROI (AAL3 atlas) from MNI space, were nonlinearly registered to native subject space using SPM12. Transformation matrices were subsequently applied to each ROI to move them into native (diffusion) space. Using FSLmaths, the mean value of each diffusion metric within the bilateral PPN, STN, and GPi ROIs was calculated.
Exploratory analysis using constrained spherical deconvolution and tractography
To identify the white-matter tracts of interest from which DKI metrics could be extracted, probabilistic tractography was performed in each subject’s native diffusion space. This was accomplished using multi-shell, multi-tissue constrained spherical deconvolution (MSMT-CSD) in MRtrix3 which determined white matter fiber orientations [28, 29]. The Dhollander algorithm was used to estimate the response function for CSD and the iFOD2 tracking algorithm was used to perform probabilistic streamline tractography [28, 29]. To explore the GPi-MLR connection, two thousand streamlines were selected with a step size of 0.2 mm between the GPi and MLR ROIs. A pulvinar-calcarine control tract was created using AAL3 ROIs. The purpose of this control tract was to evaluate whether diffusion metrics were specific to the tracts of interest or the result of global white matter structural changes. Following streamline generation, tcksample extracted diffusion metric values for each streamline and these values were averaged across the tract (Fig. 2).
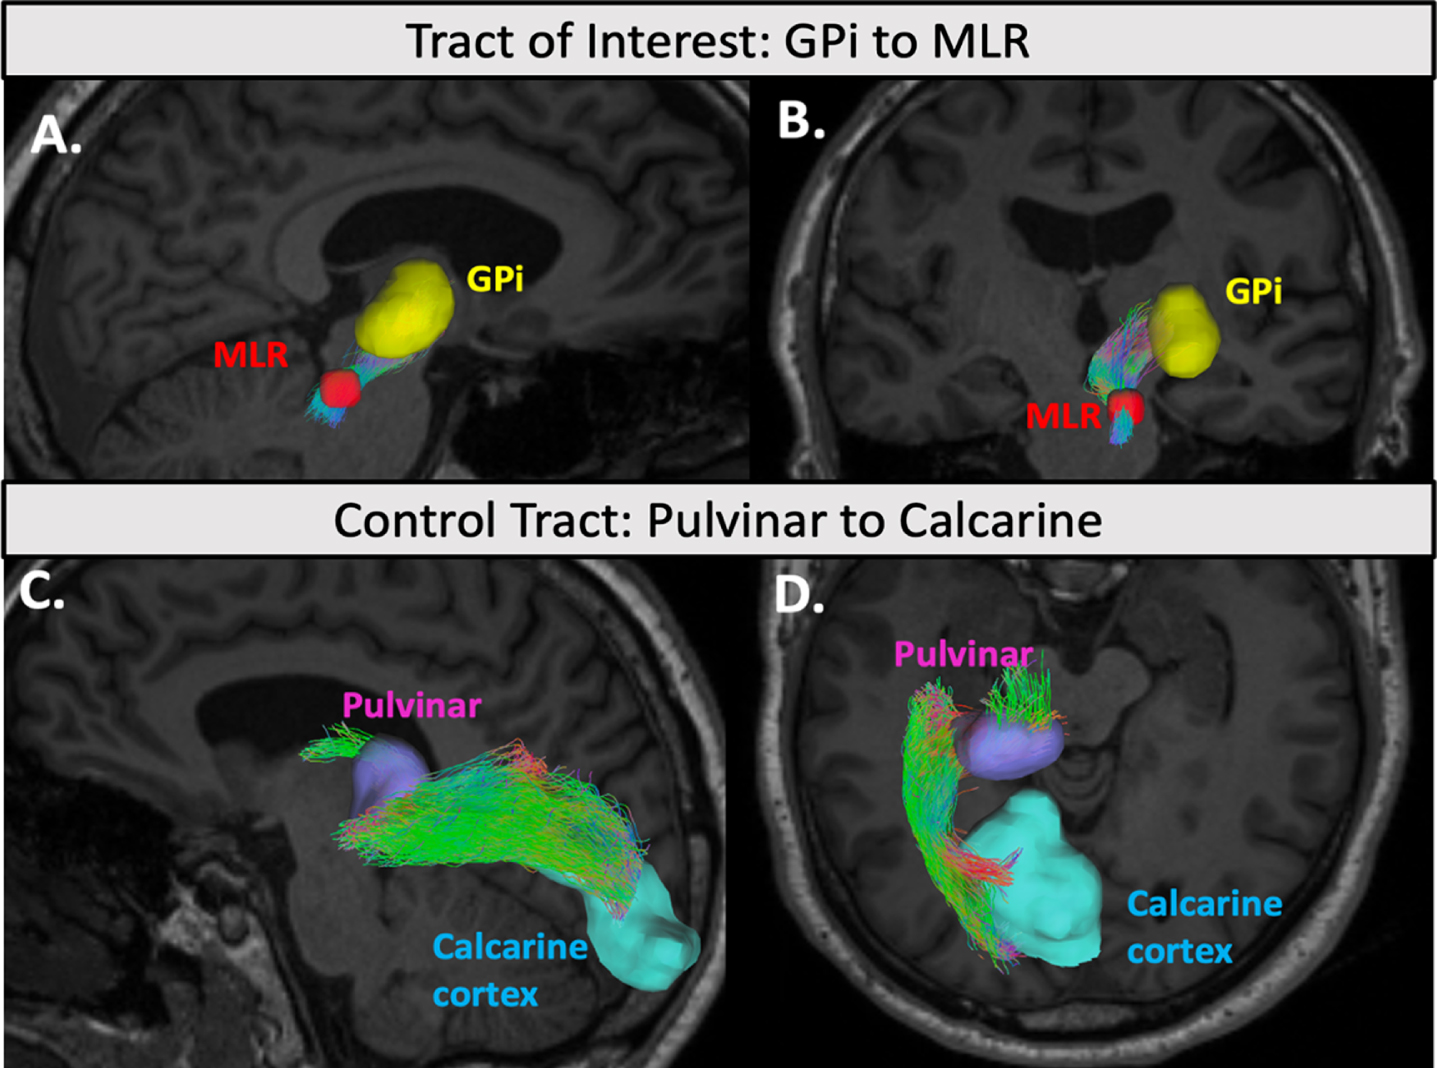
Example tractography of the GPi-PPN and control tract. An example of the GPi-PPN streamlines (A. sagittal view, B. coronal view) and the control pulvinar-calcarine streamlines (C. sagittal view, D. axial view) generated by iFOD2 probabilistic tractography overlaid in a participant’s T1 anatomical scan. ROIs are shown in solid colors: GPi (yellow), PPN (red), Pulvinar (purple), and Calcarine cortex (blue). Streamlines are color coded based on their direction. Diffusion metrics were extracted and averaged along each streamline.
Statistical analyses: group comparisons and correlation analysis
Group comparisons
To compare mean diffusion metrics between the FOG responsive and unresponsive groups independent 2-sample t-tests were carried out using IBM SPSS Statistics (Version 25). Assumptions for equality of variances were determined using Leven’s Test, and Bonferroni correction for multiple comparisons was applied to t-tests of the 6 regions of interest assessed (left and right PPN, STN, and GPi). Thus, results were considered significant if p < 0.0083.
Regression analysis
Partial correlations were calculated in SPSS to determine the association between diffusion metrics of ROIs (found to be significantly different between groups) and behavioral measures of dopa-response including change in single and dual task turn times, UPDRS-III (overall motor score) ON vs. OFF, change in UPDRS Item 14 (Freezing) ON vs. OFF after controlling for age and sex. A total of 34 participants were included in the analysis as two did not have complete data in the ON and OFF condition. Variables were log-transformed to meet assumptions of distribution normality prior to being included in the partial correlation analysis; however, diffusion metrics and change scores are displayed in their raw numerical form in the scatterplots (Fig. 4) to help with interpretation.
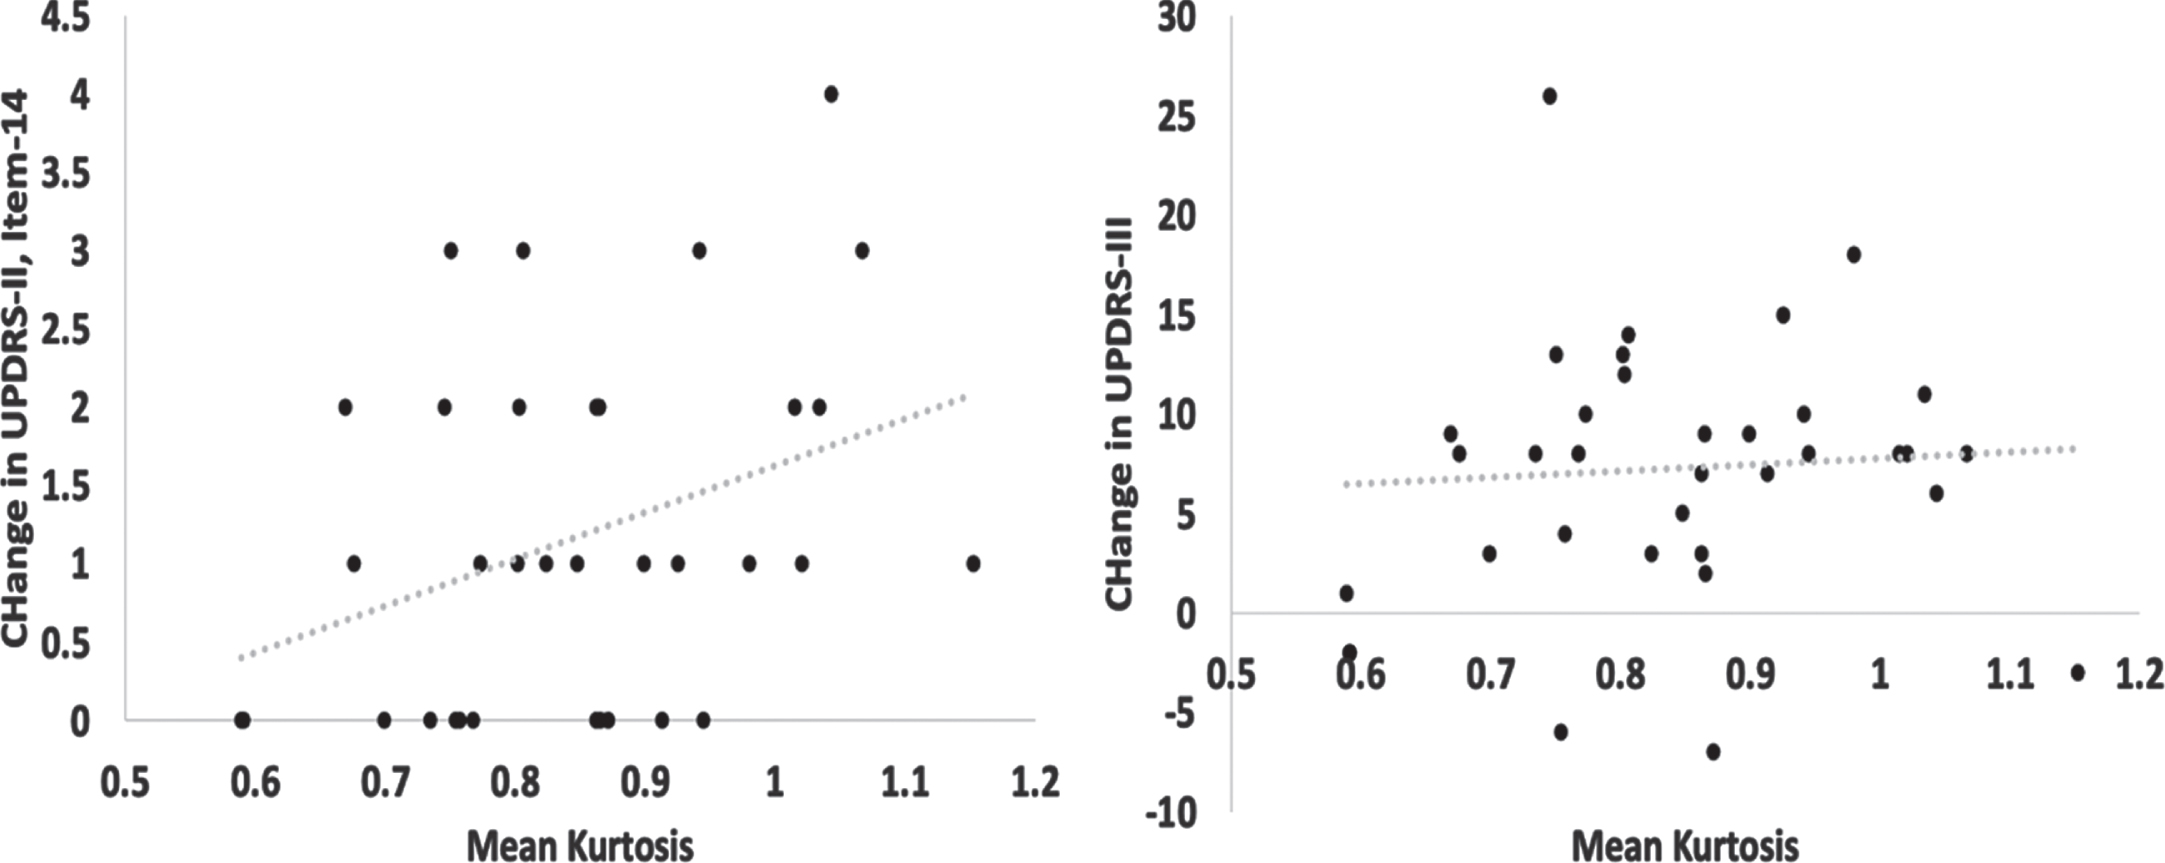
GPi MK correlated with FOG dopa-response but not with overall motor dopa-response. Scatterplots show the positive correlation between change scores of (a) UPDRS-II (Item-14), but not (b) UPDRS-III (overall motor) and mean kurtosis values of the right GPi (x-axis). Values are displayed in their raw numerical form for interpretability. UPDRS, Unified Parkinson’s Disease Rating Scale.
Data sharing
Anonymized imaging and behavioral data can be obtained upon request from investigators to replicate procedures and results.
RESULTS
Demographics and clinical variables
Demographic and clinical characterization of the dopa-responsive and dopa-unresponsive groups can be seen in Table 1. Groups did not differ in disease duration, MMSE scores, LEDD or male to female ratio; however, unresponsive FOG participants were on average older than the responsive FOG participants. Freezing severity as measured by the nFOG-Q was significantly greater in the unresponsive FOG participants. The unresponsive FOG group had a smaller change in their UPDRS-III score and Item-14 (freezing) of the UPDRS when switching from their OFF state to their ON state. Responsive participants had a greater reduction in TUG time and turn duration during single and dual tasks (p < 0.05).
Group Demographics and Behavior
Δ symbol refers to the change in score or time in the DOPA ON versus OFF condition. ∧Significant difference (p < 0.05) in OFF versus ON condition; *Significant difference (p < 0.05) in dopa-responsive versus dopa-unresponsive FOG. &2 DOPA responsive participants did not have a complete ON and OFF UPDRS dataset. #A subset of participants had complete Time Up and Go and Time to Turn datasets (DOPA responsive n = 20, DOPA unresponsive n = 13). For gait time metrics Wilcoxon signed rank tests (ON vs. OFF condition) and Mann-Whitney U tests (dopa-responsive vs. dopa-unresponsive groups) were used in place of paired t-tests and 2-sample t-tests respectively.
Responsive versus Unresponsive FOG: GPi, STN, and PPN regions
Fractional anisotropy of the left (t(34) = 2.905, p = 0.007, Hedges-g = 0.894) and right GPi (t(34) =3.035, p = 0.005, Hedges-g = 1.026) was significantly reduced in the dopa-unresponsive FOG group relative to the dopa-responsive FOG group. Similarly, mean kurtosis of the right GPi was reduced in the dopa-unresponsive FOG group (t(34) = 3.036, p = 0.005, Hedges-g = 1.028). Radial diffusivity was greater in the right GPi in the dopa-unresponsive FOG group (t(34) = 2.914, p = 0.006, Hedges-g = 0.985). Group differences in these metrics can be seen in Fig. 3. Although right STN FA and MK showed reductions in the dopa-unresponsive FOG group and the bilateral GPi and right STN showed an increase in MD relative to the dopa-responsive group, these results did not survive corrections for multiple comparisons. Statistics of ROI diffusion metrics in the dopa-responsive versus dopa-unresponsive FOG groups can be seen in Supplementary Table 1.
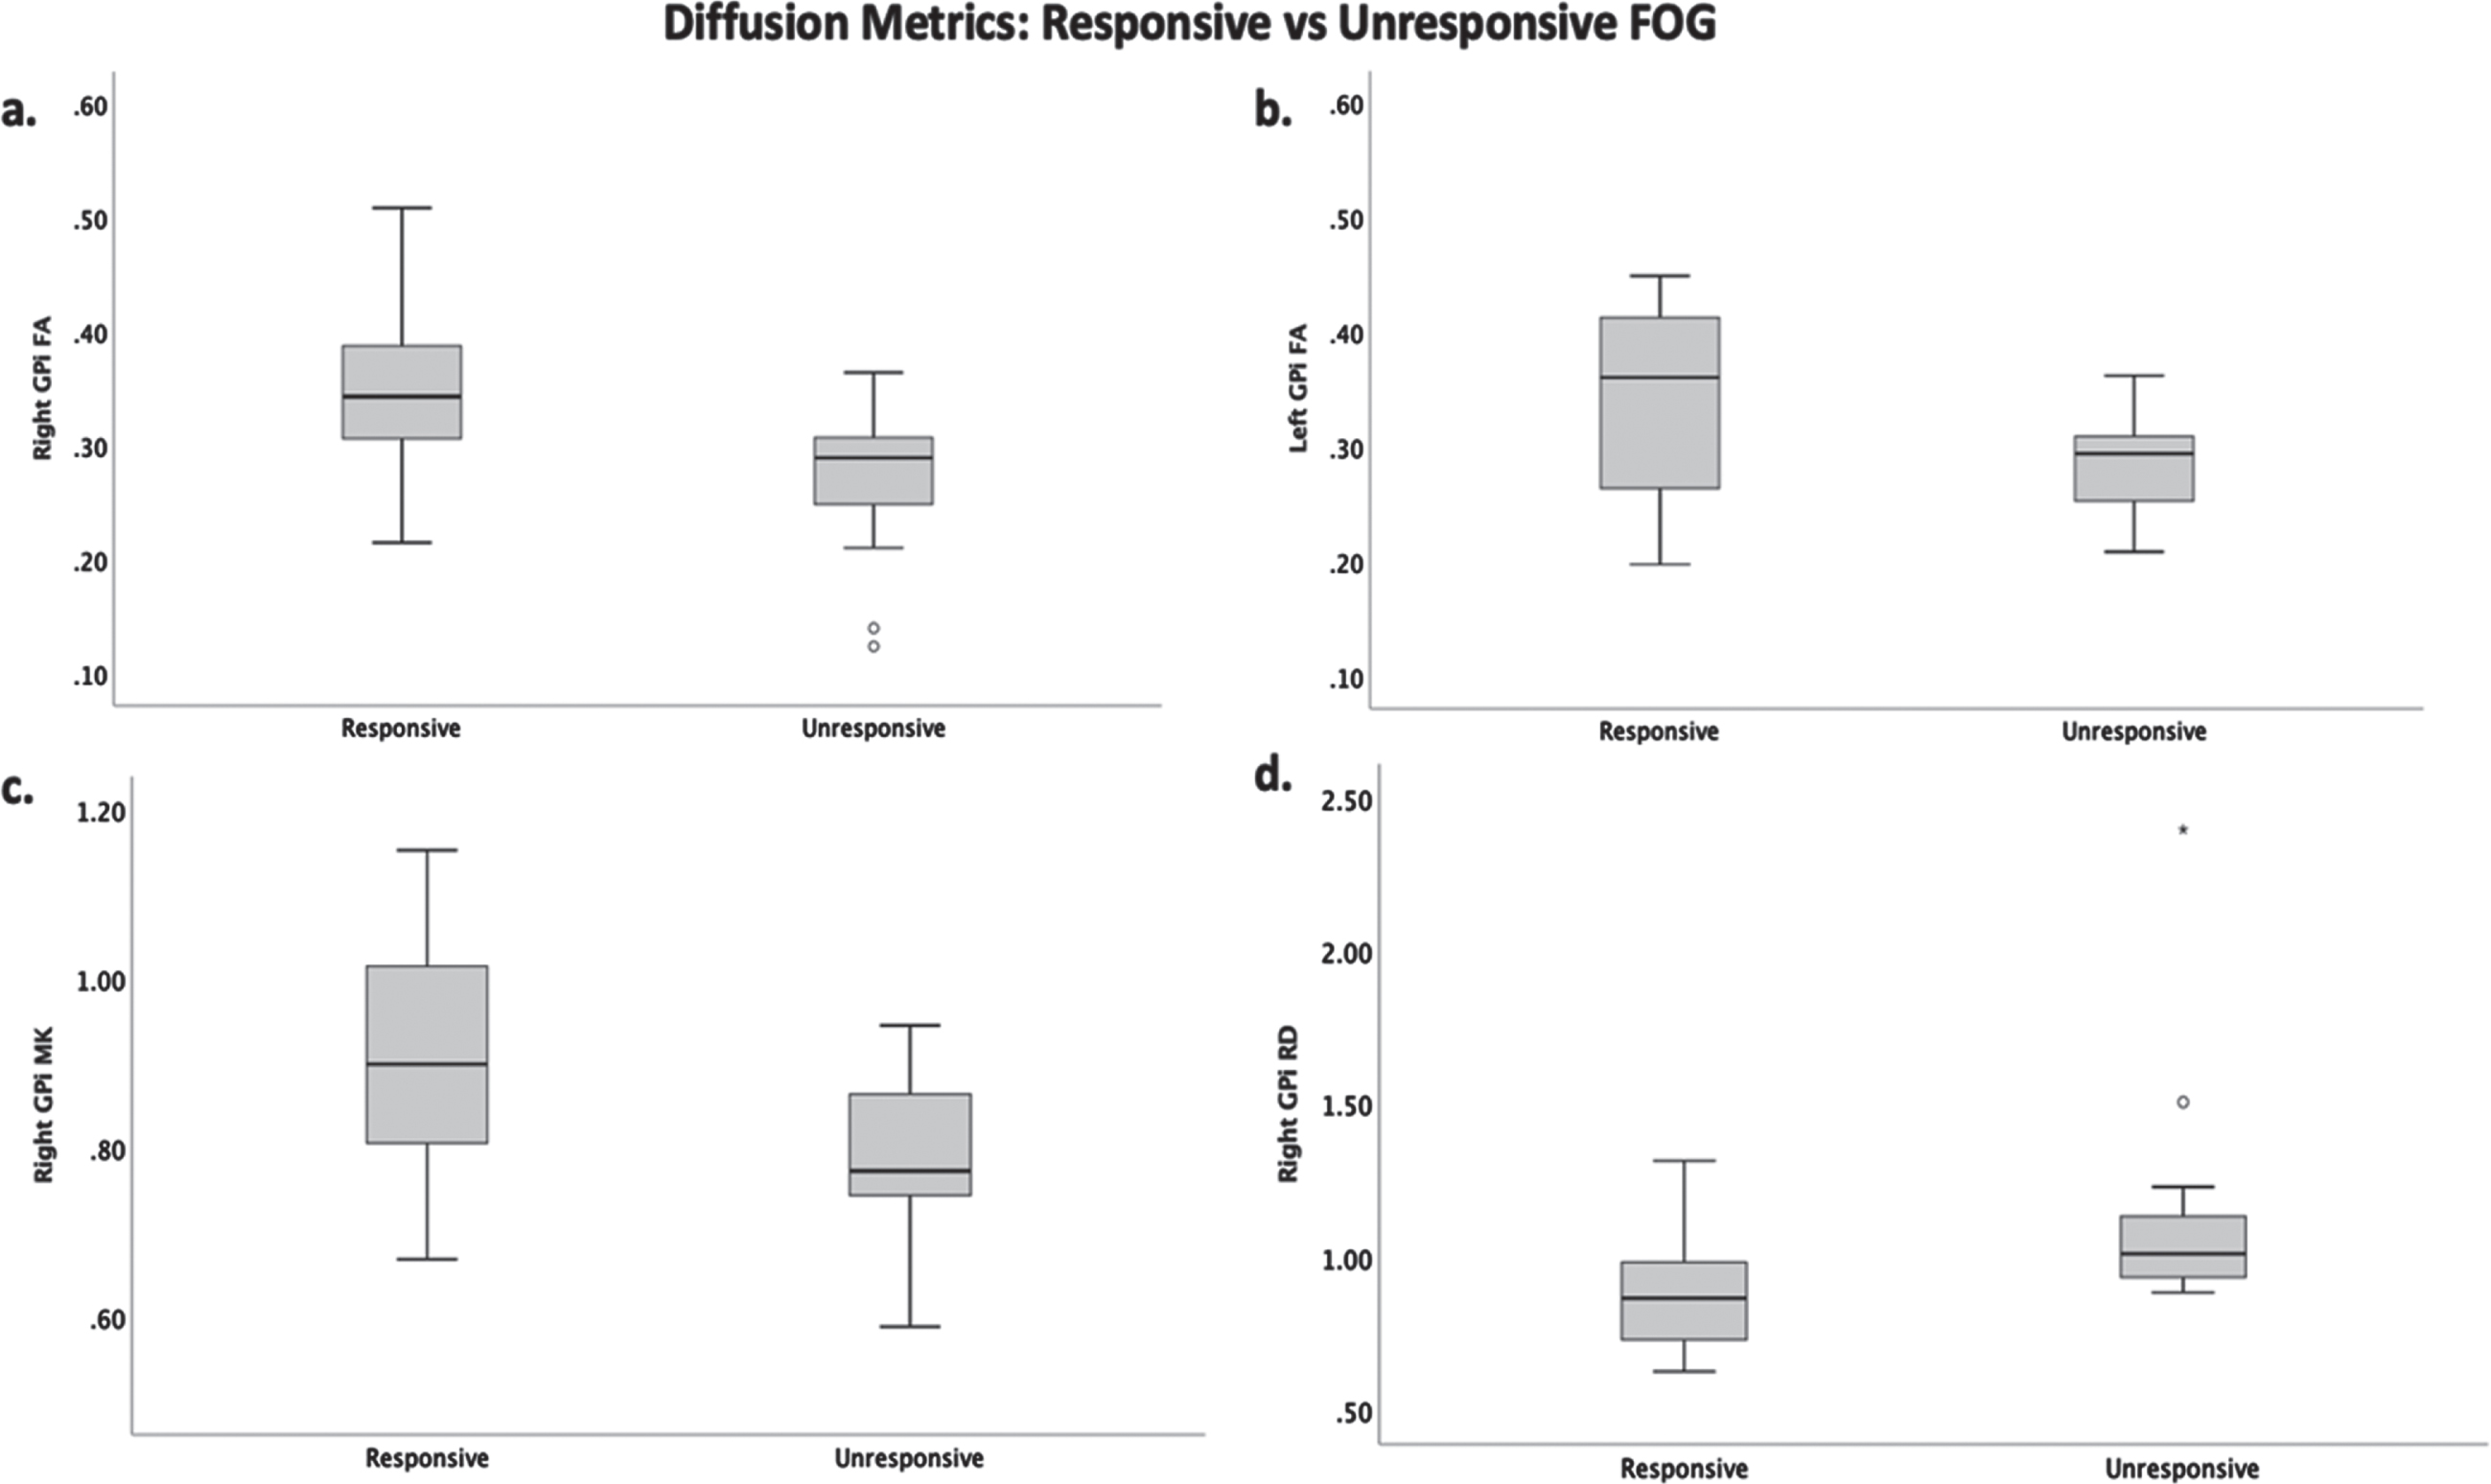
Significant group differences in diffusion metrics. Box and whisker plots display the median and IQR of the dopa-responsive and unresponsive a) FA (fractional anisotropy) of the right GPi, b) FA of the left GPi, c) MK (mean kurtosis) of the right GPi, and d) RD (radial diffusivity) of the right GPi.
Responsive versus Unresponsive FOG: Exploratory GPi-MLR white matter tract
To explore whether group differences in diffusion within the right GPi were specific to the ROI or its connection with the MLR, diffusion metrics along the white-matter tract were compared between groups. The mean kurtosis of the right GPi - MLR tract was lower in the dopa-unresponsive FOG group (t(34) =2.212, p = 0.034, Hedges-g = 0.751) while mean diffusivity was greater in the dopa-unresponsive group (t(34) = 2.049, p = 0.048, Hedges-g = 0.692) (Fig. 3). Other diffusion metrics along the right GPi-MLR tract including AK, RK, FA, AD, and RD did not show significant group differences. No significant differences in diffusion metrics were identified for the left GPI to MLR tract or the Pulvinar to Calcarine control tracts (p > 0.05). Statistics of tract diffusion metrics in the dopa-responsive versus dopa-unresponsive FOG groups can be seen in Supplementary Table 2.
Relationship between GPi structural integrity and FOG dopa-response
Partial correlations correcting for participant age and gender revealed a significant positive association between change in UPDRS-II Item-14 (FOG severity) and MK in the right GPi (r = –0.360, df = 30, p = 0.043) but not between change in UPDRS-III and MK in the right GPi (r = 0.110, df = 30, p = 0.547) (Fig. 4). RD of the right GPi, and FA of the right and left GPi did not show an association with change in UPDRS-II, Item-14, or change in UPDRS-III. A summary of correlations and partial correlations performed can be seen in Table 2. No significant correlations were observed between change in time to turn measures (ON vs. OFF) and diffusion metrics.
GPi Diffusion Metric and Strength of FOG Dopa-Response
*Partial correlation controlling for age and sex of participants.
DISCUSSION
This study investigated the relationship between GPi, STN, and MLR structural integrity and FOG responsiveness to dopaminergic medication. Participants with dopa-unresponsive FOG demonstrated a reduction in MK, FA, and an increase in RD in the GPi when compared to the dopa-responsive group, which appeared to be primarily lateralized to the right hemisphere. The reduction in MK in the dopa-unresponsive group was additionally evident along the white matter connection from the GPi to the MLR; however, this effect size was smaller than in the GPi gray matter region. While we did not observe an association between objective surrogate measures of FOG, changes in MK within the GPi correlated with a subjective measure of FOG responsiveness (change in ON vs. OFF UPDRS-II Item-14). Overall motor response (change in ON vs. OFF UPDRS-III) did not correlate with MK changes. This is the first study to our knowledge, which has demonstrated an association between structural diffusion metrics and FOG dopa-response.
Diffusion tensor metrics have been used as measures of the structural integrity within Parkinson’s Disease and other neurodegenerative populations. Reductions in FA and increases in MD are thought to represent changes in myelination, or axon density as the result of injury, neurodegeneration, and aging [30, 31]. Meanwhile, increases in RD which represents diffusivity perpendicular to axonal fiber tracts have been associated with reductions in myelination [32]. Previous studies comparing FOG and non-FOG PD have demonstrated FA to be decreased in tracts adjacent to the pallidus, in tracts connecting the PPN to the cerebellar peduncle [22], and within the pallidus,, thalamus, and cerebellum [33]. While laterality changes underlying FOG remain a matter of debate, diffusion changes within the right PPN appear to correlate better with FOG severity [34] and structural connectivity of the PPN is primarily reduced in the right hemisphere [12]. This lateralization of FOG is consistent with our findings, as the dopa-unresponsive FOG group primarily had reductions within the right GPi. Previous studies investigating the relationship of diffusion metrics and dopa-response, however, have been limited. One study found widespread reductions in FA and increases in MD and RD in those with poor dopa-response using tract-based spatial statistics [35]. In an earlier study, deep white-matter hyperintensity burden was associated with the response of axial motor features to L-Dopa [36]. Our current findings add to this limited literature by focusing on FOG dopa-response rather than overall motor dopa-response. Although we did not observe significant changes in diffusion metrics within the MLR, the right GPi had increased RD and the bilateral GPi demonstrated reductions in FA. While the GPi is primarily composed of cell bodies, several white matter tracts pass through and project from the region. This includes the striato-pallido-fugal pathway connecting the striatum and pallidus to the SNr and STN and pallido-thalamic fibers which form the ansa and fasciculus lenticularis [37, 38]. Thus, group differences in FA and RD may reflect axonal degeneration within one or a combination of these tracts. Of note, previous studies in FOG have primarily investigated the entirety of the pallidus rather than separating the GPi from the GPe which may have provided more specificity to changes in diffusion metrics.
Diffusion kurtosis imaging (DKI) has increased sensitivity to structural changes in gray matter and white matter when compared to conventional diffusion tensor imaging techniques but has been less extensively studied in PD [39]. Studies thus far have suggested MK, which reflects the microstructural complexity within biological tissue, is sensitive to early PD changes in subcortical brain regions including the substantia nigra, thalamus, and pallidus [40, 41]. Although studies using kurtosis tensor metrics within basal ganglia gray matter regions have demonstrated an ability to separate PD participants from healthy controls, few studies have investigated the relationship to FOG and no studies have investigated the relationship to FOG dopa-response [41]. Our results for the first time demonstrate a reduction in MK within the right GPi among non-responsive FOG participants, a finding consistent with our hypothesis that these individuals experience a greater degree of cell loss and deafferentation in this key link between dopamine rich brain regions and brainstem locomotor centers. Although MK of the right GPi showed an association with a subjective measure of FOG dopa-response, it did not correlate with overall motor dopa-response, potentially indicating a specific relationship with FOG behavior. To build upon our finding, we additionally wanted to assess the anatomical specificity of this reduction to the GPi rather than its afferents to the MLR. Thus, we examined diffusion metrics along the tract connecting the GPi to the MLR. Unlike diffusion tensor metrics, MK along this tract was reduced in dopa-unresponsive FOG participants. Despite this group difference, the MK effect size was noticeably larger for the GPi gray matter region itself. This suggests that degeneration within the GPi itself or white matter tracts proximal to the region are particularly important for FOG dopa-response.
There were some limitations to this study that should be considered when interpreting the results from this study. While we were able to correct for demographic variables including age and sex, our limited sample size prevented us from performing a comprehensive multivariate model to account for all clinical variables (i.e., disease severity, and time since diagnosis). The effect of this limitation should be minimized by the fact that these variables themselves were not significantly different between groups. Secondly, there were a couple limitations to our neuroimaging methodology including the absence of field mapping or reverse-phase encoded images to correct for susceptibility artifact, and the use of relatively large voxels (3 mm isotropic). The PPN is a small structure, and although a systematic individualized approach was used to delineate this ROI, large voxels may increase susceptibility to partial volume contamination in smaller ROIs such as the PPN. Although larger ROIs such as the GPi were likely sufficiently large enough to avoid significant partial volume effects, it is important to exhibit caution when interpreting diffusion metric results from the PPN ROI. Lastly, the correlation between dopa-response and diffusion metrics in our analysis was based on a subjective rather than objective measure of FOG and thus should be further explored using reliable, well defined objective measures of FOG. While objective measures of gait including change in time to turn while single and dual tasking did not correlate with diffusion metrics, these gait variables are highly variable and are not considered validated markers of FOG severity.
Clinical implications and future directions
To assess the practical clinical implications of these findings, larger studies should cross-validate the predictive strength of diffusion metrics within the GPi. This may ultimately provide biomarkers for patient selection of future clinical trials targeting dopaminergic circuitry and improvements in FOG behavior. Furthermore, dopa-response has been used to inform the selection of candidates for non-pharmaceutical therapeutic treatments including deep brain stimulation (DBS) where FOG has a variable response [42, 43]. Thus, these results may also be informative in the future to refine DBS targeting strategies based on individual anatomy and to establish predictors of FOG response to DBS. For example, downstream targeting of the locomotor circuit, such as PPN stimulation may be more effective in patients where degeneration to the GPi has already occurred. Additionally, multivariate models which include structural measures in addition to dopa-response may have greater or more consistent predictive value than dopa-response alone in predicting FOG outcomes from DBS.
Footnotes
ACKNOWLEDGMENTS
The authors would like to thank the Medical University of South Carolina’s Center for Biomedical Imaging for their resources and technical support during the collection of imaging data. Funding for this work was supported by the National Institutes of Health grant number 1K23NS091391-01A1.
CONFLICT OF INTEREST
The authors have no conflict of interest to report.