
Abstract
Background:
Freezing of gait (FOG) is among the most common and disabling symptoms of Parkinson’s disease (PD). Studies show that deep brain stimulation (DBS) of the subthalamic nucleus (STN) can reduce FOG severity. However, there is uncertainty about pathways that need to be modulated to improve FOG.
Objective:
To investigate whether STN-DBS effectively reduces FOG postoperatively and whether structural connectivity of the stimulated tissue explains variance of outcomes.
Methods:
We investigated 47 patients with PD and preoperative FOG. Freezing prevalence and severity was primarily assessed using the Freezing of Gait Questionnaire (FOG-Q). In a subset of 18 patients, provoked FOG during a standardized walking course was assessed. Using a publicly available model of basal-ganglia pathways we determined stimulation-dependent connectivity associated with postoperative changes in FOG. A region-of-interest analysis to a priori defined mesencephalic regions was performed using a disease-specific normative connectome.
Results:
Freezing of gait significantly improved six months postoperatively, marked by reduced frequency and duration of freezing episodes. Optimal stimulation volumes for improving FOG structurally connected to motor areas, the prefrontal cortex and to the globus pallidus. Stimulation of the lenticular fasciculus was associated with worsening of FOG. This connectivity profile was robust in a leave-one-out cross-validation. Subcortically, stimulation of fibers crossing the pedunculopontine nucleus and the substantia nigra correlated with postoperative improvement.
Conclusion:
STN-DBS can alleviate FOG severity by modulating specific pathways structurally connected to prefrontal and motor cortices. More differentiated FOG assessments may allow to differentiate pathways for specific FOG subtypes in the future.
Keywords
INTRODUCTION
Gait impairments such as freezing of gait (FOG) are highly disabling symptoms in Parkinson’s disease (PD) patients, affecting quality of life, morbidity, and independency [1]. Patients suffering from FOG experience sudden episodes of ineffective stepping despite the intention to walk, commonly perceived as if they were “glued to the ground” [2]. Treatment of FOG is often challenging and insufficient as it can occur ON and OFF dopaminergic medication. When FOG occurs during the OFF-state but can be alleviated with dopaminergic medication it is referred to as “levodopa-responsive freezing” or “OFF-freezing” [3], while “levodopa-unresponsive freezing” is indifferent to changes in dopaminergic medication or can even worsen with medication as “ON-freezing” [4, 5]. Thirdly, “pseudo-ON freezing” describes a state where FOG may occur in the ON-state, however, improves with stronger medication.
While deep brain stimulation (DBS) of the subthalamic nucleus (STN) is an established approach to treat severe PD motor symptoms [6, 7], its effect on gait difficulties and FOG has been discussed controversially. While some studies show improvement [8–11], other studies report no effect or even deterioration of FOG severity with active stimulation, potentially in dependency of electrode localization [12–16]. Other targets than the STN have further been suggested for the specific treatment of FOG. The efficacy of DBS of the pedunculopontine nucleus (PPN) [17–21] and the substantia nigra (SN) [22–24], however, remains inconclusive. Moreover, cortical stimulation protocols such as repetitive transcranial magnetic stimulation over multiple targets have been introduced to treat FOG in PD [25].
The existence of different potential anatomical targets suggests that a broader network is involved in the treatment of FOG, which is in line with current network models on its pathology. Notably, FOG is commonly understood as a complex syndrome that goes beyond a pure motor perspective. Rather, a line of imaging studies shows that at least in some patients cognitive and even limbic circuitries may further play a critical role in the emergence of FOG. This multinetwork perspective matches phenomenological observations that FOG-triggering stimuli can be divided in either motor (e.g., turning), cognitive (e.g., multi-tasking), or limbic triggers (e.g., anxiety). Consequently, FOG is thought to result from dysfunctional signaling of either motor, cognitive or limbic input to the mesencephalic locomotor region, disturbing automated movements during gait [26–28]. This multinetwork perspective suggests that, on average, FOG may improve by modulating not only motor but also cognitive and potentially limbic pathways.
Following this notion, our study aimed to characterize a network that, if modulated by means of STN-DBS, results in alleviation of FOG. Firstly, we hypothesized that STN-DBS alleviates FOG through modulation of specific circuitries within the basal-ganglia, reflecting motor, cognitive, and limbic function. Secondly, we hypothesized that structural connectivity to the mesencephalic locomotor region is also part of this beneficial network.
MATERIALS AND METHODS
Patients
We screened PD patients from two DBS centers (University Hospital of Cologne and Hamburg). All patients underwent bilateral STN-DBS as per clinical routine. PD diagnosis was based on the UK Brain Bank criteria [29]. Initially, we screened 57 patients in the Cologne cohort and 34 patients in the Hamburg cohort with available Freezing of Gait Questionnaire (FOG-Q). We included 47 PD patients with sufficient image quality and preoperative FOG according to the FOG-Q Item 3 (“Do you feel that your feet get glued to the floor while walking, making a turn or when trying to initiate walking?”; answer ¬= never), as used for classification in earlier studies [26, 30]. We further excluded patients who answered “never happened” on Item 4 (“How long is your longest freezing episode?”; a flow chart is given in Supplementary Figure 1). FOG in all patients was considered “OFF-freezing”, since no patient worsened after levodopa intake, as assessed with Item 29 of the UPDRS-III during the preoperative levodopa challenge (43 patients improved, three scored with 1 before and after levodopa intake; in the UPDRS II item 14, these three patients scored lower in the ON-state and were thus also regarded with “OFF-freezing”). The study was carried out following the Declaration of Helsinki and approved by the institutional review board of the University of Cologne (Protocol-Number 20-1298).
Clinical outcomes
Clinical data were assessed preoperatively (approximately one week before surgery) and six months (±six weeks) after surgery. The primary outcome parameter was the difference from baseline to follow-up in the German version of the FOG-Q total score (n = 47) [30]. For further characterization of the sample, we included the occurrence and severity of FOG according to the Unified Parkinson Disease Rating Scale [31] (UPDRS)-II item 14 in both Med-ON (n = 45; missing data in two patients) and Med-OFF (n = 29) state (Med-OFF state was only available for the Cologne cohort).
To ensure validity of our results, we further analyzed a video-based assessment of FOG in the Hamburg cohort (n = 18). In these patients, FOG was assessed by an experienced rater from video-recordings of a standardized walking course, during which FOG was provoked by different levels of dual-tasking [32]. The video-based FOG was assessed preoperatively and six months postoperatively. Of note, at both time points, patients were recorded without regular dopaminergic medication in the OFF-state.
We further assessed the overall beneficial motor effect of DBS. As these therapeutic effects are reflected by both improvement of motor symptoms and reduction in required levodopa equivalent daily dose (LEDD) [33], we summarized these general DBS outcomes by z-transforming the reduction of the UPDRS part III (absolute difference between baseline and 6-months in Med-ON state) and the absolute change of dopaminergic medication (in mg) using the LEDD (n = 47). Thus, a higher score would indicate improvement in the UPDRS III and/or reduction in LEDD.
All clinical variables were tested for normal distribution using the Shapiro-Wilk method. For normally distributed data (p > 0.05), we used the respective parametric paired-t-test. If distribution of the data was non-normal (p < 0.05), we employed the non-parametric Wilcoxon signed-rank test to assess treatment effects of the cohort. Statistical dispersion is depicted with standard deviations (SD) or interquartile ranges (IQR). We used McNemar test to compare binary distributions of patients suffering from freezing (or non-freezing according to the UPDRS-II Item 14). For all statistical analysis, results were considered significant for p < 0.05. We used the Benjamini-Hochberg procedure to control the false discovery rate (FDR) at p < 0.05 if multiple comparisons were applied.
Imaging, electrode reconstruction, and stimulation modelling
All patients received routine preoperative MRI and postoperative CT-imaging (Cologne: 3T Philips Ingenia MRI system, Philips Medical Systems; Hamburg: 3T Siemens Healthineers Skyra MRI Scanner; 3T Philips Ingenia MRI system). Electrode localization of four patients was reconstructed through intraoperative stereotactic x-ray coordinates in the Cologne cohort, since postoperative CT images were not obtained. The quality of pre-operative MRI, post-operative CT images, as well as co-registration and normalization were visually inspected by experienced DBS clinicians (TD, JCB, HJ). DBS leads were localized using the Lead-DBS software [34]. Briefly, preoperative MR and postoperative CT images were first co-registered linearly and then normalized non-linearly into the MNI ICBM 2009b NLIN ASYM template space using advanced normalization tools. Co-registrations, as well as normalizations were visually inspected for accuracy and refined if needed. An additional subcortical refinement step was added to correct for any brain shift caused by surgery. All DBS leads were pre-reconstructed using the PaCer method and manually refined if needed [35]. To determine anatomically accurate positioning of the directional electrodes, we used the sequential DiODe-algorithm to correct the lead orientation [36] (see Supplementary Figure 2 for electrode reconstructions).
Stimulation volumes were estimated using the FastField approach as implemented in Lead-DBS [37]. Each patient’s volume of tissue activated (VTA) was first calculated in native and then transformed into MNI space based on the individual nonlinear normalization. The spread of electric fields within tissue was estimated with a homogenous conductivity of o’ = 0.1 S/m. The VTA threshold was chosen at the electrical field isolevel of 0.2 V/mm.
Connectivity analysis
Firstly, we aimed to calculate a structural connectivity profile associated with improvement of FOG. To this end, we employed an openly available atlas of anatomically predefined basal-ganglia pathways and subdivisions of the internal capsule (BG-IC connectome) [38]. By overlapping the stimulation volume (VTA) of each patient with fibers of the BG-IC connectome, we determined fibers that were connected, or unconnected. Fibers that were connected to a minimum of 20% of the cohort’s VTAs (n > 10) were used for further analysis to control for outliers (Fig. 1A). For each fiber, we then fitted a linear mixed effects model using the clinical outcome parameter as variable of interest, the grouping variable (connected or unconnected VTA) as fixed factor and the amplitude per patient as random effect (Fig. 1B). This step was repeated for each fiber, resulting in a “fiber value” corresponding to the effect size (t-value) of the respective fiber (Fig. 1C). In this scenario, a higher t-value means that VTAs that were connected to the respective fiber showed a higher reduction in FOG postoperatively than patients that were not connected. We then selected fibers that contained a significant effect (p < 0.05), resulting in a connectivity profile, which signifies the relationship between stimulation of the identified fibers and changes in FOG. Fibers that resulted in significance values smaller than the threshold were discarded from the model (Fig. 1D).
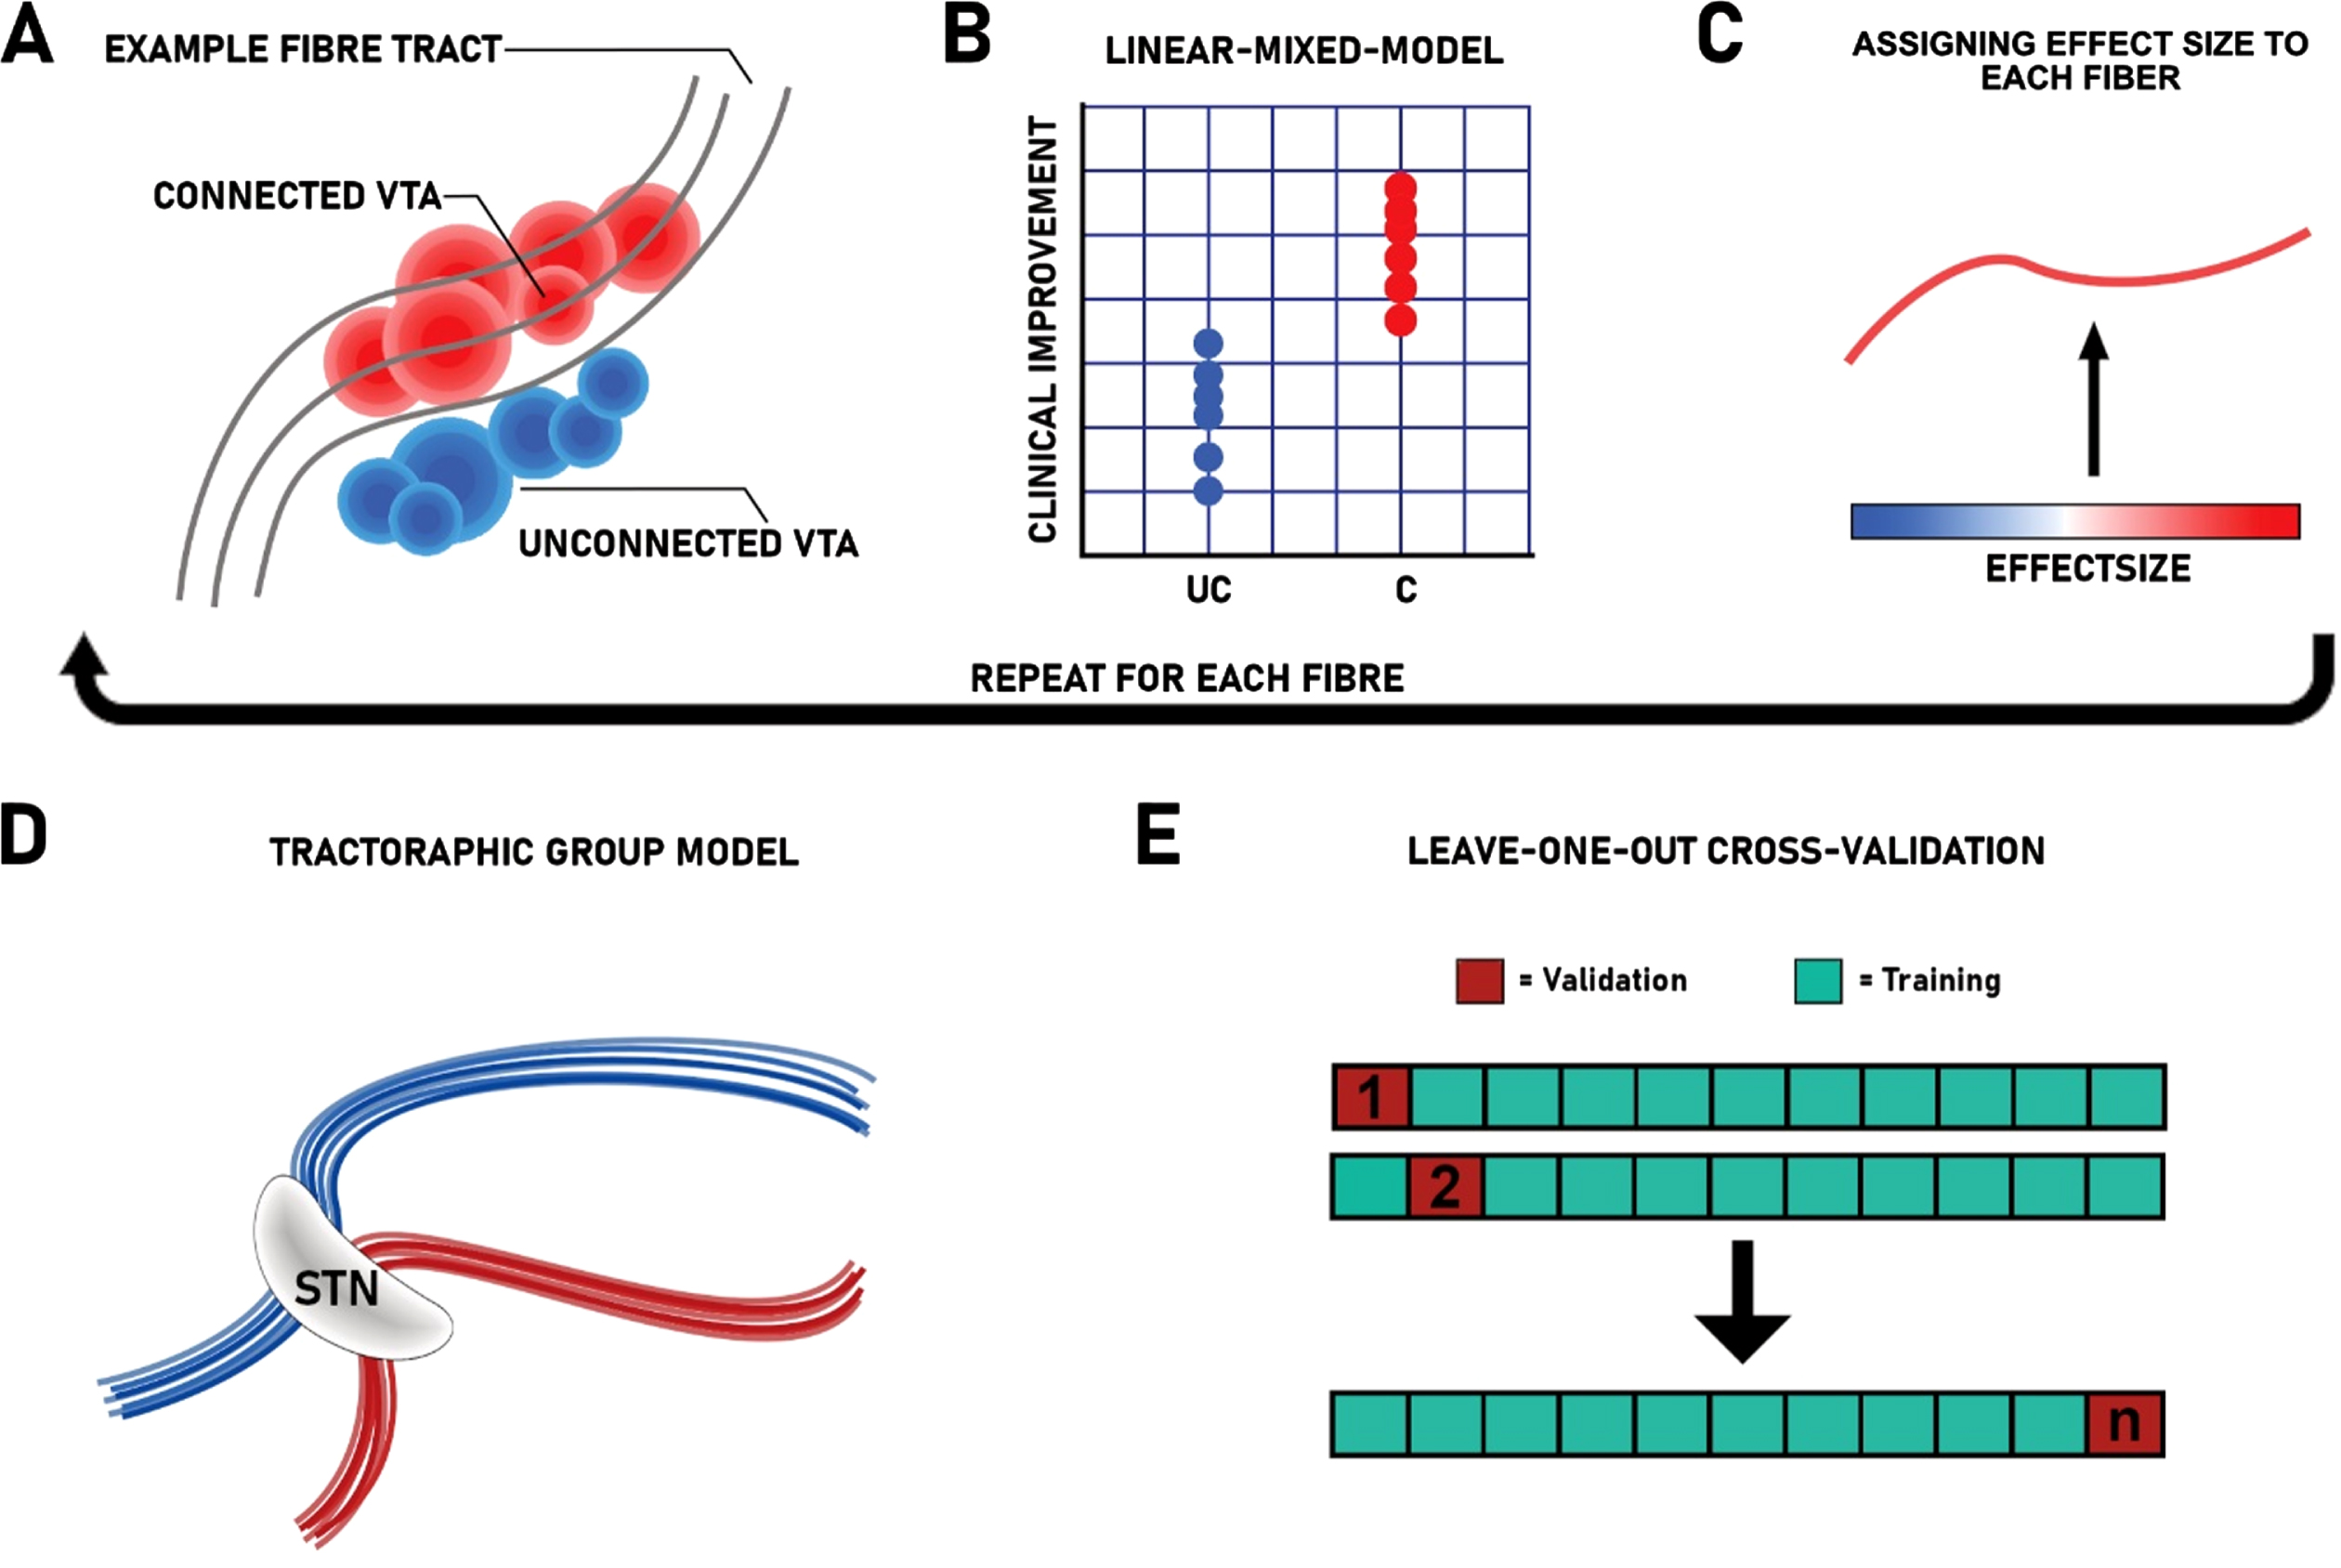
Overview of applied methods. A) All fiber tracts modulated by stimulation across the whole group were extracted from the BG-IC connectome. Each fiber that traverses patient specific VTAs is correlated with the patient’s individual connection status (UC, unconnected; C, connected) and the respective empirical outcome. B) Linear-mixed-model between individual connection status and the patient specific outcome, using the stimulation amplitude as covariate. C) Each fiber is colored by its respective effect size (ranging from blue = negative associations to red = positive associations). D) The resulting connectivity profile from the connectivity estimation. E) Leave-one-out cross-validation using n-1 as training dataset to predict DBS outcome of the left outpatient from the connectomic training model.
To verify the resulting model, we conducted a leave-one-out cross-validation (Fig. 1E). For this, we repeatedly calculated the connectivity profile (training model), each time leaving one patient out. Each left-out patient’s VTA is then compared to the resulting training model. By averaging the effect sizes assigned to each modulated fiber, we obtained an overall fiber score that indicates to what extent the VTA of the left-out patient stimulated the training model. In this analysis, stimulation of fibers with positive effect sizes results in high “fiber scores” and vice-versa. We then compared the fiber scores of the left-out patients with the empirical outcome using Spearman’s correlation.
As primary analysis, the connectivity analysis was performed using the primary outcome parameter, the reduction the FOG-Q. As a further validation step, we performed the same analysis in a subset of patients (n = 18) in which the video-based assessment of FOG without dopaminergic medication was available. To further contrast the obtained model against connectivity associated with the overall motor outcome after DBS, we ran a secondary analysis using the combined z-transformed reduction in the UPDRS-III (Med-ON) and LEDD, as described in the clinical outcomes section.
Lastly, to test whether improvement in the FOG-Q is exclusively caused by the observation of the connectivity analysis, or if other confounders may affect the result, we conducted a stepwise linear multiple regression. In this analysis, we included age, disease duration, stimulation amplitude, sex, UPDRS-IIIBaseline, LEDDBaseline and changes in UPDRS and LEDD, preoperative levodopa response, as well as fiber scores from the leave-one-out-cross validation as candidate predictor variables for our primary outcome, the change in the FOG-Q, which is used as dependent variable in this analysis. Statistical analyses were performed in SPSS (Version 25, SPSS IBM, NY, USA).
Region-of-Interest analysis
To test whether connectivity of stimulation sites to mesencephalic locomotor regions were further associated with improvement of FOG, we performed a region of interest (ROI) analysis to a priori defined areas. For this, we employed an additional connectome, as connectivity to the brainstem has not been modelled in the BG-IC connectome. Instead, we used a whole-brain patient-specific group connectome derived from high-resolution dMRI in 90 patients from the Parkinson Progression Marker Initiative (PPMI) [39] that has previously been used to study effects of STN-DBS in PD [40]. Additionally, we employed an anatomical atlas that focusses on brainstem nuclei based on histology-guided tractography findings [41] to determine connectivity of the patient’s stimulation sites to mesencephalic locomotor nuclei. We chose nuclei, which have been proposed as alternative DBS targets for FOG, i.e., the PPN and SN [20, 24] as ROIs. For each patient, we filtered fibers from the whole brain connectome that travelled through both the VTA and the PPN or SN, respectively. This resulted in a number of activated fibers connected with the respective ROI. Congruent to the primary connectivity analysis, we controlled for the fact that larger VTAs encompass more fibers, by dividing the number of fibers by the respective stimulation amplitude per hemisphere. Subsequently, we correlated the number of activated fibers per amplitude with the reduction in the FOQ-Q using Spearman’s correlation. Again, to contrast against the overall outcome, the same analysis was conducted with the general DBS outcome. All correlation p-values were FDR corrected for multiple comparisons.
RESULTS
Patients and clinical outcomes
We included 47 patients from two DBS centers in this analysis. Baseline FOG-Q total score was 13.7 (SD = 4.3) and significantly decreased six months postoperatively by 47.0%, to 7.2 points (n = 47; SD = 5.3; T = 7.6; p < 0.001; Fig. 2A). All FOG-Q items were significantly reduced with STN-DBS (gait difficulty: Z = –3.2; p FDR = 0.001; impairment: Z = –3.9; p FDR < 0.001; frequency of freezing: Z = –4.9; p FDR < 0.001; duration of freezing episodes: Z = –4.8; p FDR < 0.001: duration of start hesitation: Z = –4.7; p FDR < 0.001; duration of turning hesitation: Z = –4.1; p FDR < 0.001; Fig. 2B). Consistently, the percentage of patients suffering from freezing in the Med-OFF state was reduced from 79.3% to 24.1% (n = 29; p < 0.001) according to UPDRS-II Item 14 (Fig. 2C). Likewise, the percentage of patients suffering from freezing in the Med-ON state dropped from 69.6% at baseline to 26.7% at six months follow up (two missing data points, n = 45; p < 0.001; Fig. 2D). FOG improved from baseline to six months follow-up in the Hamburg cohort as assessed with the video-based assessment, however not statistically significant (n = 18; Z = –1.4; p = 0.155). Average LEDD at baseline was 1032.7±422.0 mg and was significantly reduced after six months by 35.0% (n = 47; Z = –4.9; p < 0.001). Baseline UPDRS-III score in Med-ON was 14.0±5.4 without significant improvement after six months across the whole cohort (n = 47; Z = –0.2; p = 0.961; Table 1). However, baseline UPDRS-III score in Med-OFF was significantly reduced from 32.6±8.9 to 23.7±10.6 after six months in the Hamburg cohort (n = 18; T = 2.9; p = 0.01) and UPDRS-III score in Med-ON condition significantly reduced in the cologne cohort (n = 19; Z = –2.0; p = 0.04). There was no significant difference in LEDD reduction between cohorts (Z = –0,877; p = 0.380), while UPDRS-III reduction in Med-ON was significantly larger in the Cologne cohort (Z = –2.683; p = 0.007). Additionally, electrode localization across cohorts significantly differed in the z-axis (Supplementary Figure 2). However, given that both cohorts were able to significantly reduce dopaminergic medication, and the UPDRS-III was reduced in the Med-ON condition for the cologne cohort and in the Med-OFF condition in the Hamburg cohort, we consider that on average, patients profited from the intervention regarding the general DBS outcome.
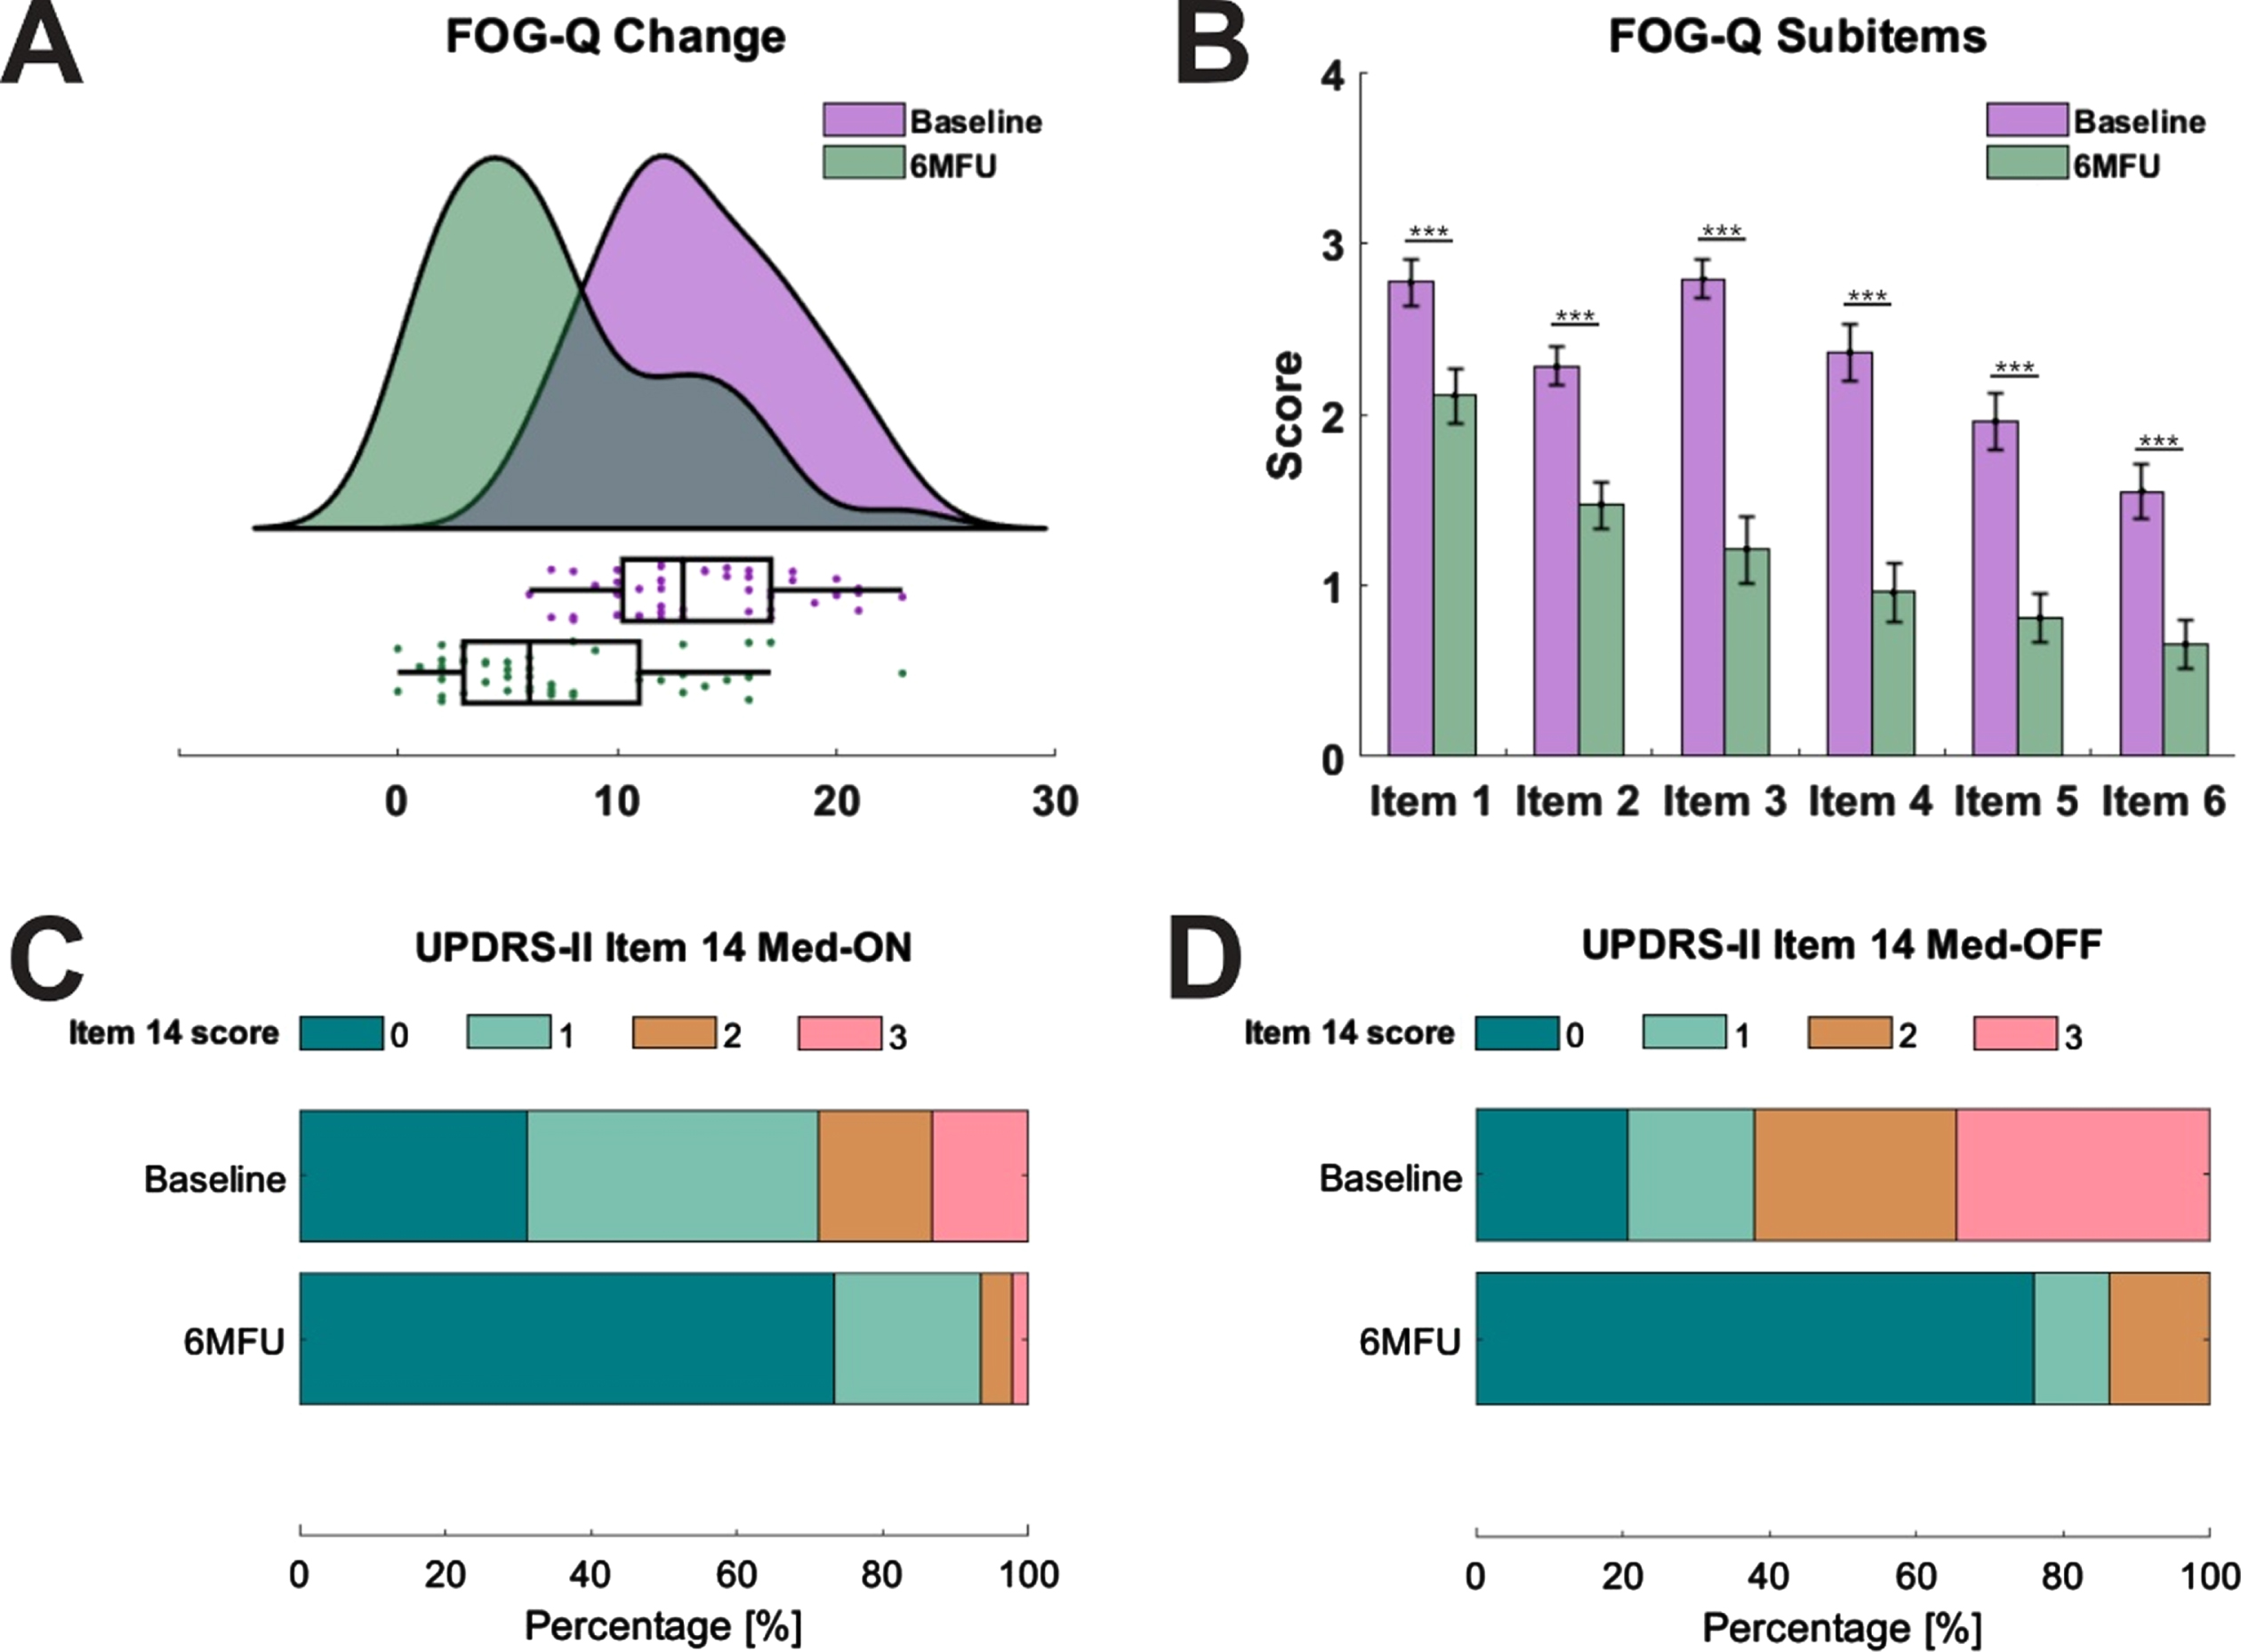
Changes in freezing of gait severity after subthalamic nucleus deep brain stimulation. A) Displays freezing of gait severity at baseline (green) and six months follow-up (6MFU; purple) as assessed with the Freezing of Gait Questionnaire (FOG-Q; n = 47). Raincloud plots illustrate data distribution (curves) and raw data (dots) with boxplots. B) Shows the mean values of all subitems of the FOG-Q with standard errors. Item scores range from 0 to 4 (n = 47). All subitems were significantly reduced (Item 1: gait difficulty; item 2: impairment; item 3: frequency of freezing; item 4: duration of freezing episodes; item 5: duration of start hesitation; item 6: duration of turning hesitation). C) Displays distributions of freezing prevalence according to the Unified Parkinson’s Disease Rating Scale (UPDRS)-II Item 14 in Med-ON (n = 45) and D) Med-OFF state (n = 29). Contribution of patients at baseline and at postoperative assessment is given in percentage, with 0 indicating no freezing and 3 indicating regular freezing (*p < 0.05, **p < 0.01, ***p < 0.001).
Demographics and clinical outcomes. All data are expressed as mean (±SD)
y, years; 6MFU, 6 months follow up.
Connectivity associated with improvement of freezing of gait
Firstly, we calculated a connectivity profile associated with the overall change in the FOG-Q across the whole sample (n = 47) using the BG-IC connectome. Within this model, clinical improvement of FOG was correlated with connectivity from the stimulated tissue to the dorsolateral prefrontal cortex (dlPFC), the premotor cortices (including the premotor and supplementary motor area) and the motor cortex (including the face, neck, upper and lower extremities of the primary motor area) via a hyperdirect pathway (Fig. 3A, B). Additionally, connectivity from stimulation sites to the globus pallidus internus (GPi) via the pallidosubthalamic tract correlated with improvement of FOG (Fig. 3C). Thus, if stimulation sites overlapped with these cortical and pallidal connections, patients showed improvement of FOG severity. Strikingly, worsening of FOG was exclusively associated with stimulation of the right lenticular fasciculus, a pallidothalamic tract that traverses superior to the associative portion of the STN (Fig. 3C). A leave-one-out cross-validation resulted in a significant value (r = 0.232; p = 0.048) of this connectivity profile (Fig. 3D).
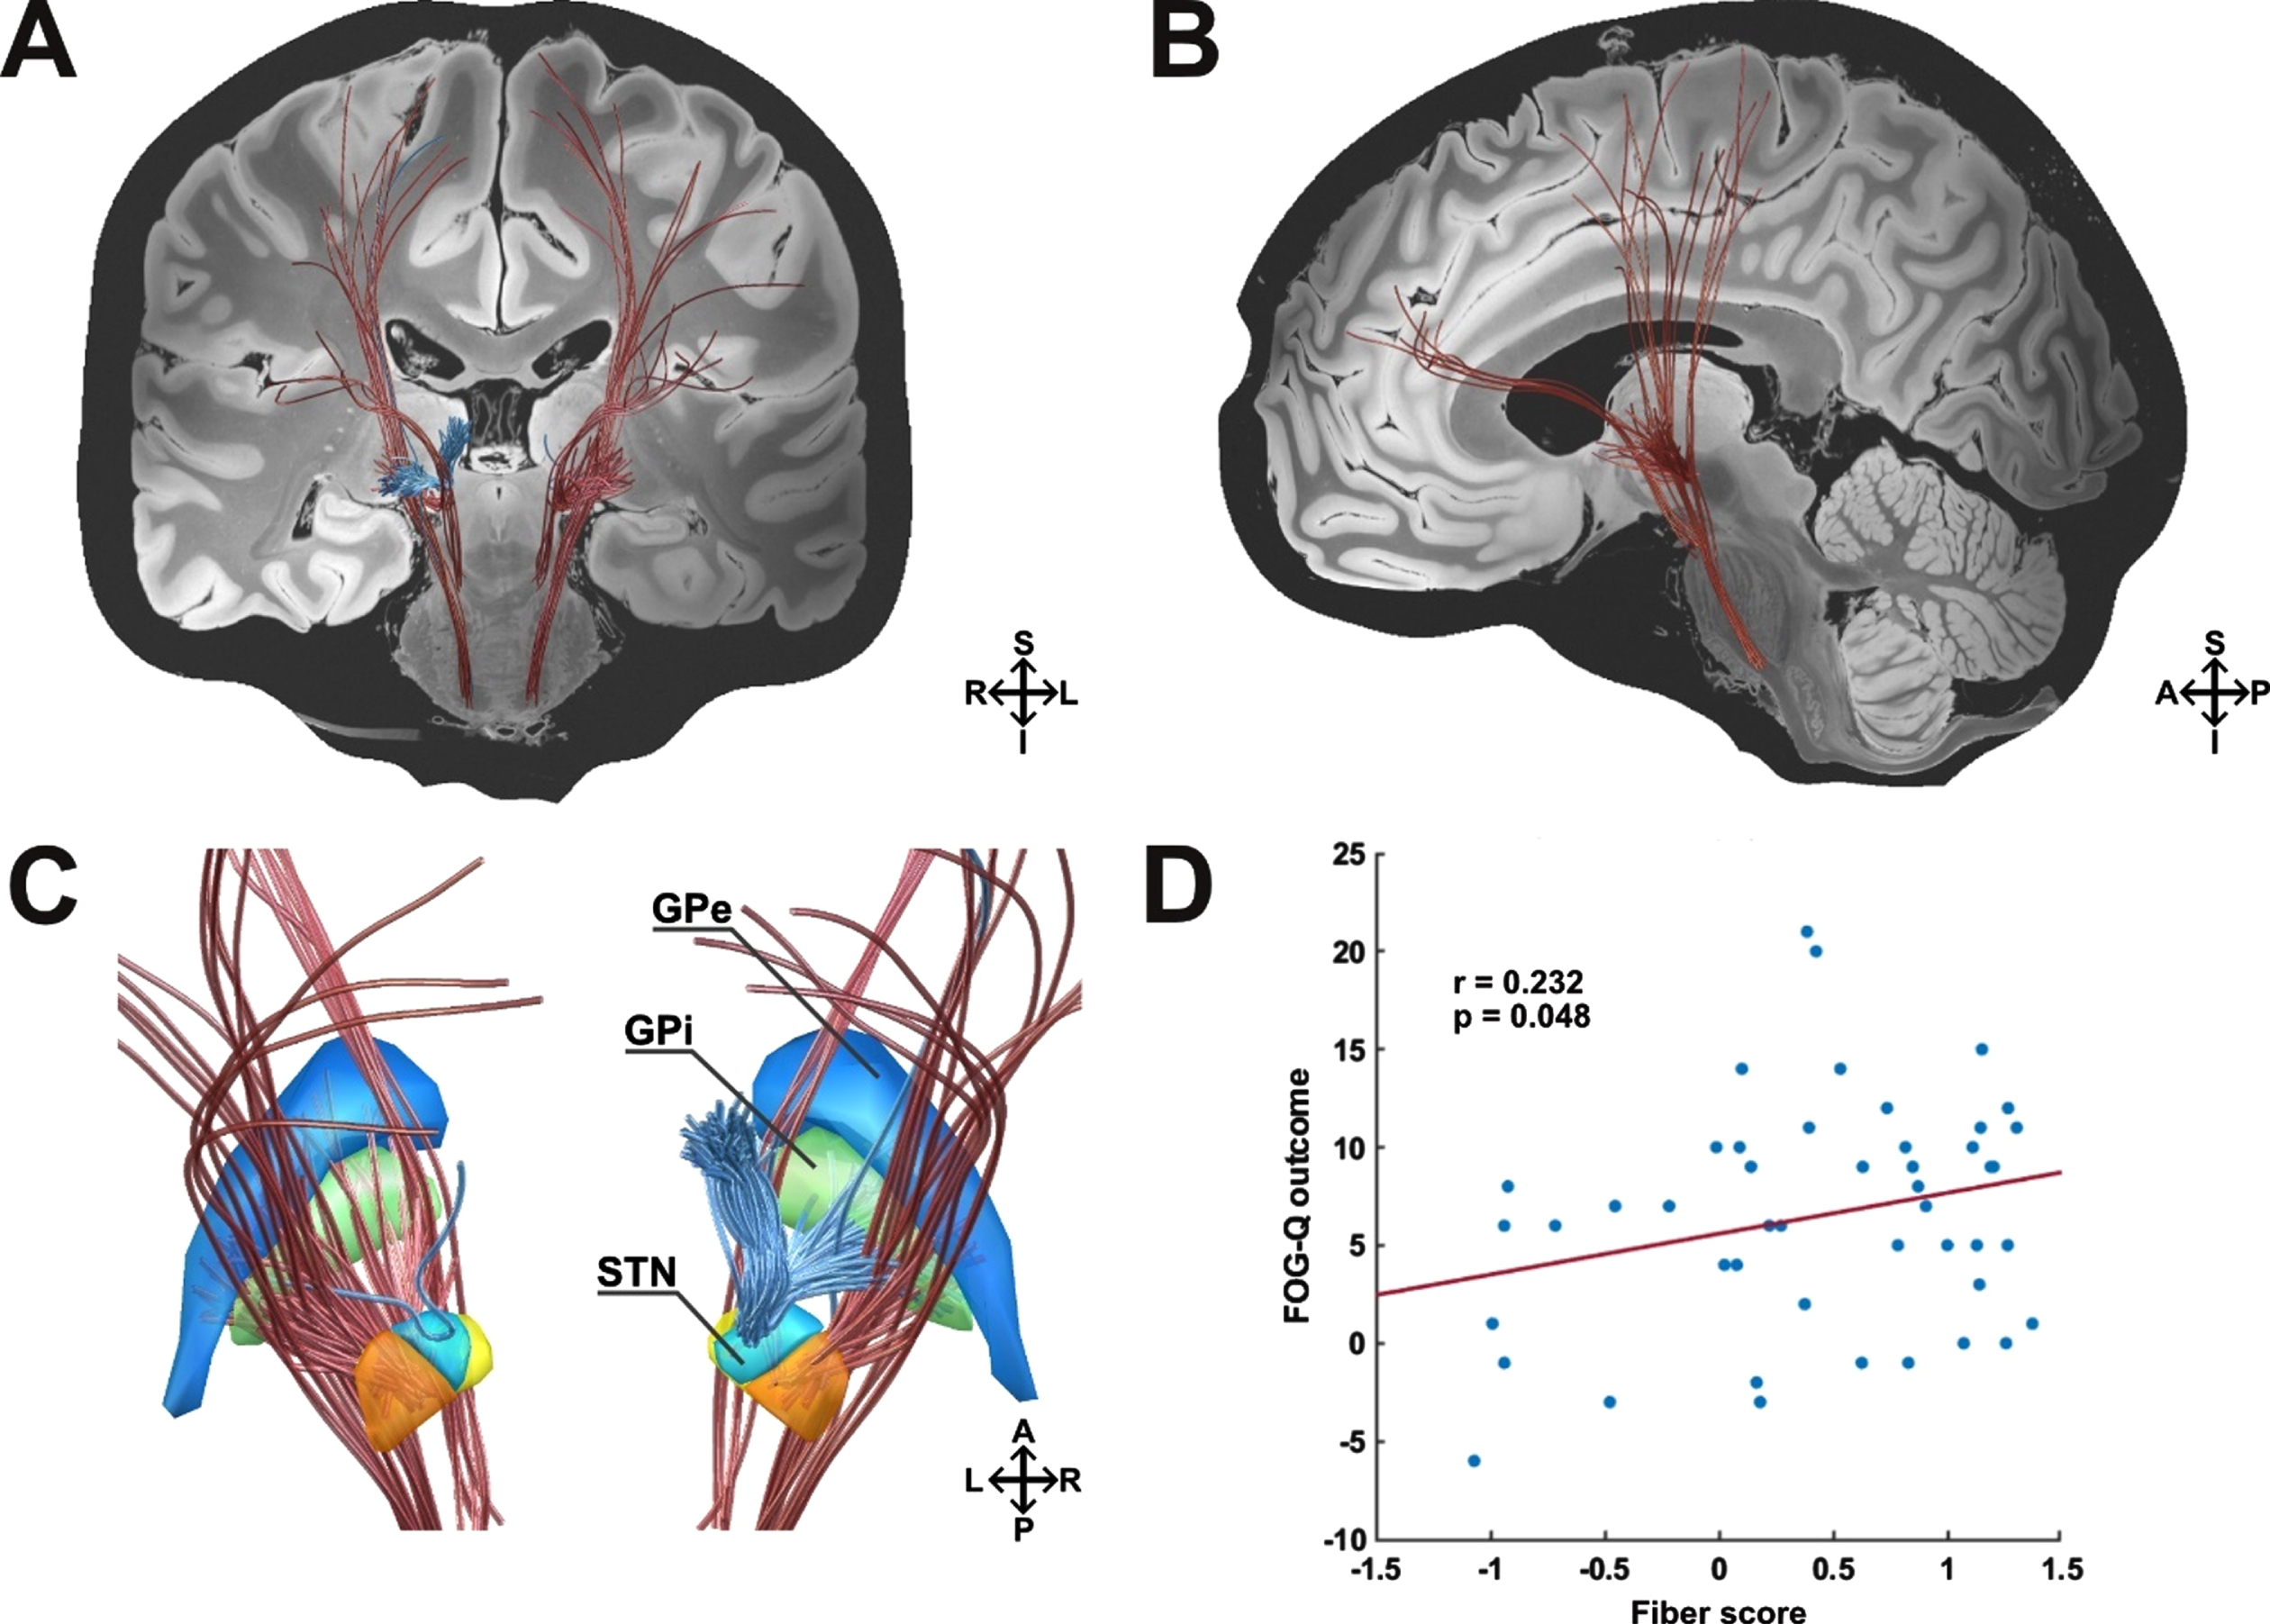
Pathways associated with stimulation induced changes of FOG according to the FOG-Q. A) Coronal view. Improvement in the FOG-Q was correlated with connectivity from the stimulated tissue to the dorsolateral prefrontal, premotor and motor cortex via a hyperdirect pathway. Additionally, connectivity from stimulation sites to the globus pallidus internus via the pallidosubthalamic tract correlated with clinical improvement. Stimulation of the right hemispherical lenticular fasciculus, traversing superior to the STN, was associated with clinical worsening of FOG. B) Sagittal view. Left hemisphere. C) Detailed view on basal-ganglia structures from a posterior view. D) Results from this analysis were validated in a leave-one-patient-out design (n = 47). Blue, Globus pallidus externus (GPe); green, Globus pallidus internus (GPi); orange, Subthalamic nucleus (STN) motor portion; yellow, STN limbic portion; light blue, STN associative portion; red fibers, positive outcome; blue fibers, negative outcome; S, superior; I, inferior; A, anterior, p, posterior; R, right hemisphere; L, left hemisphere.
Secondly, we recalculated the connectivity profile associated with the change in the FOG outcome in a subsample of patients who underwent a video-based FOG analysis (n = 18). Overall, this resulted in a model of optimal connectivity that was similar to the analysis based on the FOG-Q. Within this model, clinical improvement of FOG was again correlated with connectivity from the stimulated tissue to the premotor cortices (including the premotor and supplementary motor area) and the motor cortex (including the face, neck, upper and lower extremities of the primary motor area) via a hyperdirect pathway (Fig. 4A, B). Further, connectivity to the right anterior cingulate cortex (ACC) was associated with improvement of FOG. Additionally, connectivity from stimulation sites to the GPi via the pallidosubthalamic tract correlated with clinical improvement (Fig. 4C). Strikingly, in this analysis, worsening of FOG was again associated with stimulation of the right lenticular fasciculus (Fig. 4C) and single fibers to the right premotor cortex. A leave-one-out cross-validation of this optimal connectivity model for FOG improvement resulted in a significant value (r = 0.542; p = 0.007) (Fig. 4D).
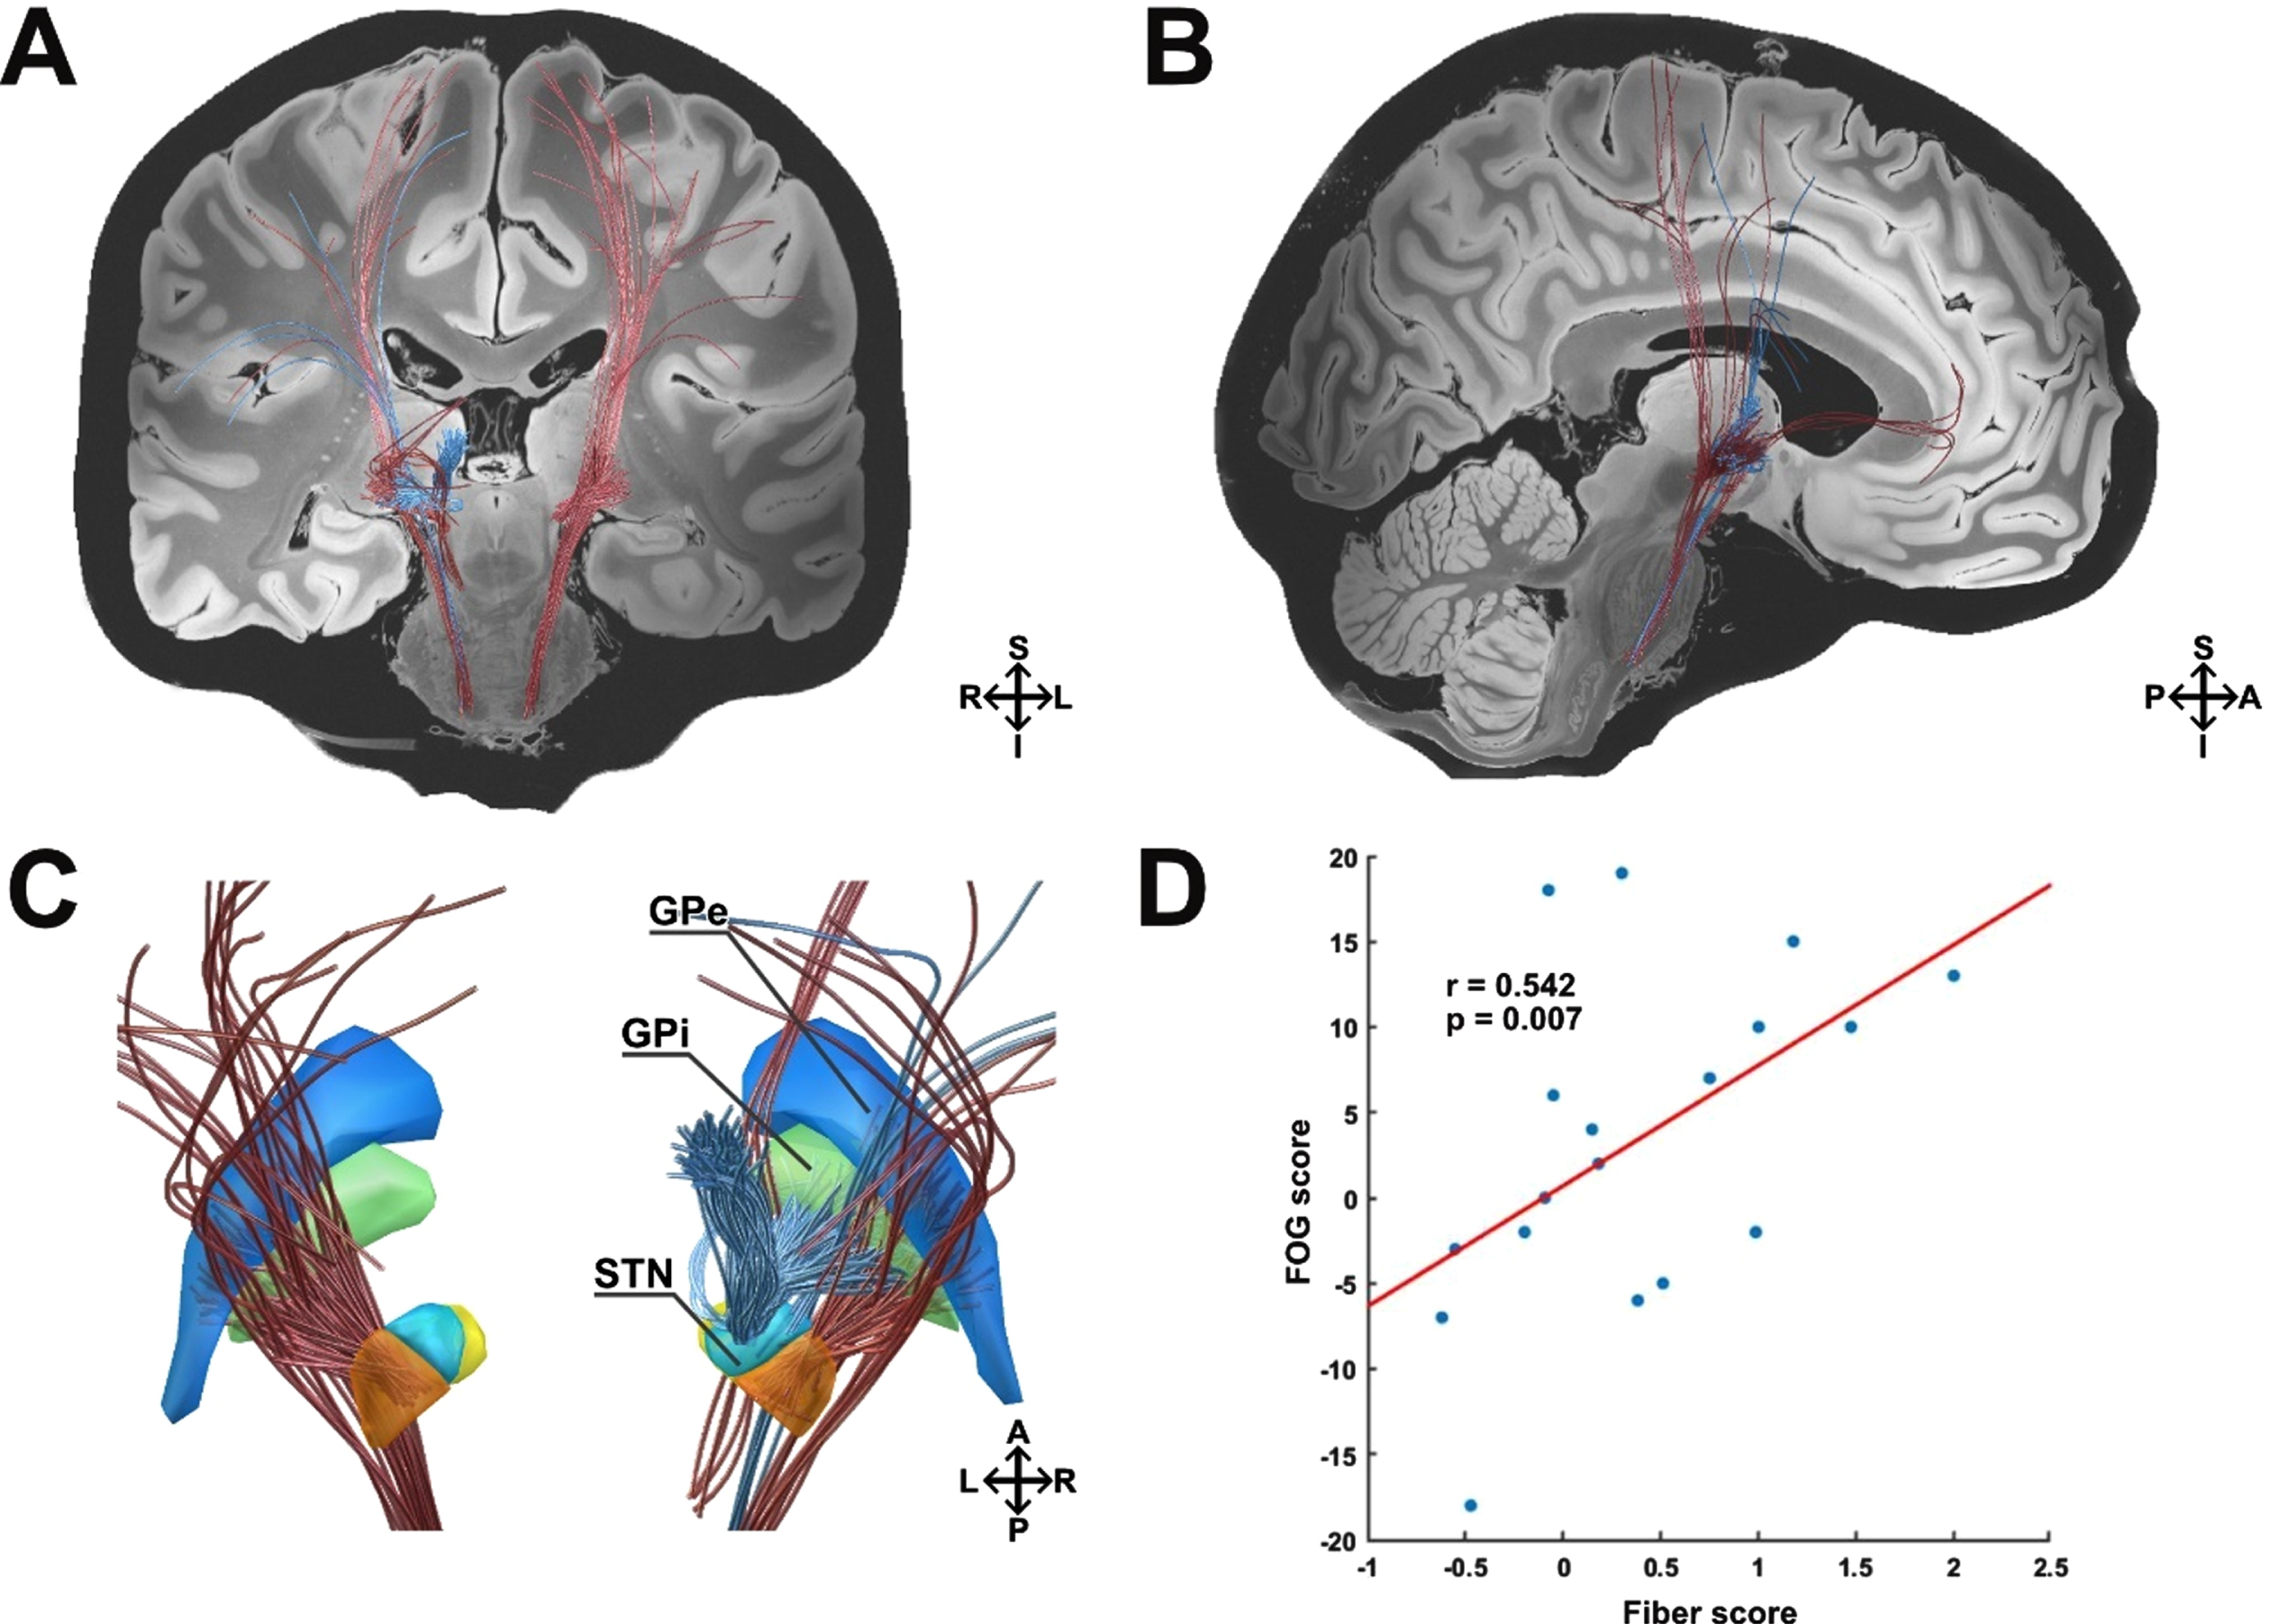
Pathways associated with stimulation induced changes of FOG according to the video-based Ziegler course. A) Coronal view. Improvement in the Ziegler course was correlated with connectivity from the stimulated tissue to the right anterior cingulate, premotor, and motor cortex via a hyperdirect pathway. Additionally, connectivity from stimulation sites to the globus pallidus internus correlated with clinical improvement. Stimulation of the right hemispherical lenticular fasciculus was again associated with clinical worsening of FOG. B) Sagittal view. Right hemisphere. C) Detailed view on basal-ganglia structures from a posterior view. D) Results from this analysis were validated in a leave-one-patient-out design (n = 18). Blue, Globus pallidus externus (GPe); green, Globus pallidus internus (GPi); orange, Subthalamic nucleus (STN) motor portion; yellow, STN limbic portion; light blue, STN associative portion; red fibers, positive outcome; blue fibers, negative outcome; S, superior; I, inferior; A, anterior, p, posterior; R, right hemisphere; L, left hemisphere.
Contrasting changes in freezing of gait with overall DBS outcome
To test whether the identified model is specifically associated with FOG outcome and how it relates to the general DBS outcome, we included the general DBS outcome in the connectomic analysis. The connectivity profile associated with general DBS outcome was dominant in the left hemisphere. Within the model, improvement of the general DBS outcome was correlated with connectivity from the stimulated tissue to the premotor cortices (including the premotor and supplementary motor area) and the motor cortex (including the face, neck, upper and lower extremities of the primary motor area) via a hyperdirect pathway. Interestingly, stimulation of fibers from the hyperdirect dlPFC pathway and the globus pallidus internus also correlated with improvement of the general DBS outcome (Fig. 5A, B). As seen before, stimulation of the lenticular fasciculus was associated with worsening of the general DBS outcome, however bilaterally (Fig. 5C). The connectivity profile was robust to a leave-one-out cross-validation (r = 0.239; p = 0.041; Fig. 5D).
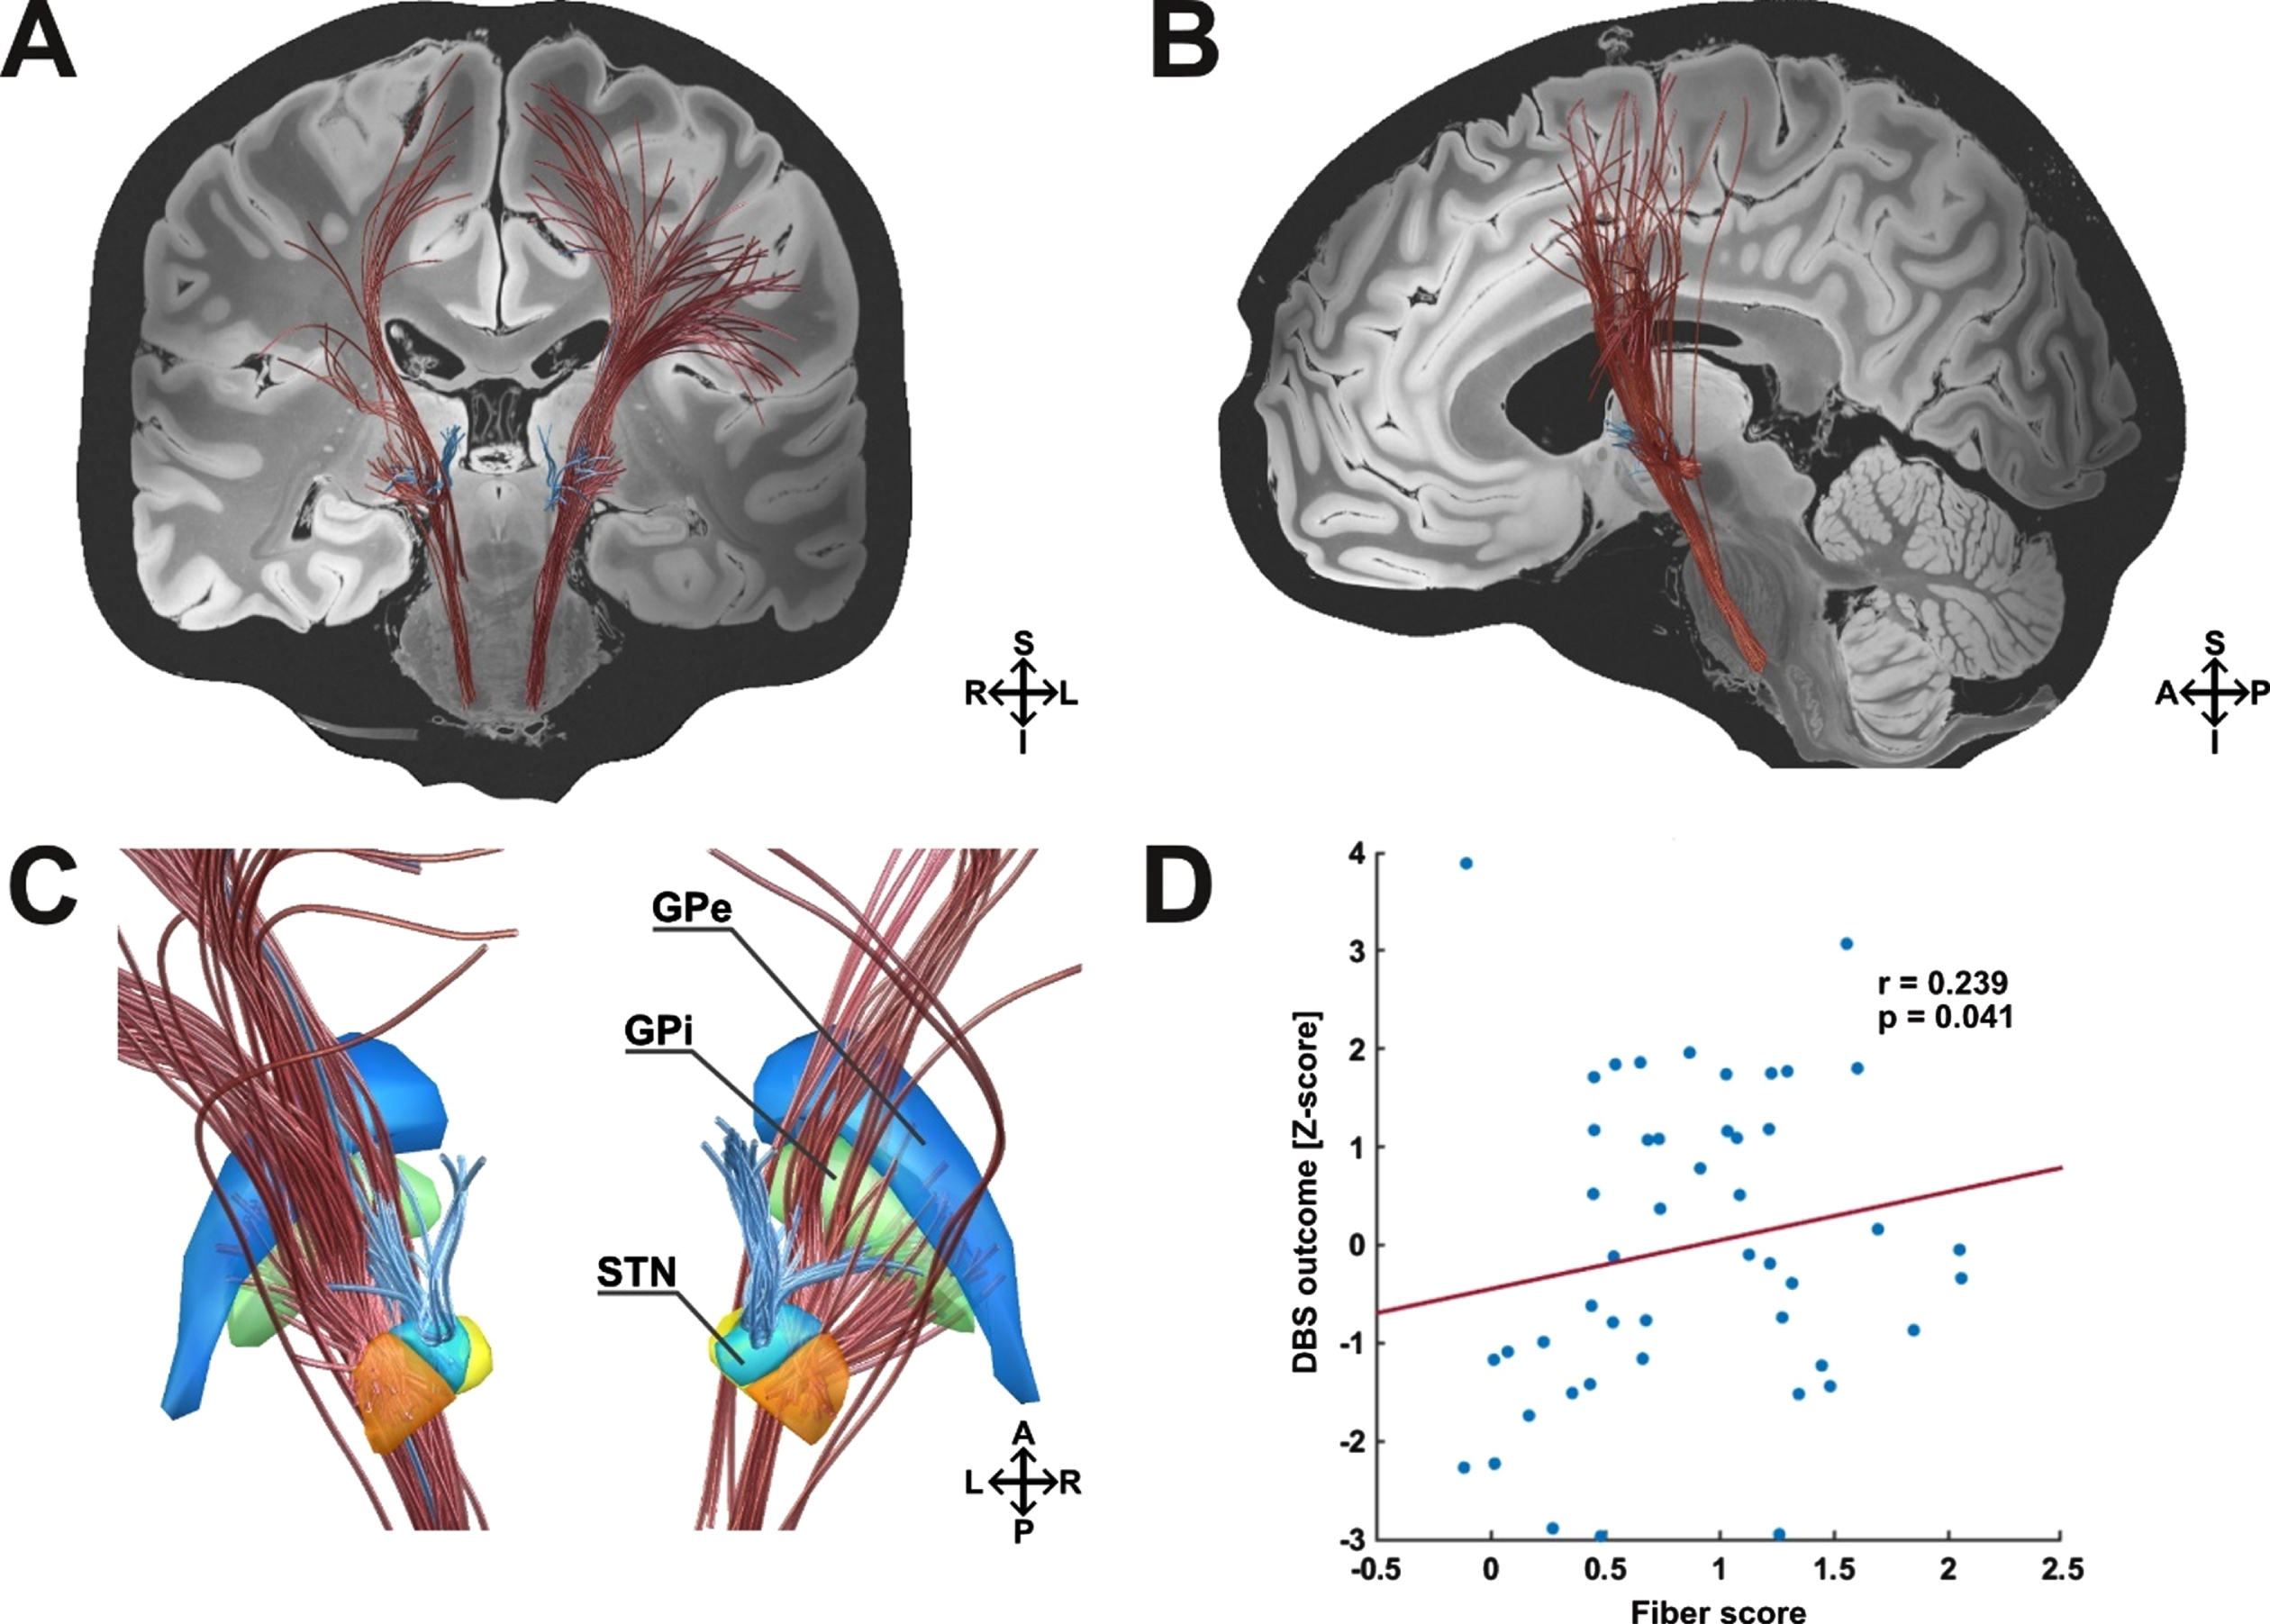
Pathways associated with stimulation induced changes in general DBS outcome (reduction in the UPDRS-III and reduction in LEDD). A) Coronal view. Modulated cortical projections of the M1 and premotor hyperdirect pathway bilaterally, as well as the left hemispheric hyperdirect dlPFC pathway were associated with general DBS improvement. Subcortically, modulated fibers of the pallidosubthalamic pathway were associated with improvement of the general DBS outcome. Strikingly, stimulation of the lenticular fasciculus, traversing superior to the STN, was associated with clinical worsening, bilaterally. B) Sagittal view. Left hemisphere. C) Detailed view on basal-ganglia structures from a posterior view. D) Results from this analysis were validated in a leave-one-patient-out design (n = 47). Blue, Globus pallidus externus (GPe); green, Globus pallidus internus (GPi); orange, Subthalamic nucleus (STN) motor portion; yellow, STN limbic portion; light blue, STN associative portion; red fibers, positive outcome; blue fibers, negative outcome; S, superior; I, inferior; A, anterior, p, posterior; R, right hemisphere; L, left hemisphere.
Circuit-specific outcome analysis
Interestingly, the topography of the resulting connectivity profiles of FOG and the general DBS outcome were partly overlapping. The ratio of stimulated pathways, however, differed. While the connectivity profile associated with general DBS outcome involved high ratios of premotor and motor connections within the overall model, fiber tracts associated with FOG outcome were more pronouncedly associated to connections to the prefrontal cortices (dlPFC and ACC). In a post-hoc analysis, we wanted to assess whether stimulation of motor/premotor vs. prefrontal fibers could be attributed to either the general DBS outcome, or FOG improvement, or both.
To this end, we calculated the overlap of each patient’s VTA with connections to the motor/premotor cortex and separately to the dlPFC/ACC. Again, we controlled for the fact that larger VTAs encompass more fibers, by dividing the number of fibers by the respective stimulation amplitude. Finally, we compared the number of activated fibers with the reduction in the FOQ-Q, as well as with the general DBS outcome using Spearman’s correlation. All correlation p-values were FDR corrected for multiple comparisons.
Interestingly, the overlap between patient’s specific VTAs and the hypedirect dlPFC/ACC pathway, as well as overlap with the hyperdirect premotor and motor pathway were both significantly correlated with the postoperative improvement of FOG (r = 0.378, pFDR = 0.022; r = 0.321, pFDR = 0.037; Fig. 6A, C). In contrast, postoperative improvement of the general DBS outcome was only associated with stimulation of the premotor/motor pathway (r = 0.366, pFDR = 0.022; Fig. 6D), whereas overlap with the dlPFC/ACC pathway did not result in a significant relationship (r = 0.187, pFDR = 0.209; Fig. 6B).
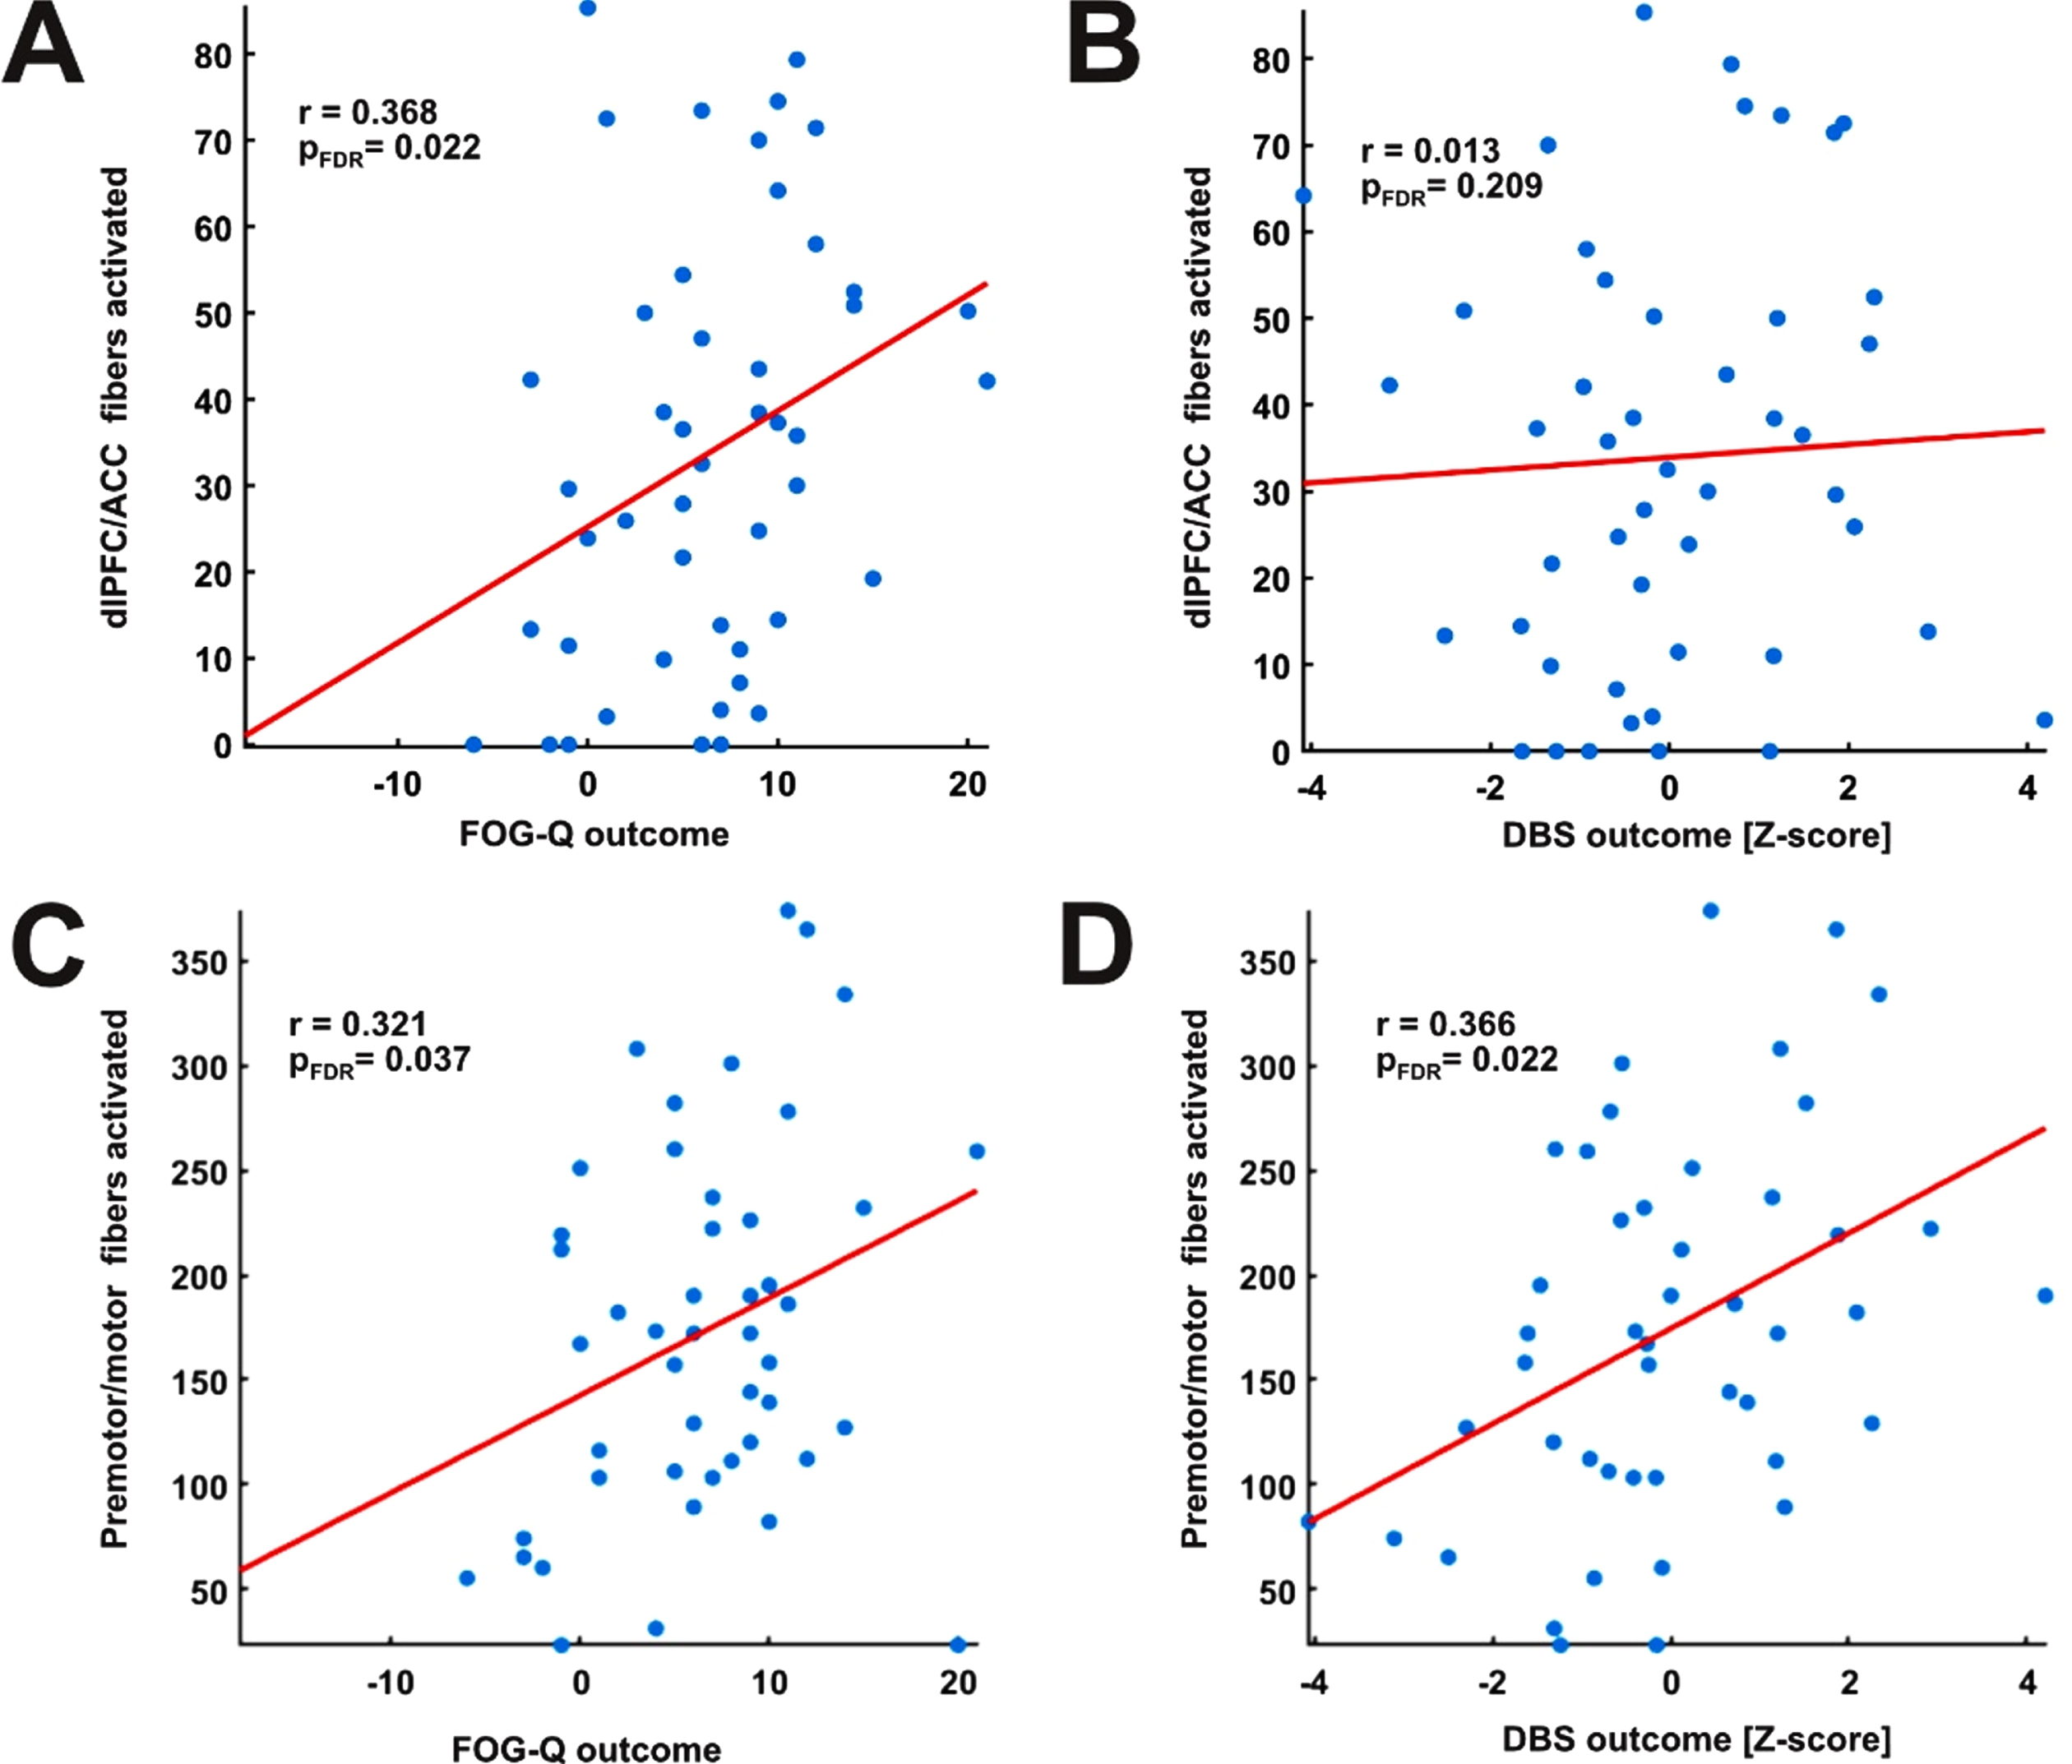
Circuit-specific outcome analysis. A) Correlation between activated fibers of the dlPFC/ACC and postoperative improvement of FOG resulted in a significant association (n = 47). B) Correlation between activated fibers of the dlPFC/ACC and postoperative improvement in the general DBS outcome was not significant (n = 47). C) Correlation between activated fibers to the motor and premotor cortex and postoperative improvement of FOG resulted in a significant value (n = 47), while (D) no significant association was found with the general DBS outcome (n = 47). All analysis were performed using Spearman’s correlation. Fiber values were corrected for the stimulation amplitude per hemisphere. All correlation p-values were FDR corrected for multiple comparisons.
Potential clinical and demographic treatment predictors
To test the validity of the connectivity model as treatment predictor for the entire sample with regard to other potential contributing factors, we performed a stepwise linear multiple regression analysis including potential clinical and demographic predictor variables (i.e., age, disease duration, stimulation amplitude, sex, UPDRS-IIIBaseline, LEDDBaseline, reduction in UPDRS-III and LEDD and preoperative levodopa response). Here, only fiber values from the leave-one-out cross-validation of the connectivity profile remained as significant predictor variable for postoperative changes in the FOG-Q (β= 2.652, p = 0.041), accounting for 9.5% of variance (R2 = 0.095).
ROI-analysis of mesencephalic locomotor regions
The prior analysis investigated connectivity from the stimulated tissue to cortical and subcortical areas within the basal-ganglia circuit. To investigate connectivity to the mesencephalic locomotor regions we employed a subcortical connectomic analysis using the PPMI connectome. In this region-of-interest analysis, we calculated the overlap from patient’s individual VTAs to the PPN and SN as defined a priori. This analysis revealed that connectivity of patients individual VTAs with both the PPN (r = 0.330; pFDR = 0.044) and the SN (r = 0.289; pFDR = 0.049) correlated with reduction in the FOG-Q. In contrast, the general DBS outcome did not show such a relationship for the PPN (r = 0.194; pFDR = 0.393), nor the SN (r = 0.129; pFDR = 0.393).
DISCUSSION
In this study, we analyzed a combined dataset from two independent cohorts who underwent DBS of the STN for PD to investigate, how FOG severity develops postoperatively and whether modulation of specific basal-ganglia circuitries explains postoperative changes in FOG. Overall, FOG severity and prevalence were significantly decreased postoperatively, matching the results of recent clinical trials on STN-DBS [12, 42]. As hypothesized, we could identify a specific connectivity profile that was predictive of postoperative changes. This network comprised the basal-ganglia motor circuit involving fibers encompassing the premotor and motor cortices through a hyperdirect pathway, but fibers that attributed to a cognitive circuit, encompassing the dorsolateral prefrontal cortex and the anterior cingulate cortex, were also part of this beneficial network. Additionally, we could identify a significant relationship of structural connectivity from stimulation sites to mesencephalic locomotor areas.
The management of FOG in clinical practice is a major challenge for clinicians. Although clinical studies suggest that DBS is effective for improving FOG, there is still uncertainty about the mechanisms that would help to achieve optimal results. Our finings suggest that the connectivity of stimulation volumes might be critical to the question whether FOG improves or worsens postoperatively. Indeed, overlap to the identified optimal connectivity pattern was the only robust predictor when including clinical and demographic variables. Yet, the observed effect sizes in the cross-validation procedure were small, especially regarding the questionnaire-based outcome measurement. Of note, the analysis of a video-based assessment of FOG without medication, revealed much higher effect sizes. This analysis was limited to a subset of patients (n = 18) and one has to keep in mind that small sample sizes may overestimate effect sizes [43]. However, other studies also observed that task-based outcome measurements may be more reliable than questionnaire-based assessments when mapping clinical effects of DBS, e.g., impulsivity [44]. There are certainly both advantages and disadvantages of questionnaires when assessing FOG, for example that they overcome periodical restrictions but are not independent of medication, for instance. Thus, a combination of FOG assessments as in our study may give a more comprehensive impression.
Anatomically, the pattern associated with improvement of FOG included two primary circuits. First, connectivity of stimulation volumes to the motor and premotor cortex as well as pallidosubthalamic fibers from the motor part of the STN lead to FOG alleviation. Secondly, both improvement in the questionnaire-based and the video-based assessments were associated with stimulation of prefrontal fibers, i.e., the dlPFC and the ACC. Although the overall connectivity profile for FOG improvement was similar to the one associated with the overall DBS outcome, a post-hoc analysis supported the notion that stimulation of prefrontal fibers was rather specific for FOG alleviation.
The finding that stimulation of the motor pathway is crucial for improving FOG may not be surprising. Indeed, the connectivity pattern matched sweet spots for the improvement of primary motor symptoms in PD (Fig. 7A) in the posterior part of the STN [45, 46]. This implies that an optimal location of electrodes and stimulation volumes with regard to primary motor symptoms of PD, e.g., akinesia and rigidity, is also beneficial for FOG. This may thus be a consequence of reduced OFF-time in patients with symptom fluctuations through stimulation of basal-ganglia motor circuits. Consistently, freezing in both the ON- and OFF-state (according to UPDRS-II Item 14; Fig. 2C, D) significantly reduces postoperatively in our sample.
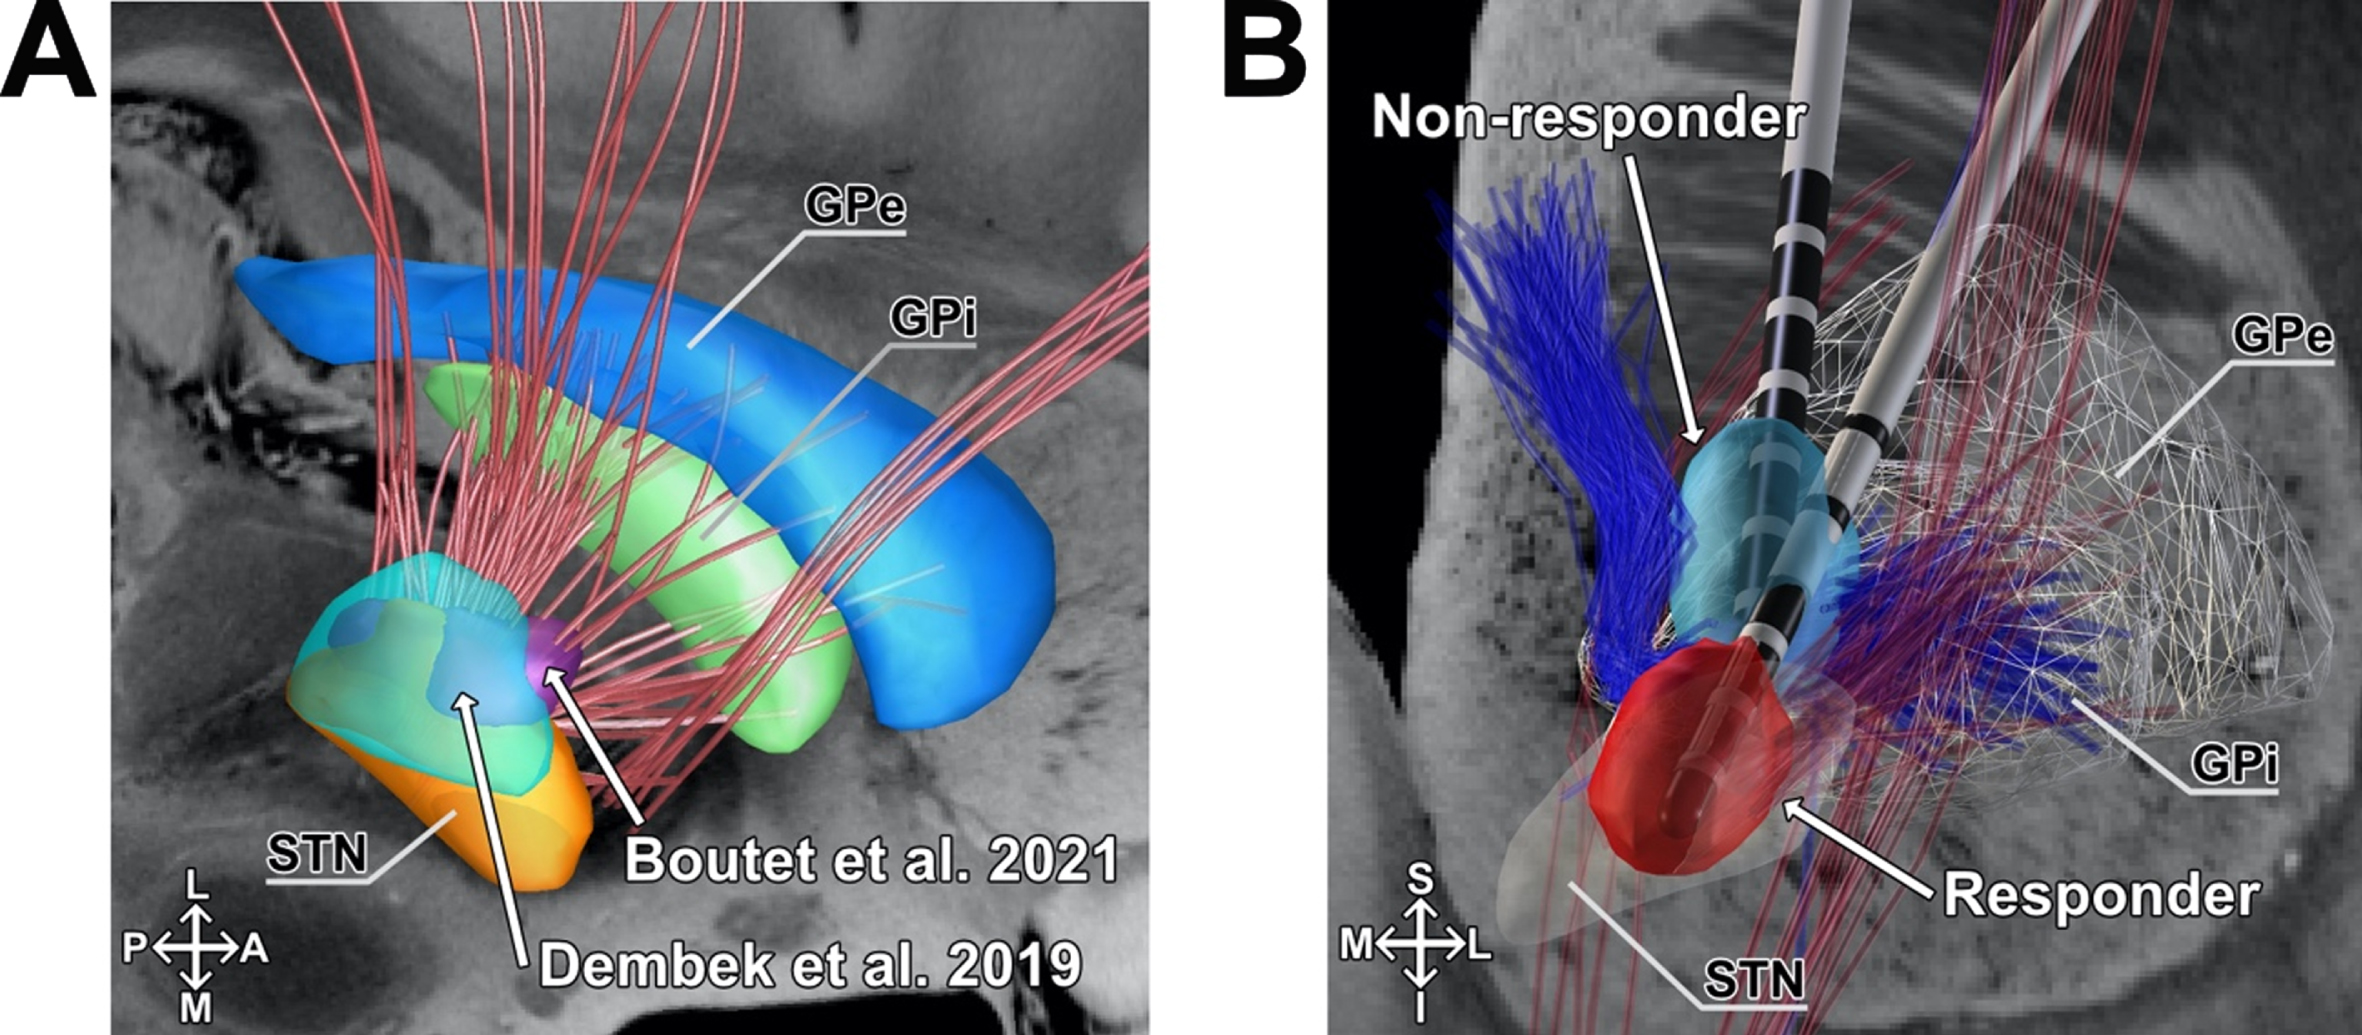
Visualization of connectivity related to FOG-improvement with motor sweet spots and exemplary stimulation volumes. A) Overlap of the associated connectivity profile associated with postoperative improvement in the FOG-Q (n = 47) and previously published sweet spots for the improvement of general motor performance. Blue, Globus pallidus externus (GPe); green, Globus pallidus internus (GPi); red, Subthalamic nucleus (STN); Cyan, Dembek et al. (2019) [45]; Purple, Boutet et al. (2021) [58]. B) The structural connectivity profile that is associated with stimulation induced changes in the FOG-Q (n = 47) and examples of non-responding and responding patients VTAs are shown. Right hemisphere. Detailed coronal view. Light blue, VTA of a non-responder; light red, VTA of a responder; dark blue, negative associated fibers; dark red, positive associated fibers; S, superior; I, inferior; A, anterior, p, posterior; M, medial; L, lateral.
As an additional pathway, we observed that prefrontal connections to the dlPFC and ACC were associated with improvement of FOG. The dlPFC is critically involved in executive functions including cognitive flexibility and working memory [47], while the ACC is a crucial hub for decision making and conflict solution [48]. Notably, both regions are also thought to be a central role in the cognitive aspects of FOG. There is evidence that patients with FOG have difficulties to adapt decisions during conflicting stimuli [49], a core feature of the ACC, which may be the consequence of inefficient cognitive control mediated by the dlPFC [28]. In line with this, brain atrophy in the dlPFC in PD patients is associated with both FOG deficits in executive function [50]. Last, non-invasive combined neuromodulation of the motor cortex and dlPFC result in acute improvement of FOG in the short-term [27]. These findings underline the importance of cognitive circuits in the genesis and treatment of FOG. Our results provide preliminary evidence that for improving FOG via DBS, the involvement of prefrontal connections may also be critical. This notion is further supported by observations of improved gait during cognitive challenges with active DBS [51]. In a previous study by Karachi and colleagues [52] optimal stimulation spots for improving FOG after STN-DBS were calculated based on the location of active contacts. Similar to our results, the study revealed the junction between the motor and associative STN as optimal spot for FOG. Of note, this retrospective study restricted their analysis to item 14 of the UPDRS-II. As the authors already stated as limitation, the FOG-Q is a more specific and comprehensive tool to assess FOG severity. Further, our study complements their findings by assessing structural connectivity that is associated with improvement of FOG.
Interestingly, modulated fibers within the lenticular fasciculus were associated with worsening of FOG. Given the controversial literature on the effect of pallidal stimulation and associated networks, a majority of studies reported worsening of gait after pallidal stimulation [53–55], associated with different functional zones within the globus pallidus [56]. Similarly to our study, Fleury and colleagues reported STN-DBS induced deterioration of gait with stimulation of the zona incerta and field H2 of forel [57]. Thus, if stimulation volumes are located pronouncedly superior to the STN, nearby the lenticular fasciculus, patients may experience a less favorable outcome (Fig. 7B).
We employed a connectivity data set that was specifically designed to study connections of the STN [38]. However, this atlas does not involve reliable connections to the brainstem, as the original authors chose arbitrary way points in the brainstem. Bearing in mind the pivotal role of the mesencephalic locomotor region in the pathophysiology of FOG [59], we additionally conducted a ROI analysis using a dMRI-based whole brain connectome derived from PD patients in combination with a histology-guided tractography atlas [41, 60]. In this ROI analysis, downstream connections to a priori defined mesencephalic locomotor regions, namely the PPN and the SN correlated with improvement of FOG, but not with the general DBS outcome. The beneficial effect of PPN stimulation on gait, but not on general parkinsonian symptoms has been made before [19]. Given that the STN, PPN, and SN have been introduced as specific targets for the treatment of FOG, our results suggest that the efficacy might be mediated by a common pathway. Along with this notion, Neague and colleagues could observe evoked potentials from STN-DBS in the PPN, suggesting that stimulation of the STN affects neuronal activity within downstream pathways [61]. However, we must emphasize that tractography of the brainstem is highly limited due to the presence of multiple grey matter nuclei and crossing white matter pathways that are concentrated in a small area. Especially the anatomical and functional differentiation of the PPN needs further investigation before conclusions about its role in FOG can be made [62, 63]. It should be noticed that our ROI analysis only yielded moderate effect sizes, especially for the SN, which analysis was barely at threshold for significance (r = 0.289; pFDR = 0.049). We here can only presume that the efficacy of STN-DBS on FOG might be modulated by a common pathway, as both nuclei feature widespread projections [64].
Furthermore, our results revealed a bilateral pattern of fibers responsible for improving FOG. In contrast, general DBS outcome was strongly lateralized in the left hemisphere - an observation that has been made before [60]. In our sample, 21/47 patients were stimulated with higher amplitudes in the left hemisphere (13/47 right hemisphere) according to their primary symptom lateralization, possibly explaining the laterality in the general DBS outcome. Notably, motor control is known to be strongly lateralized and in some patients, one STN may be more responsive to DBS than the other, which may further explain lateralization effects [65]. Regarding FOG, our results indicate that both left and right hemispherical stimulation is of importance. In line with this, two randomized, double-blind studies indicated improvement of gait coordination as a result of symmetric stimulation [51, 66]. The advantage of bilateral against unilateral stimulation for FOG was also reported in preliminary work in PPN-DBS [67]. However, it has been shown that in some patients, unilateral stimulation of a dominant STN could achieve results similar to bilateral stimulation [65]. Consistently, unilateral stimulation of the dominant STN could improve gait parameters such as stride length in a subsequent study, while an effect on other gait parameters and FOG could not be observed [66]. Future studies might therefore take a closer look whether involvement of bilateral networks is critical for improving FOG via neuromodulation.
Despite the retrospective character of our analysis, it may offer a blueprint for subsequent studies to determine optimal networks for improving FOG. Importantly, we propose that future studies aim to differentiate different freezing subtypes (i.e., motor vs. cognitive vs. limbic and levodopa-responsive vs. levodopa-resistant) to test whether specific pathways can be attributed to certain subtypes.
Methodological limitations
The field of connectomic DBS presents a powerful novel method in clinical research. Due to its novelty, however, there is still a lack of standardized and commonly agreed analysis algorithms. In our study, we used a publicly available BG-IC connectome and filtered streamlines according to patient’s individual stimulation site, generally referred to as activation volume tractography. This general concept has been used by several others before [46]. Notably, this method does not account for anisotropic and inhomogeneous properties within the brain tissue and considers homogeneous conductivity of 0.2 V/mm throughout the whole brain. Further, it does not account for antidromic, or orthodromic propagation of neuronal signals, nor does it account for fiber orientation, axon diameters, its respective excitation by large and small pulse widths, or increased excitability of terminating fibers, as proposed by other more complex models [69, 70]. We restricted our primary analysis to basal-ganglia circuitries curated by renowned anatomists which has the advantage to only include anatomically correct connections [38]. In turn, our analysis may be prone to result in false negative findings, as only predefined connections are considered instead of whole-brain connectomes. While both normative and patient-specific data are suitable to detect optimal DBS connectivity profiles, bearing both advantages and disadvantages [71], our approach is certainly not able to account for individual, structural changes in patients enrolled in this study. Especially, white matter atrophy might affect individual connectivity estimates. To our knowledge, most connectomic studies do not control for individual atrophy or white matter integrity patterns which might be a task for future studies. A further limitation is that postoperative CT scans were not available in four patients, in which we reconstructed electrodes based on intraoperative x-ray which may be less accurate. In our study, electrode position in 25 patients differed significantly from the mean. Indeed, exact positioning of DBS electrodes without histology may be prone to distortion of MR imaging [72], susceptibility to the artifact of the DBS lead [73] and the accuracy of the normalization, co-registration and refinement processes [74].
Further, we used the FOG-Q as the primary outcome parameter. However, this questionnaire does not consider the medication status of the patient and is a strongly subjective measurement. To partly overcome this limitation, we added a complementary, video-based assessment of FOG in the medication OFF-state. Further, we did not specifically test levodopa-responsiveness of FOG preoperatively but extracted this information from gait analysis in the UPDRS-III. Accordingly, our analysis did not include patients with real “ON-freezing” which may rely on modulation of different pathways. We further did not differentiate FOG according to conflicting motor, cognitive or emotional triggers as proposed by others [75]. Thus, our observation represents an averaged optimal connectivity profile. Estimating connectivity profiles in subsets of emotional, limbic, and motor freezers might clarify, in which matter different subtypes respond to modulation of respective basal-ganglia circuits. Thus, we advocate to replicate our findings in independent, larger samples using a strongly confounder-controlled study design.
CONCLUSION
The present study underlines the potential therapeutic value of STN-DBS on PD patients suffering from FOG. We found that connectivity of stimulation volumes to specific networks associated with motor and cognitive control was predictive of postoperative changes in FOG. By making our results publicly available, we advocate complementary connectomic studies, ideally involving different targets and fine-grained outcome assessments. In this light, our results may form a first step towards characterizing optimal pathways for improving FOG in PD.
Footnotes
ACKNOWLEDGMENTS
We thank Elfriede Stubbs and Susanne Hoffmann (University Hospital Cologne) for taking responsibility in clinical care.
Data used in the preparation of this article were obtained from the Parkinson’s Progression Markers Initiative (PPMI) database (![]() ). We thank the initiative for providing openly available datasets for research purposes. For up-to-date information on the study, visit ppmi-info.org. PPMI – a public-private partnership – is funded by the Michael J. Fox Foundation for Parkinson’s Research and funding partners.
). We thank the initiative for providing openly available datasets for research purposes. For up-to-date information on the study, visit ppmi-info.org. PPMI – a public-private partnership – is funded by the Michael J. Fox Foundation for Parkinson’s Research and funding partners.
FUNDING
Funding by the Deutsche Forschungsgemeinschaft (DFG, German Research Foundation) is gratefully acknowledged – Project-ID 431549029 - SFB 1451 (JCB, VVV, GRF) and SFB 936/C8 (CKEM, MPN).
CONFLICT OF INTEREST
The authors have no conflict of interest to report.
DATA AVAILABILITY
All in-house MATLAB scripts and extracted tracts from the connectivity estimation are made freely available within the Open Science Framework (DOI 10.17605/OSF.IO/B6Y53). Raw data is available upon reasonable request to the corresponding author.