
Abstract
INTRODUCTION
Clinically, Parkinson’s disease (PD) is characterized by motor symptoms (e.g., tremor, rigidity, and bradykinesia). Neuropsychological symptoms, however, increasingly are recognized as an integral part of the disease. In clinical practice, the majority of patients will experience at least one neuropsychological (e.g., cognitive and mood) symptom [1, 2], albeit at different stages of the disease course and with variable progression. These symptoms are an equally (or more) impactful element of a patient’s self-reported quality of life (QoL) [3, 4].
As the disease advances, PD patients continue to experience progressive motor (e.g., motor fluctuations, levodopa-induced dyskinesia, gait disorders, and falls) and non-motor (e.g., cognitive, mood, and autonomic) disability. Deep brain stimulation (DBS) has become an established and effective surgical treatment for PD motor symptoms [5–7], representing one of the most important treatment advances since the advent of dopaminergic therapies. PD patients can achieve dramatic improvements in motor symptoms from DBS, including control of medication-refractory tremor and reduction in dyskinesia, motor fluctuations, and/or required dosage of anti-parkinsonian medication [5–9].
Despite the motor gains achieved with DBS treatment, DBS has been associated with neuropsychological decline in 10–15% of patients, which may diminish QoL and the perceived positive impact of DBS [10]. Reports on the prevalence of neuropsychological impairment after DBS have varied widely from 0.5% –75% and are suspected to be underestimated and underreported [11]. The Movement Disorder Society has reaffirmed the efficacy of DBS on motor complications in PD [12], but the influence of DBS on neuropsychological symptoms remains unpredictable. The clinical variability in neuropsychological outcomes of DBS may arise from the heterogeneity of underlying neuropathological processes, and may be reliant on the degree and extent of pathology, particularly if it extends to multiple brain regions [13–16].
Iron deposition is a consistent pathological feature of PD, although content varies from brain region to region. Iron is capable of producing free-radicals that lead to proteinopathy and cell death [17]. In particular, iron is linked to PD pathological processes including the catalyzation and aggregation of Lewy bodies [18, 19]. Previous studies have indicated that the apparent transverse relaxation rate (R2*) is a promising quantitative marker of brain iron content [20, 21] and is related to PD pathology and progression [22, 23]. Pre-surgical MRIs are obtained routinely in all PD patients scheduled for DBS to rule out secondary pathologies and for lead targeting purposes. Therefore, pre-DBS iron imaging may capture pathological processes involved in neuropsychological outcomes of DBS and improve identification of at-risk individuals after surgery.
In the current study, we explored whether brain iron alterations may be related to neuropsychological outcomes in PD patients after DBS. First, we determined whether quantifying iron accumulation could improve prediction of neuropsychological outcomes after DBS. Then, we investigated the pattern of dominant predictors in relation to individual outcomes. Lastly, we applied correlation analyses to evaluate R2* associations with neuropsychological outcomes. Collectively, this pilot study aimed to identify key structures affected by PD-related pathology for future translational research to improve DBS outcomes.
METHODS
Selection of cases
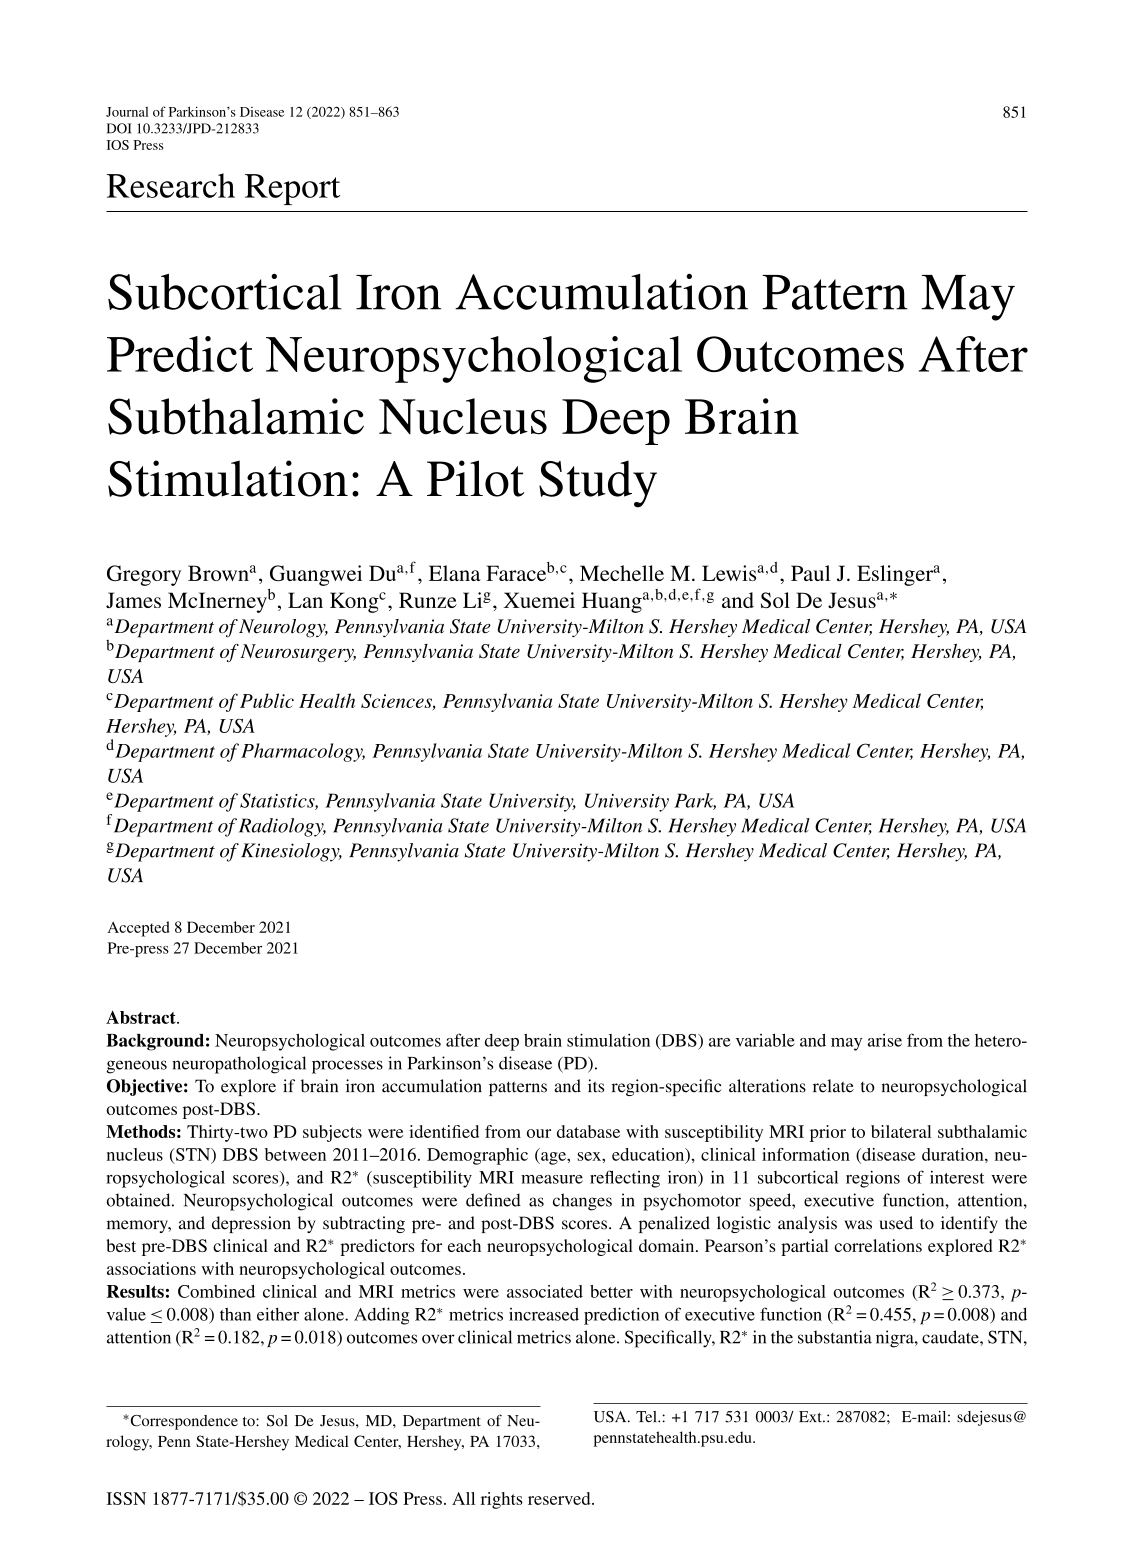
The protocol was approved by the Penn State University-Milton S. Hershey Medical Center (HMC) Institutional Review Board and informed consent was obtained from all individuals. In addition to consenting to specific MRI sequences (similar to the NINDS-sponsored Parkinson’s Disease Biomarker Program) since 2011 [24], all individuals consented for extraction of clinical data from their medical records for future research purposes. For this retrospective study, we selected individuals who underwent bilateral STN DBS and completed a standard baseline MRI protocol, along with pre- and post-DBS neuropsychological testing. The selection process is detailed in Fig. 1. The final cohort included 32 PD individuals (25 males/7 female, mean age 68.3±8.8 years) evaluated at baseline between 2011–2016. For the described study, 2016 was determined as the end date for data extraction since a fellowship trained movement disorder specialist (SD) joined the group at that time and restructured clinical practice.
Process for selection of cases. Flowchart of MRI protocols available for data processing between 2011 and 2016. N represents number of individuals in that group. Study population of interest (*) was those individuals who underwent STN-DBS, were able to complete MRI, and had pre and post-DBS neurobehavioral scores available (32 cases). DBS, deep brain stimulation; ET, essential tremor; GPi, Globus pallidus internus; STN, Subthalamic nucleus; OCD, obsessive compulsive behavior; RLS, restless legs syndrome.
Clinical assessment measures
Age, sex, disease duration, education, and pre-DBS neuropsychological measures (pre-test score) were determined for all individuals at baseline. Disease duration was defined as years from initial motor symptom or years from diagnosis if the former was not available. UPDRS ON/OFF assessments were not being performed at our center during the time of data collection (2011–2016) and are not available.
DBS surgical procedure
The Penn State DBS program was founded in 2003. All surgeries were performed by the same fellowship trained functional and stereotactic neurosurgeon (JM) using the microTargeting™ platform (MTP) stereotaxy system (FHC Inc., Bowdoin, ME, USA). Surgery was performed while patients were awake and included microelectrode recordings. Electrode placement was confirmed with thin slice CT scans post-operatively. As part of standard DBS practices at Penn State, PD diagnosis was determined by the referring neurologist.
All participants considering DBS underwent a detailed neuropsychological battery conducted by a DBS-focused neuropsychologist (EF) within 3 months of the procedure. Individuals with active untreated mood symptoms or clinical dementia were excluded from surgery. Neuropsychological performance was retested in patients 3 months post-DBS surgery by the same neuropsychologist (EF). The 3-month interval was determined as the standard of care follow up time frame by the DBS-focused neuropsychologist (EF). This follow up period eliminates contributions both from lesioning effects and anticipated disease progression [25] and has been our standard protocol since the program started in 2005. The post-DBS effects were evaluated in the ON medicine/ON DBS state, and we understand that not all patients would be fully optimized from a motor standpoint at this time point. Continuous stimulation for the 3-month duration, however, should be sufficient to expose a change in neuropsychological measures as compared to presurgical scores. Surgical protocols for implantation of DBS systems were followed as established at Penn State that include a staged (bilateral lead/implantable pulse generator) procedure utilizing a frameless system, surgeon anatomical mapping verified by microelectrode recording and intraoperative side effect threshold testing, and DBS implant (Medtronic 3389 quadripolar electrode).
Neuropsychological classification of clinical domains
The clinical neuropsychological domains of interest for this study were cognition (psychomotor speed, executive function, memory, and attention) and mood (depression). As part of standard clinical care practices at HMC, an abbreviated post-surgical neuropsychological battery was obtained at 3 months. Therefore, only a subset of the neuropsychological battery was available for analysis post-surgery. From the available follow-up data, neuropsychological tests representing the domains of interest were selected by consensus of the DBS-dedicated neuropsychologist (EF) and movement disorder specialist (SD). Cognition was assessed in the ON medication state using four outcomes (test - domain of interest): Trail Making A (Trails A) for psychomotor speed, Trail Making B (Trails B) for executive function [26, 27], the Mattis Dementia Rating Scale 2 (DRS2)-Memory subscale for memory, and the Mattis DRS2-Attention subscale for attention [28]. Depression was evaluated using the Geriatric Depression Scale (GDS), a variant of the Beck Depression Inventory that is more accessible to elderly individuals [29].
MRI acquisition and image processing
Brain MRI data were obtained using a 3.0-Tesla MRI system (Trio; Siemens Magnetom; Erlangen, Germany) with an 8-channel phased-array head coil. An MPRAGE sequence was used to obtain T1W images with TR/TE = 1540/2.34, FoV =256 mm×256 mm, matrix = 256×256, slice thickness = 1 mm (with no gap), and slice number = 176. T2W images were acquired using a fast-spin-echo sequence with TR/TE = 2500/316 and the same resolution parameters as T1-weighted images. A multi-gradient-echo sequence was used to obtain R2* images. Six echoes with TE ranging from 7 to 47 ms with an equal interval of 8 ms were acquired with TR = 54 ms, flip angle = 20°, FoV =256 mm×256 mm, matrix = 256×256, slice thickness = 1.5 mm (with no gap), and slice number = 64. An affine registration then was used to align six magnitude images to an averaged mean magnitude image for potential head motion correction in multi-gradient-echo images. The R2* maps then were generated by employing a voxel-wise non-linear Levenberg-Marquardt algorithm to fit a mono-exponential function (s = s0eTE*R2*) using an in-house Matlab (MathWorks, Natick, Massachusetts) tool. The Matlab algorithm is available upon request.
Selection and segmentation of regions of interest
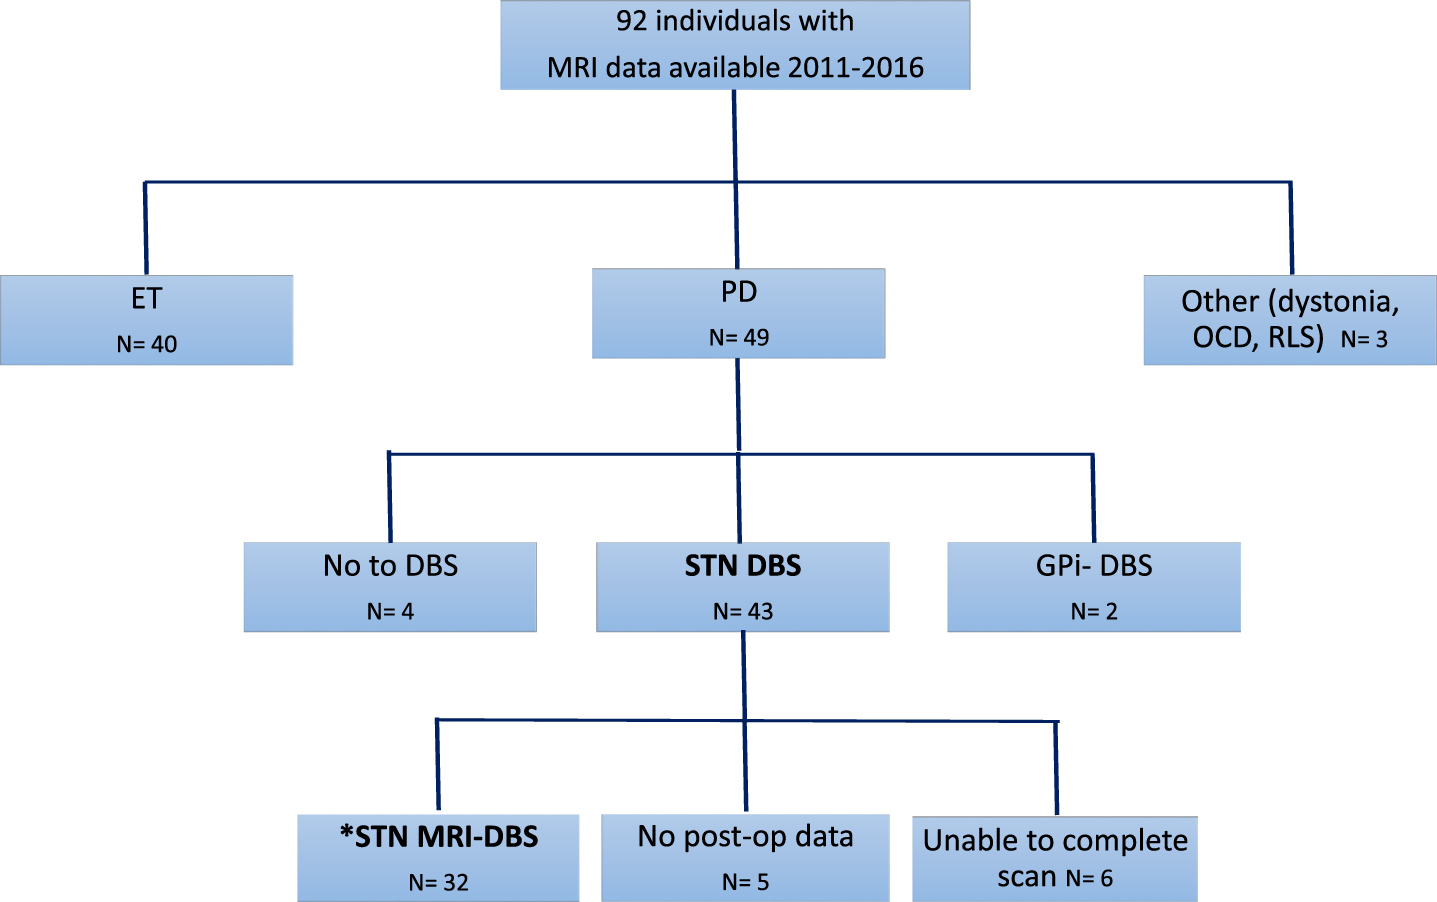
Eleven ROIs within and outside the basal ganglia were selected to assess R2* MRI metrics based on their potential relevance to clinical symptoms and associated PD pathology. For ROIs within the basal ganglia, we selected the substantia nigra (SN) [SNc and SNr], putamen, caudate nucleus, globus pallidus, and STN. For ROIs outside the basal ganglia, we selected the amygdala, hippocampus, and nucleus accumbens from limbic systems, the thalamus, and red nucleus. The segmentation of ROIs was performed using an atlas-based segmentation pipeline implemented in AutoSeg [30] using an unbiased, cohort-specific template generated from all individuals’ T1w images using ANTs [31]. Segmentation results were checked visually for quality control and manually corrected for any large mislabeling. Segmented ROIs are illustrated in Fig. 2. An affine registration then was used to transform segmented ROIs to individual R2* maps. Mean R2* values for each ROI then were calculated. All MRI analyses were performed by personnel who were blinded to the clinical status of individuals.
Segmented regions of interest. Highlighted in image (A) putamen (PUT), caudate nucleus (CN), globus pallidus (GP), and thalamus (THAL); (B) putamen (PUT), globus pallidus (GP), amygdala (Amy), hippocampus (Hipp); (C) substantia nigra pars compacta (SNc), substantia nigra pars reticulata (SNr), red nucleus (RN); and (D) subthalamic nucleus (STN) and red nucleus (RN).
Statistical analyses
Three models were used to predict each of the five neuropsychological domains of interest (change between pre-surgery and 3-month post-surgery follow-up in Trails A, Trails B, DRS2-memory, DRS2-attention, and GDS). For the first model, five clinical metrics were included as predictors (age, gender, disease duration, education, and pre-surgery neuropsychological score; clinical model). For the second model, R2* values from the 11 selected ROIs (see above) were included as predictors (MRI model). The third model included the combined clinical and MRI values as predictors (combined model). This resulted in a total of fifteen models (three for each of the five domains).
An elastic-net regularized regression method was used for predictive modeling. The major constraint for model building was that the number of predictors was close to the number of observations. Therefore, we needed to identify parsimonious models of the dominant predictors. For this purpose, elastic net has been shown to outperform both ridge and lasso [32]. For each neuropsychological domain, we trained an elastic-net regularized regression model to predict the neuropsychological changes between pre-surgery and 3-month post-surgery follow-up. To accomplish this, two hyperparameters needed to be defined: lambda and alpha. The lambda parameter was selected using the leave-one-out cross-validation (LOOCV) method to provide the most regularized model such that the cross-validated error is within one standard error of the minimum absolute error. This method identifies the fewest dominant predictors, while maintaining prediction power. A pre-defined alpha = 0.2 (a balance between model simplicity and predictive power) was selected. This process was performed using the above three sets of predictors. Model characteristics were assessed using R2 and p-values from the fitted linear models. For each clinical outcome, the added value of MRI to the clinical model was evaluated using an F-test comparing clinical and combined models. To correct for multiple comparisons of model significance, False Discovery Rate (FDR) < 0.05 with 20 comparisons (5 clinical outcomes, 4 tests per outcome) was used.
To explore the importance of each predictor, an ordinary least square (OLS) regression was used to fit the predictors selected from the combined models (clinical and MRI metrics together). To further investigate the MRI metrics that significantly improved the prediction of clinical domains of interest (i.e., executive function and attention), we performed partial Pearson’s correlations between baseline R2* in the identified regions and DBS outcomes. The covariates were the important clinical predictors identified: age and disease duration for executive function and age, sex, disease duration, and pre-test score for attention.
RESULTS
Demographics
Demographic, clinical, and neuropsychological data are presented in Table 1. The number of individuals with complete neuropsychological data varied across the five domains of interest: 26 for psychomotor speed, 25 for executive function, 20 for attention, 20 for memory, and 16 for depression. Note that because attention and memory are both subtests of the DRS-2, the same individuals took both of these tests as indicated by the identical demographic information. Individuals were more likely male with an average age of 68–74 years old, depending on the metric. Average disease duration was 8–9 years and LEDD was 716–790 mg, suggesting individuals were at an intermediate disease stage. Individuals were also non-demented as indicated by an average Mini-Mental State Examination score of 27. The mean pre-DBS score was normal for the five neuropsychological tests of interest. Change in neuropsychological scores was close to 0 with a large variance, suggesting a wide range of neuropsychological DBS outcomes. Overall, psychomotor speed, executive function, and memory worsened, but attention and depression measures improved.
Demographic and clinical data on DBS subjects with available neuropsychological domains
Data represent mean±standard deviation, except number of individual (male/female). Trails A and B are T Scores in relation to age and education, and DRS2 attention and memory are scaled scores in relation to age and education. GDS is the number of symptoms endorsed out of 30. DRS2 attention and memory are subscores of the same test so the individuals completing these tests are the same. Post-DBS score was obtained 3 months after DBS. DRS, Dementia Rating Scale-2; GDS, Geriatric Depression Scale; LEDD, Levodopa equivalent daily dose; MMSE, Mini-Mental Status Examination.
Clinical and/or iron MRI patterns predict DBS outcomes
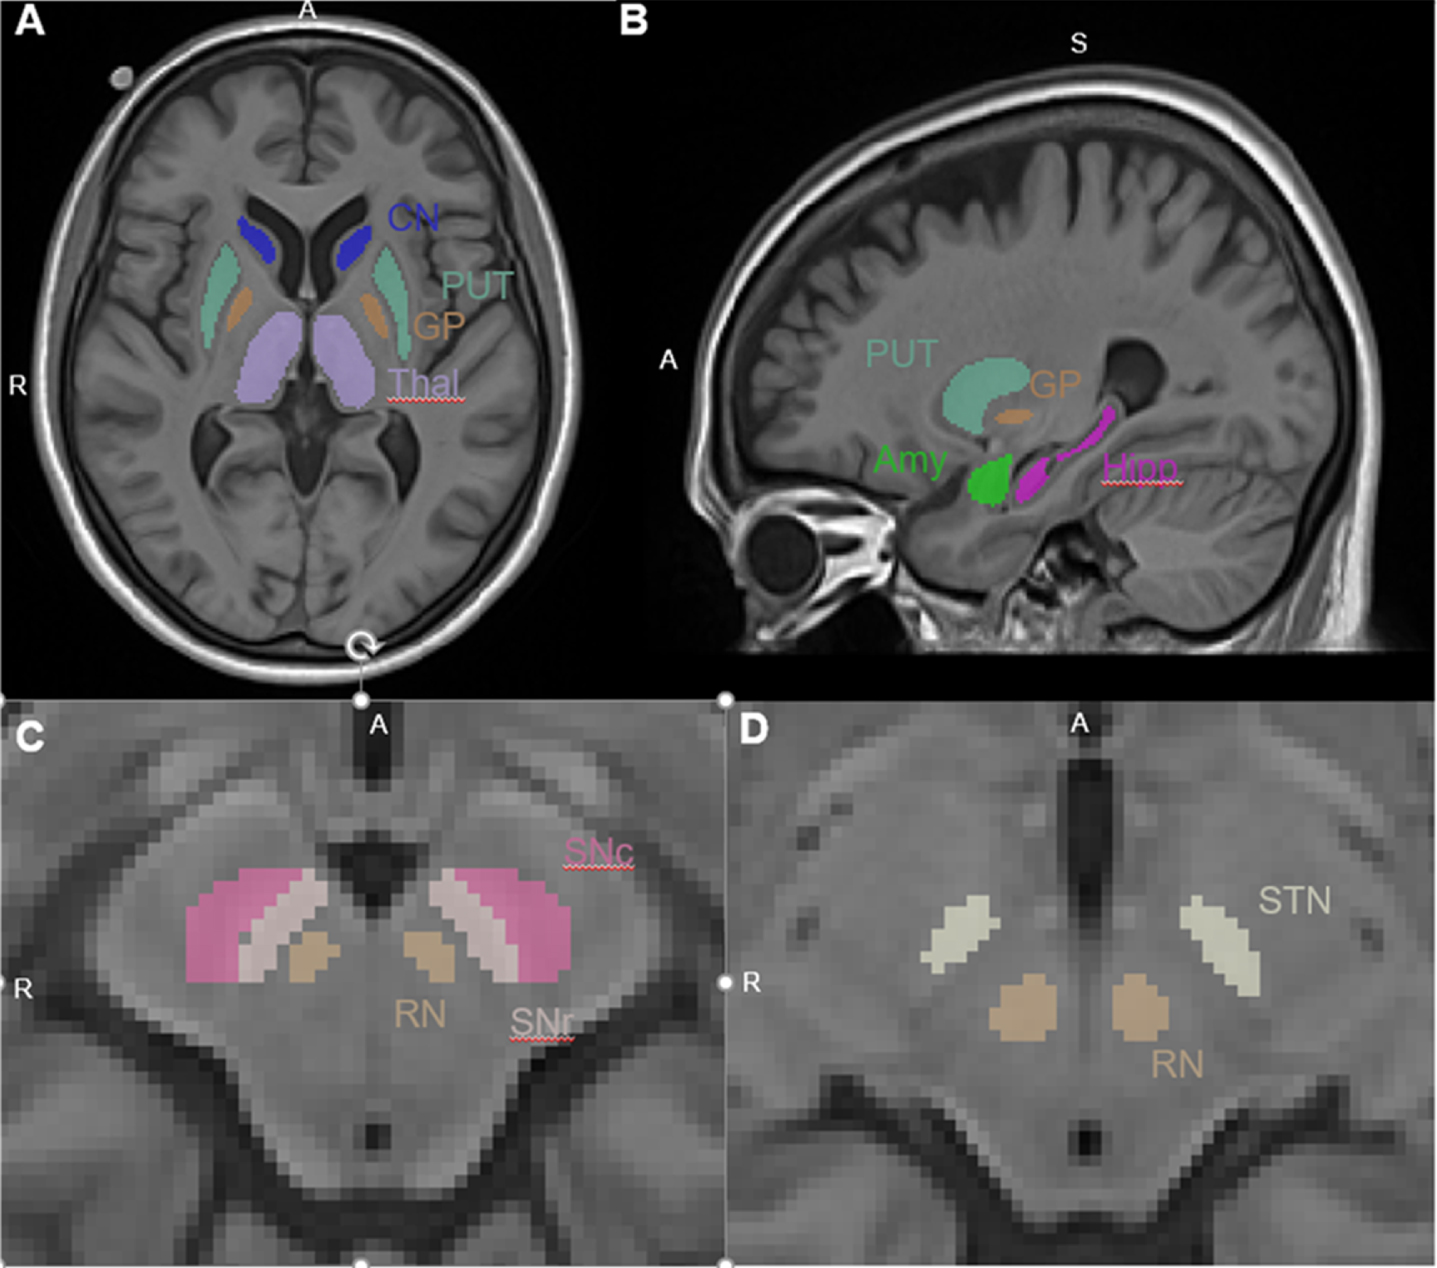
The model using only clinical data (Table 2, Model A) predicted psychomotor speed, memory, and depression outcomes. These results remained significant after accounting for multiple comparisons. Clinical-only information, however, was not associated with executive function or attention outcomes. The model using only iron MRI data (Table 2, Model B) predicted psychomotor speed outcomes, but following correction for multiple comparisons the significance was not sustained. The combined model, which used both clinical and iron MRI data (Table 2 Model C), predicted neuropsychological outcomes in all domains, and these associations remained after correction for multiple comparisons. Compared to the model using only clinical data, the addition of iron MRI metrics significantly increased the accuracy in prediction of executive function (R2 increased from 0.186 to 0.605, p = 0.008, Fig. 3A-C) and attention (R2 increased from 0.460 to 0.642, p = 0.018, Fig. 3D-F) outcomes. These results remained significant after correction for multiple comparisons (Table 2 Model C vs. A). Inclusion of iron MRI pattern did not significantly improve prediction of DBS outcomes in other domains.
Value of pre-DBS clinical and/or MRI metric in predicting DBS outcomes
Model significance was assessed using R2 and p-values from the fitted linear models. The significance of value added by MRI was calculated from the F-statistic of an ANOVA comparing the full model (Model C) and clinic only model (Model A). Italicized bold text indicates significance (< 0.05) with False Discovery Rate correction.
Model prediction of executive function and attention outcomes. Prediction of executive function outcomes (Δ Trails B) using A) clinical-only data [age, disease duration], B) MRI-only metrics [R2* in caudate, subthalamic nucleus, hippocampus], and C) the combined model (clinical and MRI data). Prediction of attention outcomes [Δ Dementia Rating Scale-2 (DRS2)-Attention] using D) clinical-only data [age, sex, disease duration, pre-DBS test score], E) MRI-only metrics [R2* in putamen], and F) the combined model (clinical and MRI data). R2 and p-values are from the model fit. Points represent individual data values, the solid line is the best fit line, and the dotted lines are the upper and lower bounds of the 95% confidence interval.
Dominant clinical and/or MRI predictors related to clinical outcomes
Table 3 details the individual significance of the dominant predictors (i.e., clinical or MRI) associated with neuropsychological outcomes as identified by our penalized regression analysis. For clinical predictors, age and pre-DBS neuropsychological test score were associated with all domains except psychomotor speed and executive function, respectively. Sex contributed to domains of attention and memory. Disease duration was associated with executive function, attention, and depression. Education was not associated with any domain.
Full Model (Model C) best clinical and MRI metrics identified using penalized regression in predicting DBS outcomes
Each set of predictors as determined by elastic net was fit to an ordinary least squares model. + identified by penalized regression analysis but individual prediction significance was > 0.05; *metric significance was between 0.05 and 0.01, **metric significance was < 0.01. GP, Globus Pallidus; NAcc, Nucleus accumbens; SNc, Substantia nigra pars compacta; SNr, Substantia nigra pars reticulata; STN, Subthalamic nucleus.
For MRI predictors, the SNc was associated with executive function and memory. Striatal and other basal ganglia structures were associated with all domain outcomes except memory. SNr, amygdala, nucleus accumbens, thalamus, and red nucleus, however, were not relevant in any domain of interest. Executive function and depression outcomes were associated with more diffuse brain regions, whereas psychomotor speed, attention, and memory were restricted more to the caudate, putamen, and SNc, respectively.
When comparing the significance of all predictors, the best predictor of psychomotor speed response was disease pre-test score followed by R2* in the caudate. The best predictors of executive function were age, disease duration, and R2* values in the SNc, caudate, STN, and hippocampus. Of these, the most significant predictor was the hippocampus, followed by caudate and age. For attention, the best predictors were age, sex, disease duration, pre-test score, and R2* in the putamen. Of these, age, pre-test score, and R2* in the putamen were the most significant predictors. For memory, the best predictors were age, sex, pre-test score, and R2* values in the SNc. Of these, pre-test score was the only one that individually reached significance. For depression, the best predictors were age, disease duration, pre-test score, and R2* in the caudate, globus pallidus, and hippocampus, and only pre-test score was individually significant.
Iron-related pathology in key regions relates to executive function and attention outcomes
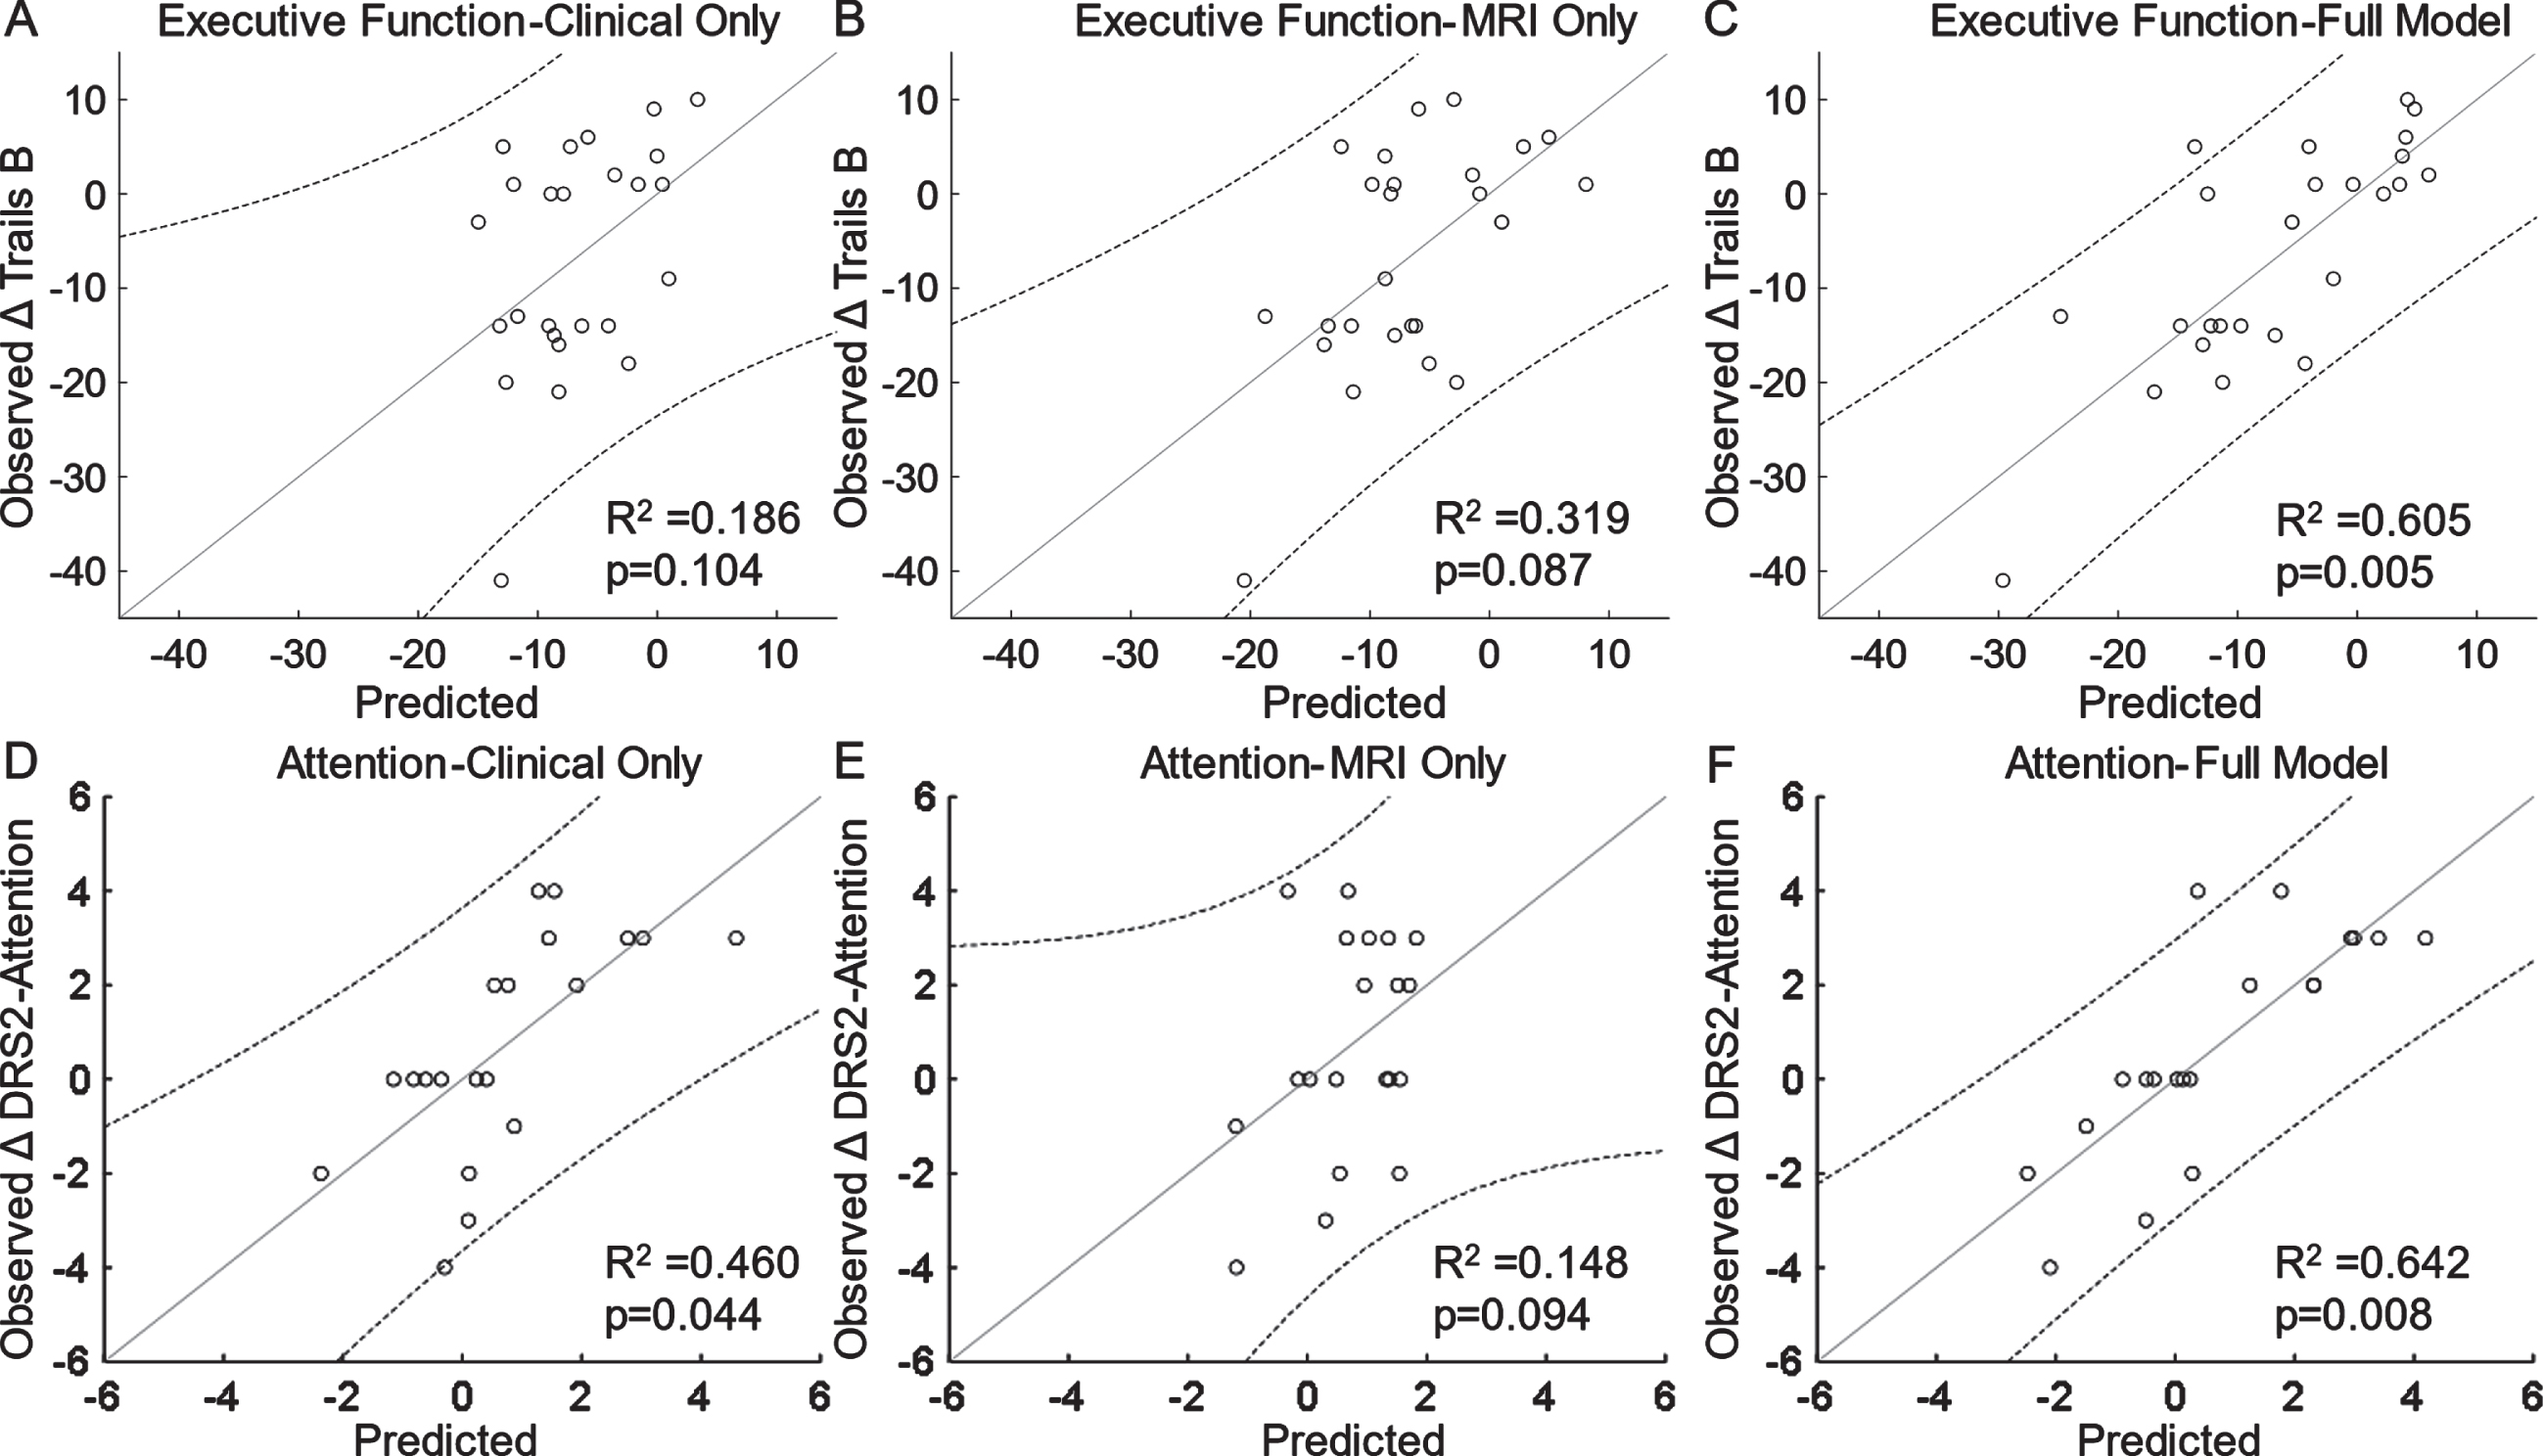
Since the addition of MRI metrics significantly improved the prediction of executive function and attention outcomes, we further explored pre-DBS R2* values in regions associated with executive function (SNc, caudate, STN, and hippocampus) and attention (putamen) outcomes. Lower R2* in the caudate was associated with worse executive function outcome (p = 0.043, Fig. 4A). R2* in the STN (p = 0.124, Fig. 4B) and SNc (p = 0.451, Fig. 4C) had similar non-significant trends. Higher R2* in the hippocampus trended toward worse executive function outcome (p = 0.075, Fig. 4D). Higher R2* in the putamen was related to worse attention outcome (p = 0.018, Fig. 4E).
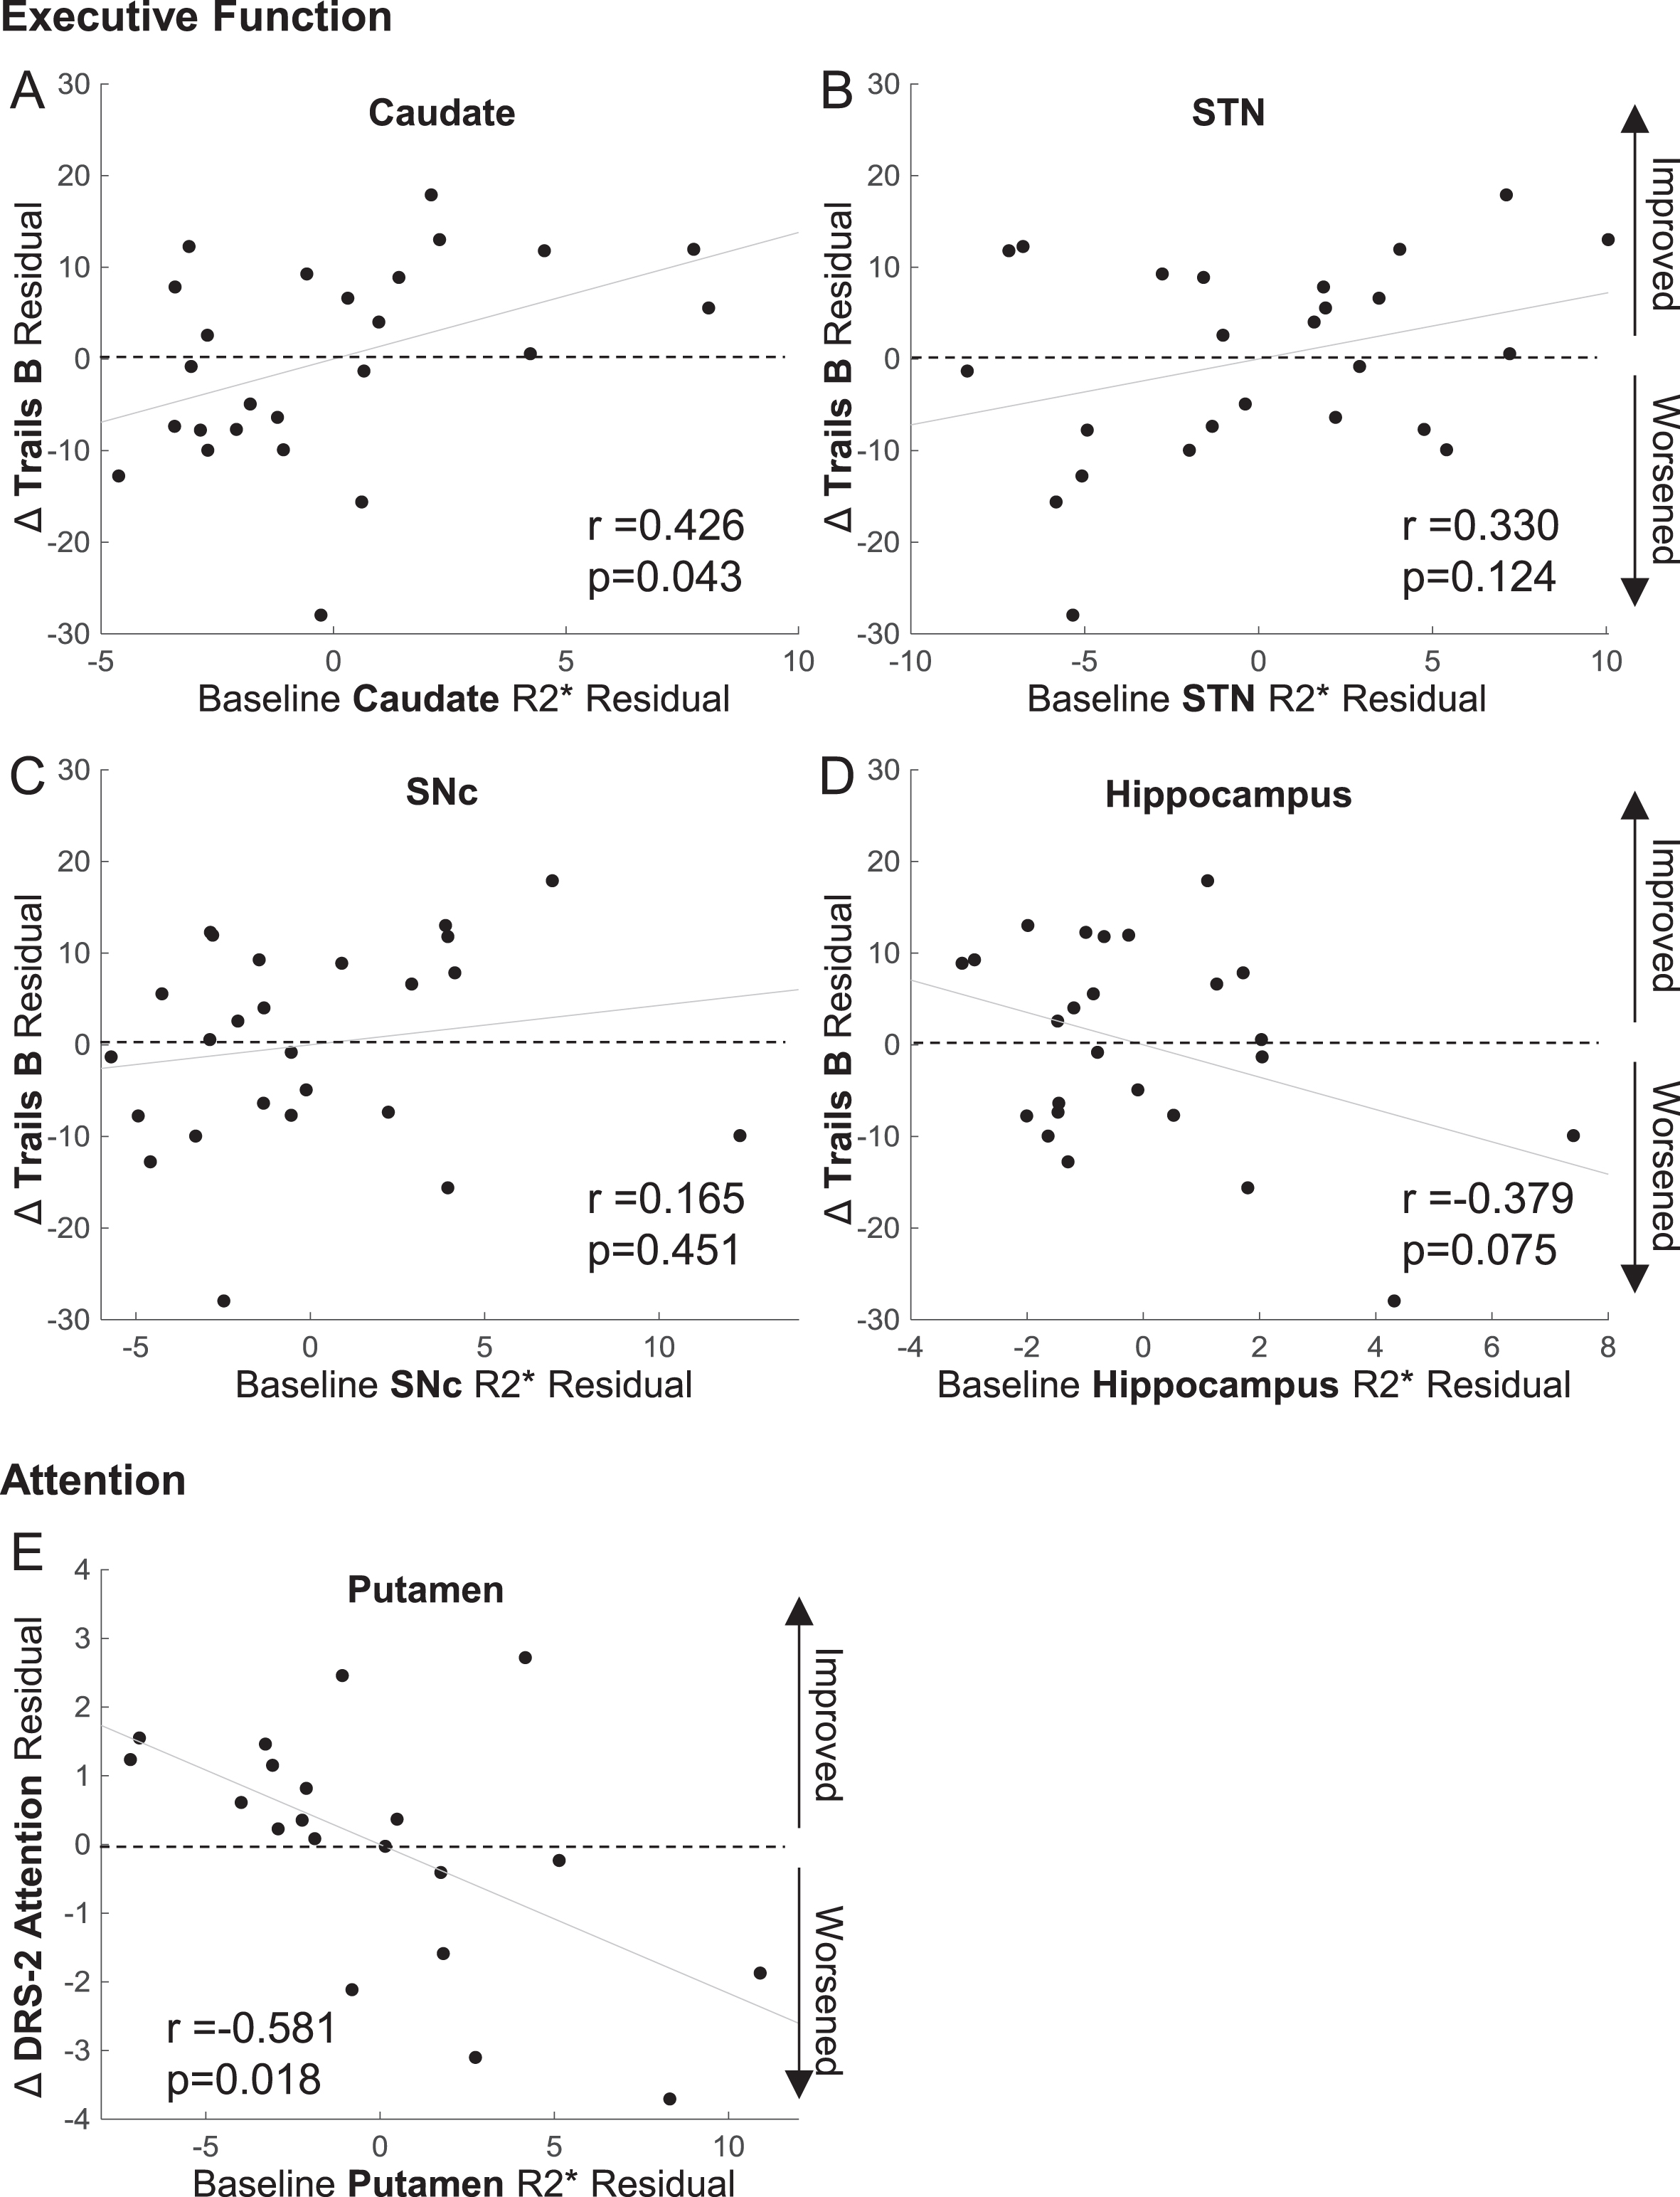
ROI associations with DBS outcome metrics. Partial Pearson’s correlation of R2* in regions identified by models to improve the prediction of executive function and attention outcomes. For executive function, the regions were a) caudate, b) subthalamic nucleus (STN), c) substantia nigra pars compacta (SNc), and d) hippocampus. For attention the region was e) the putamen. The covariates were the significant clinical predictors from the models, which were age and disease duration for executive function and age, sex, disease duration and pre-DBS test score for attention.
DISCUSSION
This pilot study explored the best predictors of neuropsychological outcomes after STN DBS using penalized logistic analysis. Consistent with current practice consensus, our study confirmed that demographic and clinical features are important in predicting DBS outcomes. Most importantly, this study provides initial evidence that the pattern of brain iron accumulation, as reflected by susceptibility MRI, may add value in predicting neuropsychological outcomes after STN DBS. Intriguingly, in the domains of executive function and attention, we also discovered differential iron-clinical associations for specific striatal structures. Further studies are warranted to validate the findings and understand the underlying mechanism.
Clinical metrics remain an important part of DBS candidate selection
Optimizing DBS clinical outcomes requires a comprehensive, multidisciplinary evaluation to screen an individual’s eligibility and tailor procedures based on the patient’s profile [33, 34]. A current lack of standardized screening and surgical protocols leads to specialized team members utilizing center-specific pre-surgical clinical assessments to develop a risk/benefit profile for each patient. There is, however, general consensus acknowledging the role of demographic and clinic features in predicting good DBS outcomes for PD patients. These features include younger age, longer disease duration, robust levodopa responsiveness, tremor predominance, and good pre-operative neuropsychological testing [35–38]. Consistent with this knowledge, the current study identified demographic (i.e., age) and clinical information (i.e., disease duration and pre-DBS test scores) to be associated with all domains of interest, except executive function. The findings reinforce that neuropsychological outcomes following DBS may be influenced by both demographic and clinical features [36, 39] and underscore that there remains a need for additional metrics to predict executive function and other neuropsychological outcomes.
Iron imaging may enhance prediction of neuropsychological DBS outcomes
Subcortical nuclei have been found to be rich in iron to variable degrees. Numerous mechanisms contribute to iron accumulation in these structures, including oxidative (and nitrative) stress, neuroinflammation, abnormal iron homeostasis, mitochondrial dysfunction, and altered proteolysis [40, 41]. Neurodegenerative processes and aging both have been associated with disruption of iron homeostasis [17]. R2* reflecting iron has been found to capture PD-related pathology and its progression [42] and may have a role in predicting DBS. Consistent with this idea, our study provides initial evidence that iron imaging may add value to the predication of neuropsychological outcomes after DBS, particularly in the executive function and attention domains. Iron plays an essential role in cellular respiration, ribosome function, and DNA maintenance [13], and iron dysregulation has been associated with numerous neurodegenerative diseases, including PD [43, 44]. In PD, iron has been shown to catalyze α-synuclein aggregation, mark disease progression, and relate to cognitive impairment [18, 44–46]. Therefore, brain iron dysregulation may be a key pathology contributing to PD-related cognitive decline. The particular association with executive and attention outcomes may be expected as impaired dopaminergic signaling in frontostriatal circuits represents the predominant cognitive deficits in PD [47, 48]. In summary, pre-surgery brain iron distribution may be an indicator of pathological burden that can affect neuropsychological outcomes after DBS. This is exciting because MRI is a standard component of pre-DBS screening and if future studies confirm the findings, it can be integrated cost-effectively to guide clinical practice.
Patterns of iron pathology may be associated with executive and attention DBS outcomes
Executive function and attention have been noted to worsen after DBS irrespective of surgical-related factors or medication reduction [49]. Our study identified that iron accumulation, mainly in basal ganglia structures, enhances the prediction of both executive function and attention outcomes after DBS. This is consistent with the known role of basal ganglia circuits [50, 51]. In our study, however, striatal (i.e., caudate and putamen) R2* values had opposite associations with executive function and attention outcomes. This is very intriguing because there remains ambiguity as to whether iron accumulation is a primary (causal) or secondary (resultant) process in PD [40]. It is possible that PD primarily affects the putamen and mostly spares the caudate at earlier stages [52]. Thus, putamen iron may reflect primary iron-related pathological processes, whereas caudate iron may better reflect a compensatory process. Consistent with this idea, Hortnagl et al. reported that the putamen has a higher level of functional activity and turnover compared to the caudate [53], which may lead to pathological iron accumulation. Iron modulators, such as iron chelating agents, may offer an intriguing possibility to address pathological iron accumulation in PD. To date, clinical trials using iron chelators in PD have demonstrated only marginal effects on slowing disease progression [54, 55]. Additional studies with larger sample sizes or of longer duration are warranted to investigate iron-related processes and potential modulation of these processes in relation to DBS neuropsychological outcomes.
Limitations and future directions
Given the exploratory and retrospective nature of this pilot study, there are several limitations. Although the sample size was comparable to other exploratory studies involving DBS patient populations, it still was relatively small. Furthermore, our study was limited by data available for retrospective review. For example, motor efficacy scales (e.g., UPDRS) were not available, and a variable neuropsychological battery was completed by each individual, which resulted in limited data for analysis. However, our pilot data provides sufficient support to warrant design of prospective studies. Future investigations should design more comprehensive neuropsychological batteries to probe other neuropsychological domains, include motor efficacy scales (e.g., UPDRS), consider the effects of dopaminergic therapy and lead localization, and investigate longitudinal iron changes. Additionally, while we selected an imaging metric thought to reflect PD-related neuropathology, other mechanisms underlying the associations identified remain unknown. Other MRI, biofluid (e.g., blood, CSF), and/or genetic metrics also may provide information on brain alterations related to DBS outcomes. Lastly, growing literature suggests the GPi rather than the STN may be the recommended target for cases where pre-surgical cognitive decline or mood risks exist [56]. As shown in Fig. 1, at the time of data collection we only had two patients with GPi-DBS and this limited the ability to probe the effect of site differences on non-motor outcomes. Future studies should explore this factor.
CONCLUSIONS
PD-related patterns of iron accumulation in subcortical nuclei pre-DBS assist in predicting neuropsychological outcomes, particularly in the clinical domains of executive function and attention. Each domain was associated with a unique pattern of iron accumulation, which may reflect heterogeneity in underlying pathological processes. It is possible that the subcortical brain MRI alterations observed in the current study may reflect both a primary pathological process and/or a compensatory response. Future studies are warranted to confirm the current findings and improve understanding of how iron dysregulation and certain brain regions influence DBS outcomes.
Footnotes
ACKNOWLEDGMENTS
This work was supported in part by the National Institute of Neurological Disorders and Stroke Parkinson’s Disease Biomarker Program (NS082151 and NS112008 to XH), the PA Department of Health Tobacco CURE Funds, and the Penn State Translational Brain Research Center.
CONFLICT OF INTEREST
The authors report no conflicts of interest.
Gregory Brown received funding from the National Institute of Aging (NIA).
Guangwei Du received funding from the National Institute for Neurological Disorders and Stroke (NINDS), the National Institute of Environmental Health Sciences (NIEHS), the Michael J. Fox Foundation for Parkinson’s Research, the Alzheimer’s Association, Alzheimer’s Research UK, the Weston Brain Institute, and the Department of Defense. Dr. Du also has a patent related to this work.
Mechelle Lewis received funding from the NINDS, the NIEHS, the Michael J. Fox Foundation for Parkinson’s Research, the Alzheimer’s Association, Alzheimer’s Research UK, the Weston Brain Institute, Bristol Myers Squibb/Biogen, Biohaven, Pfizer, and the Department of Defense. Dr. Lewis also has a patent related to this work.
Elana Farace received consultant fee from Medtronic as an educational consultant, unrelated to this study.
Paul Eslinger received funding from the National Institutes of Health, Alzheimer’s Therapeutic Research Institute, NIA, Alzheimer’s Association, Canadian Institutes of Health Research, National Institute on Aging.
Lan Kong received funding from NINDS, NIEHS, the National Center for Advancing Translational Research (NCATS), the Patient-Centered Outcomes Research Institute (PCORI), the National Institute on Disability, Independent Living, and Rehabilitation Research (NIDILRR), the NIA, and Pfizer.
Runze Li received funding from the NIEHS, the NIDA, the National Science Foundation.
James McInerney received consultant fees from Medtronic Inc. Abbott and Boston Scientific, unrelated to this study.
Xuemei Huang received funding from the NINDS, the NIEHS, the National Science Foundation, the Michael J. Fox Foundation for Parkinson’s Research, the Alzheimer’s Association, Alzheimer’s Research UK, the Weston Brain Institute, Bristol Myers Squibb/Biogen, Biohaven, Pfizer, and the Department of Defense. Dr. Huang has received consultant fees from NIEHS. She also has a patent related to this work.
Sol De Jesus has received funding from the NINDS, Bristol Myers Squibb, Pfizer, as well as consultant fees from Medtronic Inc. and Boston Scientific, unrelated to this study.