
Abstract
Background:
Literature shows an inverse association of circulating cholesterol level with the risk of Parkinson’s disease (PD); this finding has important ramifications, but its interpretation has been debated.
Objective:
To longitudinally examine how blood total cholesterol changes during the development of PD.
Methods:
In the Health, Aging and Body Composition study (n = 3,053, 73.6±2.9 years), blood total cholesterol was measured at clinic visit years 1, 2, 4, 6, 8, 10, and 11. We first examined baseline cholesterol in relation to PD risk, adjusting for potential confounders and competing risk of death. Then, by contrasting the observed with expected cholesterol levels, we examined the trajectory of changes in total cholesterol before and after disease diagnosis.
Results:
Compared to the lowest tertile of baseline total cholesterol, the cumulative incidence ratio of PD and 95% confidence interval was 0.41 (0.20, 0.86) for the second tertile, and 0.69 (0.35, 1.35) for the third tertile. In the analysis that examined change of total cholesterol level before and after PD diagnosis, we found that its level began to decrease in the prodromal stage of PD and became statistically lower than the expected values ∼4 years before disease diagnosis (observed-expected difference, –6.68 mg/dL (95% confidence interval: –13.14, –0.22)). The decreasing trend persisted thereafter; by year-6 post-diagnosis, the difference increased to –13.59 mg/dL (95% confidence interval: –22.12, –5.06), although the linear trend did not reach statistical significance (p = 0.10).
Conclusion:
Circulating total cholesterol began to decrease in the prodromal stage of PD, which may in part explain its reported inverse association with PD.
INTRODUCTION
Lipid metabolism may play an important role in Parkinson’s disease (PD) development and progression [1]. Lipid signaling is involved in oxidative stress response, lysosomal function, endoplasmic reticulum stress response and immune response activation, mechanisms that may underlie the survival or death of dopaminergic neurons [2]. Most [3–11], but not all [12, 13], previous studies, including cohort analyses [6–11], reported an inverse association of either total or low-density lipoprotein cholesterol (LDL-C) with PD. The interpretation of this epidemiological observation has, however, been unclear and debated as there are at least two plausible explanations. Some propose that cholesterol may be neuroprotective against PD development [4, 8]. This explanation, while attractive and biologically plausible, has been perplexed by the competing hypothesis that some statins may also be neuroprotective [14, 15] and by inconsistent findings on statin use and PD risk in epidemiological studies [8, 16]. Alternatively, this inverse association of cholesterol with PD can be explained by reverse causation that the circulating level of cholesterol somehow decreases as PD pathogenesis develops and progresses, even in its prodromal stage [10]. If this is true, we will need to investigate the complex interplays between cholesterol and PD progression and their potential impact on the health and survival of PD patients.
To the best of our knowledge, no studies have directly assessed how circulating cholesterols change in the course of PD development, primarily due to the fact that often only baseline cholesterol levels are measured and/or analyzed. In this study, we capitalized on the availability of seven mostly biennial measures of total cholesterol (TC) in the Health, Aging and Body Composition (Health ABC) Study and examined how TC changes in PD cases before and after diagnosis. In addition, we also analyzed baseline TC in relation to PD risk at various lengths of follow-up, accounting for competing risk of death which has not been accounted for in previous studies.
METHODS
Study population
The Health ABC Study was designed to explore if changes in body composition serve as a common pathway by which weight-associated diseases and lifestyles affect mobility, disability and longevity in older adults [17]. Briefly, in 1997 and 1998, this study recruited 3,075 well-functioning, community-dwelling persons (48.4% men and 41.6% African Americans) aged 70 to 79 years in the metropolitan areas of Pittsburgh, Pennsylvania, and Memphis, Tennessee. Study participants were followed with annual clinic or home visits through year 6 and then in year 8 10, 11, and 16. Phone interviews were conducted to update contacts and health status every 6 months between enrollment and year 15 and then quarterly through year 17 [18]. Study participants were followed from baseline to the date of death, last contact, or August 31, 2012, whichever came first. The analysis on potential changes of TC levels in PD cases was based on cholesterol measured at Health ABC clinical visit year 1, 2, 4, 6, 8, 10, and 11, limited to 3,053 participants after excluding those without any TC measurement during the follow-up (Supplementary Figure 1). The analysis on PD risk was limited to 2,948 participants after excluding those missing on baseline TC and prevalent PD cases. The study protocol was approved by all relevant institutional review boards. All participants provided informed consent at enrollment.
Blood cholesterol assessments
Participants were instructed to fast for 8 hours before coming to the clinic and the blood sample was drawn before they were given anything to eat. For those not meeting the fasting requirement, some of them returned to have another draw after fasting for at least 8 hours [19]. Blood samples were stored at –80°C or –70°C until analyzed. Specifically, TC was measured in fasting EDTA plasma at clinic visits in years 1, 2, 4, and 6 and measured in fasting serum in years 8, 10, and 11. TC levels in year 1, 2, 4, 6, 8, and 11 were analyzed using the OrthoVitros Clinical Chemistry System 950IRC instrument (Vitros 950, Johnson & Johnson) by the clinical Chemistry Laboratory at Fletcher Allen Health Care (LCBR), an affiliate of the University of Vermont, while the year-10 assay was conducted by applying the enzymatic method of Allain et al. [20] at the Nutrition Laboratory in the Department of Epidemiology at the University of Pittsburgh Graduate School of Public Health [21]. The inter-assay coefficient of variation (CV) was 1.5% for TC at the LCBR [22] and 1.3% at the Nutrition Laboratory [23]. Among 5% blind duplicate measurements at the LCBR, the CV of paired results was between 1.5% and 2.3% [21]. In addition to TC, high-density lipoprotein cholesterol (HDL-C) and triglyceride were also measured with fasting EDTA plasma in year 1 and 6 and fasting serum in year 8, 10, and 11. Corresponding LDL-C levels were subsequently estimated by the Friedewald equation [24]. The inter-assay CV was 2.3% for HDL-C/triglyceride [22] at the LCBR and 1.7% for triglyceride at the Nutrition Laboratory [23].
PD case identification
Identification and validation of PD cases in the Health ABC study were reported in detail by Chen et al. [25]. Briefly, in 2015, investigators retrospectively identified potential PD cases from all data the cohort has collected according to the following criteria: 1) any use of antiparkinsonian medication (carbidopa/levodopa, dopamine agonists, monoamine oxidase B inhibitors, amantadine or anticholinergic drugs) at any clinical visit; 2) self-reported PD at baseline or year 13; 3) ICD-9 code of PD or adjudication of PD as the cause of hospitalization; 4) PD as the adjudicated cause of death. Two experienced movement disorder specialists adjudicated PD diagnosis by consensus accounting for multiple independent sources that indicated a PD diagnosis, internal consistency and evidence against PD diagnosis. We further defined the year of diagnosis as the first year of reported PD medication or diagnosis. If PD was first identified by hospitalization or death, we defined year of diagnosis as the midpoint between first identification and the previous year of the medical survey without any report of PD medication use.
Years of cholesterol measurement before and after PD diagnosis
In the analysis that examines TC changes before and after PD diagnosis, we used the year of PD diagnosis as the reference time point. For each participant identified as having PD at each year of measurement, we calculated the number of years relative to the year of PD diagnosis by subtracting the calendar year of PD diagnosis from that of TC measurement. For example, if a participant received a PD diagnosis in 2005 and had TC measured four times in 1999, 2001, 2005, 2007, the corresponding year of TC measurement relative to PD diagnosis would be 6 and 4 years before, the year of, and 2 years after diagnosis.
Covariates
In the analysis of TC change in PD cases, we controlled for age, sex, race, study site, APOE ɛ4 allele, total fat mass, and statin use. Of these, age, fat mass, and statin use were time-variant specific to each clinical visit. APOE is the primary genetic factor that affects circulating cholesterol level [26]. In the study, total fat mass was measured using the fan-beam dual-energy x-ray absorptiometry (Hologic QDR 4500A version) in years 1 2, 4, 6, 8, and 10 [27]. We accounted for fat mass rather than the body mass index in this analysis because fat mass has a stronger correlation with TC, as shown in our sample (Pearson correlation coefficients: 0.121 vs 0.044) and also in previous studies [28, 29]. Statin use was assessed in years 1, 2, 3, 5, 6, 8, 10, and 11 using the medication inventory method which asked study participants to report detail uses (e.g., name, strength, frequency) of all prescribed and over-the-counter medications in the past 2 or 4 weeks.
Statistical analyses
We first examined baseline TC in relation to risk of PD at 7, 10, and 13 years of follow-up. In the analysis, we categorized baseline TC by tertiles using the lowest tertile as the reference level. Due to the advanced age of the study participants and long follow-up, we accounted for the competing risk of death by using the cumulative incidence functions (CIFs) in the descriptive analysis and the absolute risk regression (ARR) models [30] in the multivariable analysis. The Gray’s test [31] examined the homogeneity of the crude CIFs across TC tertile levels. The ARR models estimated the cumulative incidence ratios (CIR) and 95% confidence intervals (CI) for TC in relation to PD risk at year 7, 10, and 13 of follow-up, accounting for potential competing risk of death and potential confounding. We accounted for potential confounders due to their reported associations with both TC and PD, including baseline age, sex, race, smoking [32], and statin use [8, 33]. We did not adjust for APOE ɛ4 and fat mass in the primary analysis because they are not known risk factors for PD [34, 35]. In this specific cohort, the 13-year CIR was 1.01 (0.97, 1.04) for one-gram increase of total fat mass, and 1.37 (0.74, 2.53) for APOE ɛ4. Besides TC, we conducted similar analyses for baseline LDL-C and HDL-C.
In the analysis that examined changes in cholesterol level before and after PD diagnosis, we only analyzed TC because: 1) TC was the most examined cholesterol measure in the literature on cholesterol and PD risk, and 2) LDL-C and HDL-C were not measured in Health ABC in years 2 and 4. Because plasma TC was measured in clinical visit years 1, 2, 4, and 6, and serum TC in years 8, 10 and 11, we first constructed mixed models to predict the plasma cholesterol at year 8 and then used the conversion formula to convert serum cholesterol at year 10 and 11 to plasma levels (Supplementary Table 1), according to published methods [36, 37].
We then applied a method we published previously [38] to examine how TC level in PD might change over time. Briefly, at each clinic visit year, we first fitted a linear predictive model among individuals who did not develop PD in the follow-up using age, sex, race, study site, APOE ɛ4 allele, fat mass, and statin use and obtained beta-coefficients. We then applied these coefficients to PD cases and calculated their expected TC level had they not developed PD. We subsequently calculated residuals for TC at each year of visit, which by definition represent the difference between their actual and expected TC in that particular calendar year, had they not developed PD. After conducting this analysis for each clinic visit year that TC was measured, we compiled all available residuals for PD cases and realigned the time scale using year of PD diagnosis as the reference. We subsequently conducted a mixed model with cross-random effects to examine the trend of residuals across all years in reference to PD diagnosis. Specifically, in addition to the main model with residuals on the linear term of timepoint, we accounted for potential correlations between measures for each participant and each clinic visit by examining crossed random effects for the year of clinic visit and participant.
To further examine whether our analysis was affected by using serum or plasma samples, we conducted a sensitivity analysis using only plasma TC levels which are available for clinic visit years 1, 2, 4, and 6. The missing mechanism due to death and dropout between PD and non-PD cases were examined by using the joint model [39]. We used R software (version 4.0.0) and the “timereg” package [30] to conduct ARR analysis, and used “JM”, “nlme”, “survival” packages to build the joint model. Stata version 16.0 (StataCorp, College Station, TX) was used to conduct mixed-effects models with crossed random effects in examining the trend of TC changes. All other analyses were conducted using the SAS software (version 9.4; SAS Institute, Cary, NC). The significant level was considered as 2-sided with α= 0.05.
RESULTS
At baseline, eligible participants were on average 73.6±2.9 years and included 48.4% men and 41.4% blacks. A total of 81 PD cases were identified in the study population, including 19 prevalent cases at baseline and 62 incident cases during the follow-up. At the end of the follow-up, 1618 (53.0%) participants were deceased. Table 1 presents population characteristics who were included in the analysis on TC in relation to incident PD. At baseline, higher TC was associated with younger age, female sex, black race, study site in Pittsburgh, APOE ɛ4 allele, more total fat mass, never smoking, nonuse of statin at baseline.
Population characteristics by tertiles of total cholesterol level at study enrollment (n = 2,948a)
aThe table excluded 86 without baseline TC and 19 prevalent PD cases at study enrollment. bp-values for categorical variables were derived from Chi-square tests (including the missing category) and for continuous variables from Kruskal-Wallis tests. cBaseline total fat mass had 20 missing values (4 for the first tertile of TC, 7 for the second tertile, and 9 for the third tertile).
Both unadjusted analysis (Fig. 1) and multivariable ARR analysis (Table 2) suggest that higher baseline cholesterol level was associated with a lower cumulative incidence of PD after accounting for competing risk of death. Compared with the lowest TC tertile, the CIR and 95% CI for PD were 0.41 (0.20, 0.86) for the second tertile and 0.69 (0.35, 1.35) for the third tertile at the end of 13 years’ follow-up. Similar associations were found for 7 and 10 years of follow-up. After further adjusting for total fat mass and APOE ɛ4, the 13-year ICRs for PD were barely changed: 0.43 (0.20, 0.90) for the 2nd tertile and 0.73 (0.37, 1.43) for the 3rd tertile of TC. Compared with the lowest TC tertile, higher levels tended to be associated with modestly lower mortality prior to PD diagnosis. In the analysis, statin use was associated with higher risk of PD at the end of the follow-up (Supplementary Table 2). Analyses on LDL-C and PD showed associations in the same direction without statistical significance (Supplementary Table 3). Baseline HDL-C was not associated with PD risk (Supplementary Table 4).
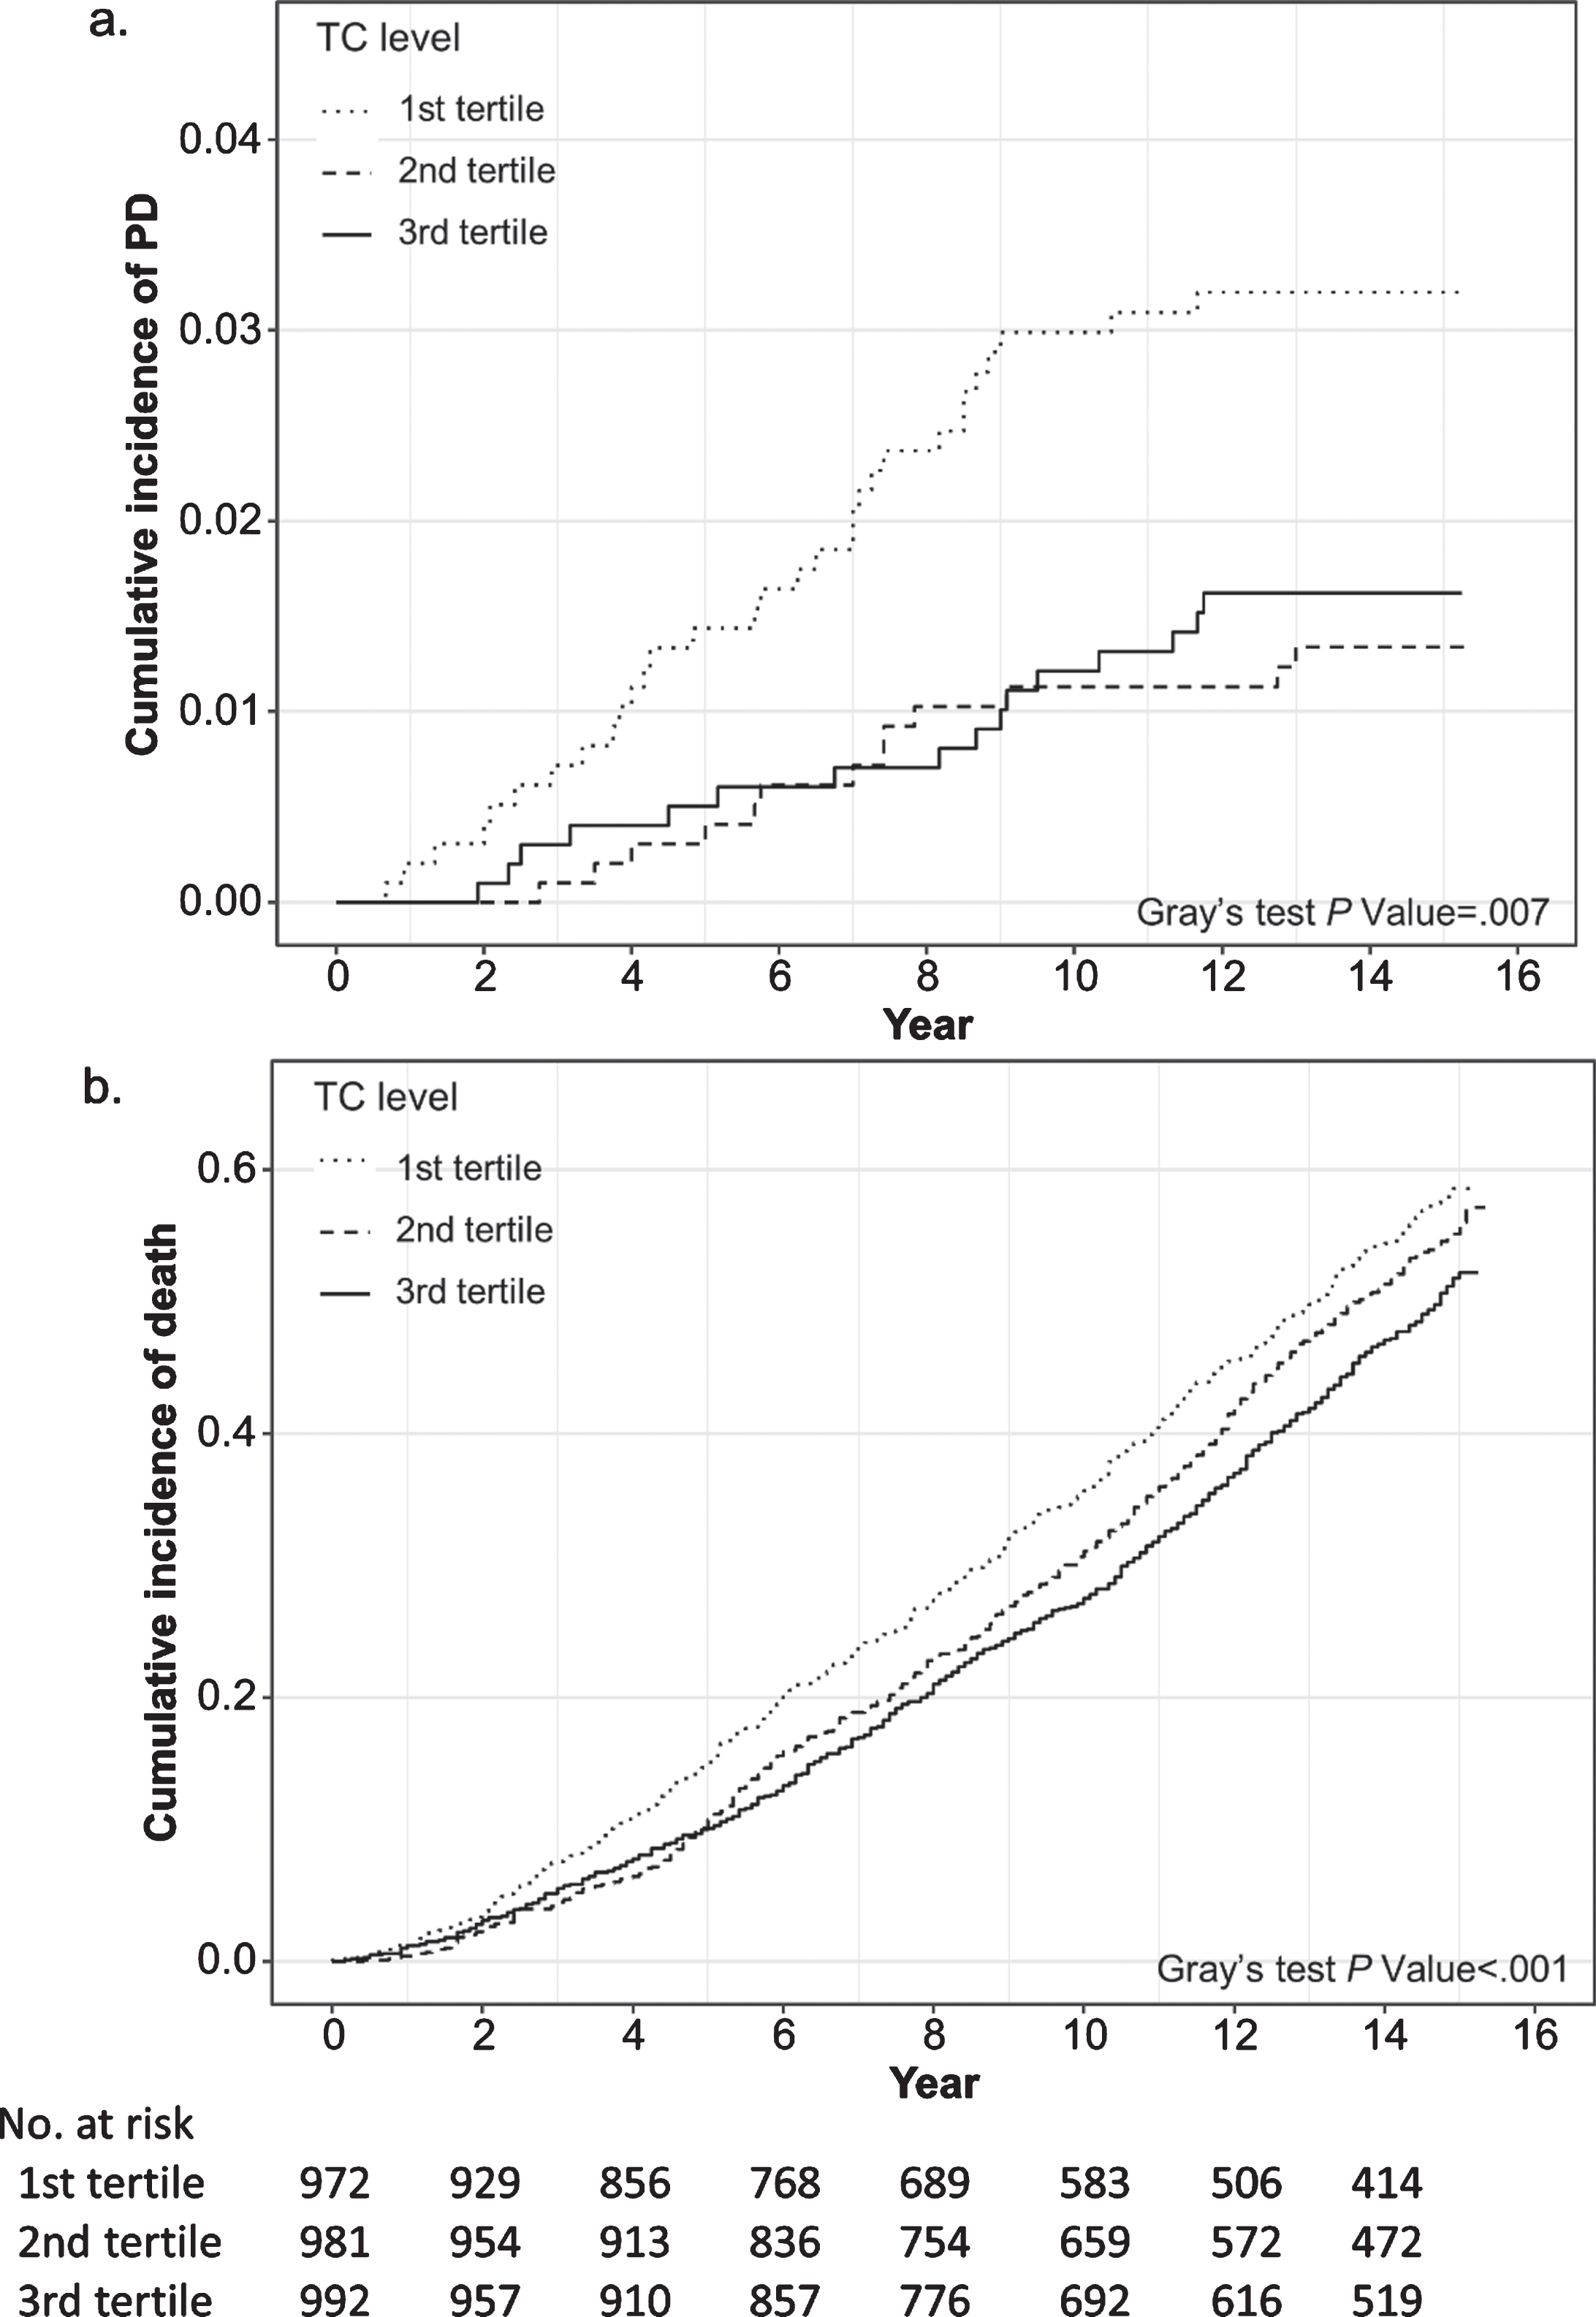
Cumulative incidence functions for (a) Parkinson’s disease and (b) death by baseline total cholesterol (TC) level (n = 2,948).
Adjusted cumulative incidence ratio for Parkinson’s disease (PD) and death by total cholesterol level at baseline (n = 2,948)
aEstimates were derived from absolute risk regression model, adjusting for baseline age, gender, race, smoking status and statin use at baseline, with the first tertile as the reference. bParticipants without Parkinson’s disease and not deceased.
Averaged residual a of total cholesterol at each year before and after Parkinson’s diagnosis
aEstimates (mg/dL) are the averaged differences between observed total cholesterol levels and their corresponding expected values had the patients not developed Parkinson’s disease.
In the analysis on change in TC levels before and after the diagnosis, we found a decreasing trend of TC spanning over the observational period from 9 years before to 6 years after PD diagnosis (Fig. 2). In this analysis, as the residuals were derived from individuals who did not develop PD during follow-up, their expected changes are by default 0 at any given time point (the reference line). Interestingly, TC level was lower, albeit non-statistically significant given our sample size, in PD cases even up to ∼9 years prior to PD diagnosis, and the difference became statistically significant at ∼4 years before PD diagnosis as shown in Fig. 2. By the year of diagnosis, PD cases on average had TC 9.44 mg/dL (95% CI: 3.31, 15.58) lower than their expected levels had they not developed PD, and at 6-years post diagnosis, the difference was 13.59 mg/dL (95% CI: 5.06, 22.12). While the pattern is clear, the overall linear trend was not statistically significant due to small sample size of PD cases across the long years of follow-up (P = 0.10). Similar observations were made in the sensitivity analysis when we analyzed only TC measured in plasma at clinic visit years 1, 2, 4, and 6 (Supplementary Figure 2). In the joint model analysis, the Cox sub-model regression showed that the results were not affected by differential missing mechanisms due to death or dropout between PD and non-PD cases (p = 0.56).
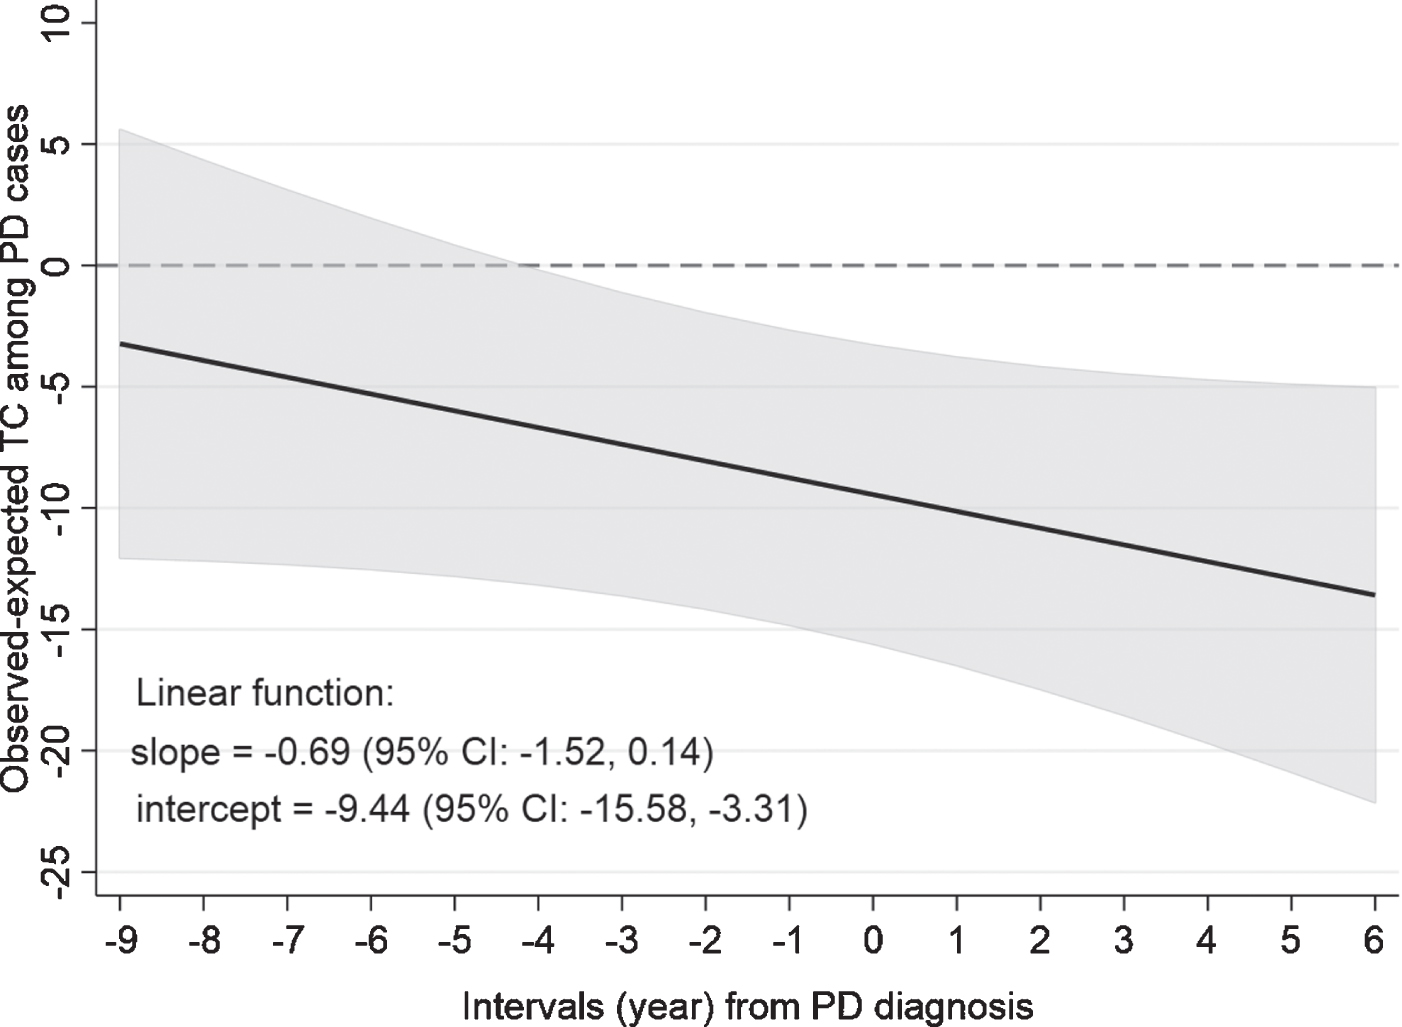
Changes in total cholesterol before and after Parkinson’s disease (PD) diagnosis. The dashed line (0) represents the expected total cholesterol levels in PD patients had they not developed PD. The solid line represents the difference between observed and expected values at any time point.
DISCUSSION
In this community-dwelling cohort of older US adults, we confirmed earlier reports that a higher TC level was associated with lower PD risk. Unlike previous studies, we accounted for the competing risk of death in the analysis, which is important in studying PD as the disease affects predominantly older adults. More importantly, we conducted, to the best of our knowledge, the first study which directly examine how TC changes over time before and after PD diagnosis. We found that the TC level in participants who later developed PD tended to be lower than those who did not, and the difference became statistically significant at ∼4 years before PD diagnosis and persisted thereafter. Though the statistical analysis of the decreasing trend itself was limited by sample sizes, our data suggest an accompanying decreasing trend in TC levels as PD progresses.
Cholesterol may play important and complex roles in maintaining brain health. Cholesterol is one of the major components of cell membranes, helping maintain the membrane function of neurons [40]. It is also crucial for synaptogenesis in the nervous system [41]. Further, cholesterol may modulate presynaptic dopamine balance in vitro and may be involved in alpha-synuclein aggregation and accumulation [14, 43]. Interestingly, some PD-related genetic loci, like PINK1, Parkin, and DJ-1 were reported to be associated with cellular cholesterol level [44–47]. Of note, brain cholesterols are mainly synthesized in situ and are relatively independent of their circulating levels due to the blood-brain barrier [48, 49]. Roles of circulating cholesterol in PD pathogenesis cannot be excluded because PD is increasingly considered as a systematic disorder and blood cholesterol may influence brain cholesterol metabolisms via complex feedback or pathways [50]. Interestingly, a recent study further reported that PD patients had lower levels of 24-OH cholesterol, a marker of brain cholesterol metabolite, but not its peripheral counterpart in circulation the 27-OH cholesterol [50]. Future studies are needed to investigate the roles of cholesterol in PD that are likely multifaceted and are yet to be fully understood.
Multiple cohort studies have examined the potential association of cholesterol with PD risk, and most found an inverse association [7–11, 50]. For example, the Rotterdam Study [9], Honolulu-Asia Aging Study [7], and ARIC study [8] all reported inverse associations of TC and/or LDL-C with PD risk. A few exceptions exist, however. Using biorepository survey data from Finland, Hu et al. reported a positive association of TC measured at 25–55 years of age with later risk for PD [12]. The inconsistency in part may be explained by the fact that cholesterol levels in the Finnish study was measured at early-mid adulthood whereas others were measured in mid-late adulthood. Interestingly, a similar pattern of study results was also found between cholesterol and Alzheimer’s disease (AD). AD risk was positively associated with mid-life TC [51, 52] but inversely with late-life cholesterol levels [53, 54]. These patterns suggest reverse causality that cholesterol levels decrease in older adults who are at a higher risk for PD or AD. The causality of cholesterol with PD risk was further examined by Mendelian Randomization (MR) analysis, but the data are not consistent. Fang et al. showed that a higher level of TC was related to a lower risk of PD in the MR analysis but Benn et al. reported no evidence for causality [6, 55].
Our study validated previous reports that higher TC was associated with a lower risk for PD. More importantly, it delineated for the first time the dynamic changes in TC before and after PD diagnosis. By comparing TC levels measured on an annual or biennial basis between individuals who later developed PD and those who did not, we found that up to 9 years prior to PD diagnosis, albeit not statistically significant, participants who later developed PD tended to have a lower TC than those who remained PD free during the follow-up. Further, TC level in PD cases declined over time, and at ∼4 years prior to PD diagnosis, it became statistically different from their expected values had the participant not developed PD. Our data therefore suggest decreasing TC may be one manifestation of PD subclinical progression, starting in the prodromal stage. This may in part explain the previous epidemiological observations of an inverse association of TC with PD. While our finding is compatible with reverse causation, it does not necessarily exclude the possibility that TC may play etiological roles in PD pathogenesis as others have hypothesized [4, 8]. Indirect evidence supports both arguments: PD patients were reported to have decreased cholesterol biosynthesis in fibroblasts [56]; on the other hand, the higher cholesterol level was reported to enhance the integrity of the lysosomal membrane, delaying cell apoptosis [57]. Therefore, the potential circular relationship between TC and PD is likely much more complex than we thought and should be investigated as such.
The role of statins in PD has also been controversial. In this study, we found that baseline statin use was associated with a higher risk of PD. This finding is consistent with that from some of the previous studies [8, 16], but in contrast to others [33]. However, this is not the focus of the current analysis, and the relationship should be carefully evaluated in future research.
Because our study participants were fairly old at the time of enrollment, we carefully accounted for the competing risk of death in the analyses that assessed baseline cholesterol levels in relation to PD risk. The risk estimates for mortality thus should be interpreted in this context. We found that TC/LDL-C was inversely associated with mortality in these elderly participants. This finding is consistent with some of the previous reports that total and LDL cholesterol are not associated with higher overall mortality or cardiovascular mortality in older adults, and in some cases the association was even inverse or U-shaped [58–60].
This study has several limitations. First, PD diagnosis was retrospectively adjudicated based on data collected over the follow-up, and misclassifications are inevitable. However, cholesterol assays in the cohort were entirely independent of the case adjudication process, therefore misclassifications are likely nondifferential. Second, the number of PD cases at any given time point in reference to PD diagnosis was relatively small, and the declining trend did not reach statistically significance. Also because of the relatively small sample size, we only controlled for selected major covariates in the analysis, we therefore cannot exclude potential impacts from residual confounding. Third, in our primary analysis, we converted serum TC measures in clinic years 8, 10, and 11 to plasma levels using published methods [36, 61] in order to analyze them together with plasma assays in the early years. Nevertheless, we conducted sensitivity analysis using only plasma TC measures in years 1, 2, 4, 6, and obtained similar results. Finally, the Health ABC study enrolled well-functioning participants who were fairly old at enrollment, thus our findings may not be readily generalizable to younger PD cases.
In summary, in this longitudinal analysis of older adults with repeated measures, we found TC level in PD cases tended to decrease over time, starting prior to PD diagnosis. This may in part explain the previously reported inverse association between blood cholesterol and PD. Future studies should confirm this observation and further investigate the potentially complex roles of cholesterol in PD development and progression.
Footnotes
ACKNOWLEDGMENTS
The submitted work is supported by a start-up fund from Michigan State University (GE100455) and the MSU CHM Kirk Gibson Parkinson’s Research Fund. The Health ABC study was supported by the National Institute on Aging (NIA), the National Institute of Nursing Research (NINR), the Intramural Research Program of the NIA/NIH and NIA contracts N01AG62101, N01AG62103, N01AG62106, NIA grant R01AG028050 and NINR grant R01NR012459.
CONFLICT OF INTEREST
The authors have no conflicts of interest to disclose.