
Abstract
Background:
Gait slowing is a common feature of Parkinson’s disease (PD). Many therapies aim to improve gait speed in persons with PD, but goals are often imprecise. How fast should each patient walk? And how do persons with PD benefit from walking faster? There is an important need to understand how walking speed affects fundamental aspects of gait—including energy cost and stability—that could guide individualized therapy decisions in persons with PD.
Objective:
We investigated how changes in walking speed affected energy cost and spatiotemporal gait parameters in persons with PD. We compared these effects between dopaminergic medication states and to those observed in age-matched control participants.
Methods:
Twelve persons with PD and twelve control participants performed treadmill walking trials spanning at least five different speeds (seven speeds were desired, but not all participants could walk at the fastest speeds). Persons with PD participated in two walking sessions on separate days (once while optimally medicated, once after 12-hour withdrawal from dopaminergic medication). We measured kinematic and metabolic data across all trials.
Results:
Persons with PD significantly reduced energy cost by walking faster than their preferred speeds. This held true across medication conditions and was not observed in control participants. The patient-specific walking speeds that reduced energy cost did not significantly affect gait variability metrics (used as proxies for gait stability).
Conclusion:
The gait slowing that occurs with PD results in energetically suboptimal walking. Rehabilitation strategies that target patient-specific increases in walking speed could result in a less effortful gait.
INTRODUCTION
Bradykinesia, or slowness of movement, is a cardinal feature of Parkinson’s disease (PD) apparent in walking [1] and other aspects of motor function [2, 3]. Gait impairment is among the most debilitating features of PD, as persons with PD often exhibit short, shuffling steps that slow walking speeds [1, 4–8] and have a significant associated risk of falls [9]. While some gait deficits are responsive to dopaminergic therapy (the gold-standard treatment for PD motor symptoms) [4, 10], rehabilitation is typically necessary to improve walking [11].
A key limitation to current gait rehabilitation approaches for persons with PD is that we understand relatively little about why persons with PD walk in the ways that they do. Restoring faster walking is a common rehabilitation goal in PD, but why should persons with PD walk faster? It is clear that the gait slowness observed in PD does not manifest from an inability to walk faster, as persons with PD often retain the capacity to walk as fast as adults without PD [6, 12]. This seemingly intrinsic preference for slower walking speeds raises uncertainty about how and whether persons with PD may benefit from walking faster beyond the aesthetic appeal of a faster gait.
In healthy walking, faster speeds (relative to those observed in persons with PD) are beneficial at least in part because these speeds minimize the energy expended to walk a certain distance (i.e., cost of transport) [13–15]. Indeed, energy optimization is considered a fundamental objective of healthy locomotor control [16–20], as many gait parameters appear tuned to minimize energy expenditure [15, 21–26]. However, the role of energy optimization in PD locomotor control is unclear. The gait slowness observed in persons with PD is often accompanied by an elevated cost of transport [27, 28], suggesting that preferred walking speeds may be energetically suboptimal in persons with PD. This hypothesis is supported by prior work showing that persons with PD expend more energy than control participants in other motor tasks [29]. Alternatively, it is possible that relationships between walking speed and energy expenditure may simply be altered by PD, and walking may be ubiquitously effortful across many speeds.
We also understand relatively little about the influence of dopaminergic therapy on walking speed/energy expenditure relationships in persons with PD. It is well-established that gait speed increases when persons with PD are optimally medicated [4, 10]; however, it is not known whether this leads to a less effortful gait, or whether speed/energy relationships are affected by dopaminergic medication. For example, we considered it possible that persons with PD may walk slower after medication withdrawal because another objective (e.g., improving stability) becomes more salient than minimizing energy expenditure, or possibly because persons with PD are less sensitive to the energy cost of walking and this is exacerbated when withdrawn from medication.
The goal of this study was to understand fundamental relationships between walking speed and energy expenditure in persons with PD. We asked three specific questions: 1) do persons with PD walk at energetically optimal speeds, 2) how could persons with PD change their gait to reduce energy expenditure, and 3) how does dopaminergic therapy affect gait optimization in persons with PD? Below, we offer several competing hypotheses that outline potential relationships between the slow walking speeds and high energy costs commonly observed in persons with PD.
Competing hypotheses
Hypothesis 1: Preferred walking speed in PD is slower but energetically optimal due to changes in speed/energy cost relationships that could be caused by PD-related motor symptoms (e.g., rigidity) [1–3] (Fig. 1A).
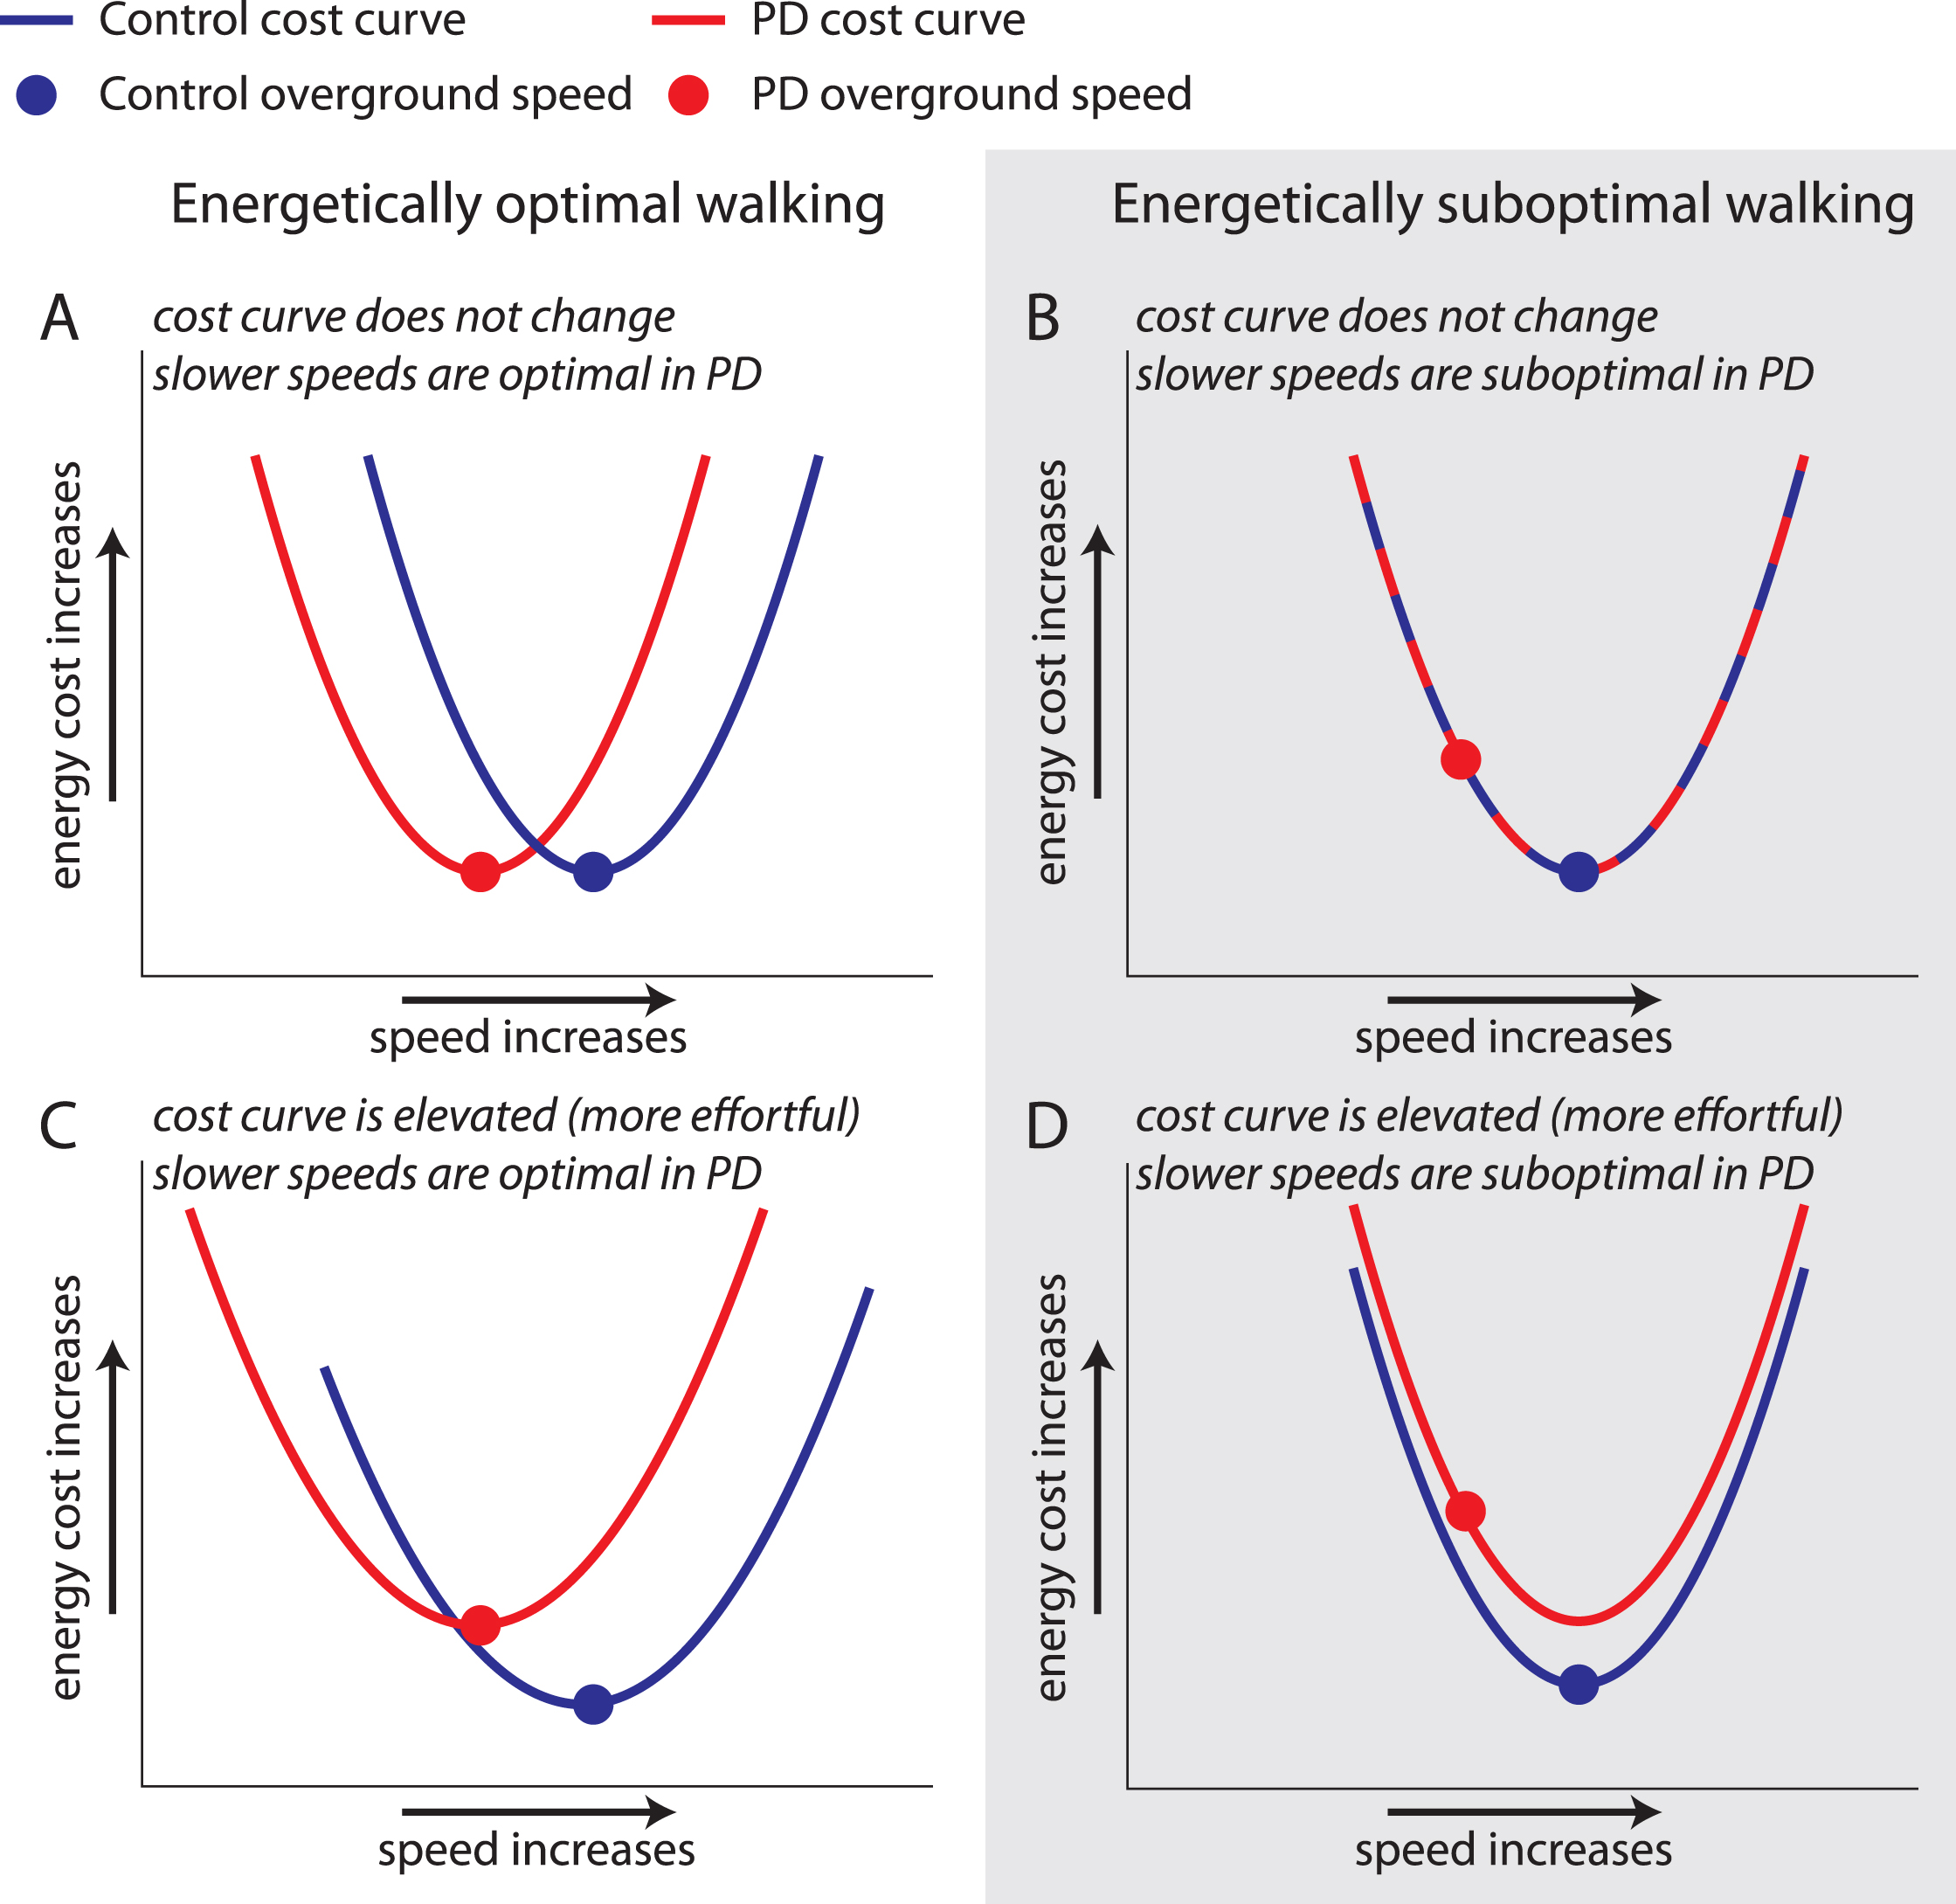
Possible outcomes for relationships between walking speed and cost of transport in PD. Cost curve for control (blue) and PD ON (red) groups with circles representing preferred speed. A) Cost curve is similar in Control and PD ON, but a slower preferred speed is optimal in PD. B) Cost curve is similar in Control and PD ON, but preferred speed is suboptimal in PD. C) Cost of walking is more effortful in PD, but preferred speed is optimal. D) Cost of walking is elevated in PD, and preferred speed is suboptimal.
Hypothesis 2: Preferred walking speed in PD is slower and energetically suboptimal, perhaps due to prioritization of another objective (e.g., maintaining stability) or decreased sensitivity to the energy cost of walking. However, speed/cost relationships are unchanged (Fig. 1B).
Hypothesis 3: Preferred walking speed in PD is slower but energetically optimal. However, the optimal walking pattern costs more energy in persons with PD than in controls (Fig. 1C).
Hypothesis 4: Preferred speed in PD is slower and energetically suboptimal, and walking costs more energy across all walking speeds in PD (Fig. 1D).
METHODS
Participants
Twelve persons (7M, 5F) with idiopathic PD diagnosed according to 2015 MDS Criteria [30] and 12 healthy adults (Control group; 4M, 8F) participated in this study. Participants reported no additional neurological, musculoskeletal, or cardiovascular conditions and were recruited from a convenience sample in the Johns Hopkins community. We determined each participant’s preferred overground walking speed (hereafter referred to as Preferred speed) as the mean speed across three overground walking trials executed prior to each testing session. The overground speed was measured over the middle 10 meters of a 20-meter walkway to eliminate periods of acceleration and deceleration. During all treadmill trials, participants walked on an instrumented split-belt treadmill (Motek, Amsterdam, NL) with handrail support. Participants were instructed to touch the handrails only lightly if needed and wore a safety harness that prevented falls but did not support body weight. All participants provided written informed consent in accordance with the Johns Hopkins Medicine Institutional Review Board prior to participation.
Participants with PD reported a stable dosage of at least one dopaminergic medication (carbidopa/levodopa, amantadine, selegiline or pramipexole) and a disease duration between 2 and 15 years since diagnosis. Persons with PD participated in testing sessions on two separate days: once while optimally medicated (PD ON) and once after 12-hour dopaminergic medication withdrawal (PD OFF). The session order was randomized. At the onset of each session, severity of PD motor symptoms was rated by a movement disorders neurologist (blinded to medication state) using Part III of the MDS-UPDRS [31] and the Hoehn and Yahr Rating. The Control group participated in a single testing session. In addition, we also obtained participants’ responses to several questionnaires assessing physical and mental state of being. Activities Balance Confidence (ABC) scale was employed to assess participants’ confidence in various physical activities encountered during the day. Depression and anxiety were assessed using the Hospital Anxiety and Depression Scale (HADS) and Hamilton Depression Rating (HDR) scale. Finally, we assessed general well-being with the Patient Health Questionnaire (PHQ-9) for both populations and a PD-specific Parkinson’s Disease Questionnaire (PDQ-39) for persons with PD.
Experimental setup and data collection
The experimental setup is shown in Fig. 2A. Kinematic data were recorded at 100 Hz using a three-dimensional motion capture system (Vicon, Oxford, UK) with retroreflective markers placed over the seventh cervical vertebra, tenth thoracic vertebra, jugular notch, xiphoid process, and bilaterally over the second and fifth metatarsal heads, calcaneus, medial and lateral malleoli, shank, medial and lateral femoral epicondyles, thigh, greater trochanter, iliac crest, and anterior and posterior superior iliac spines. Marker trajectories were filtered with a fourth-order low-pass (6 Hz) Butterworth filter. Participants wore comfortable shoes and form-fitting clothing.
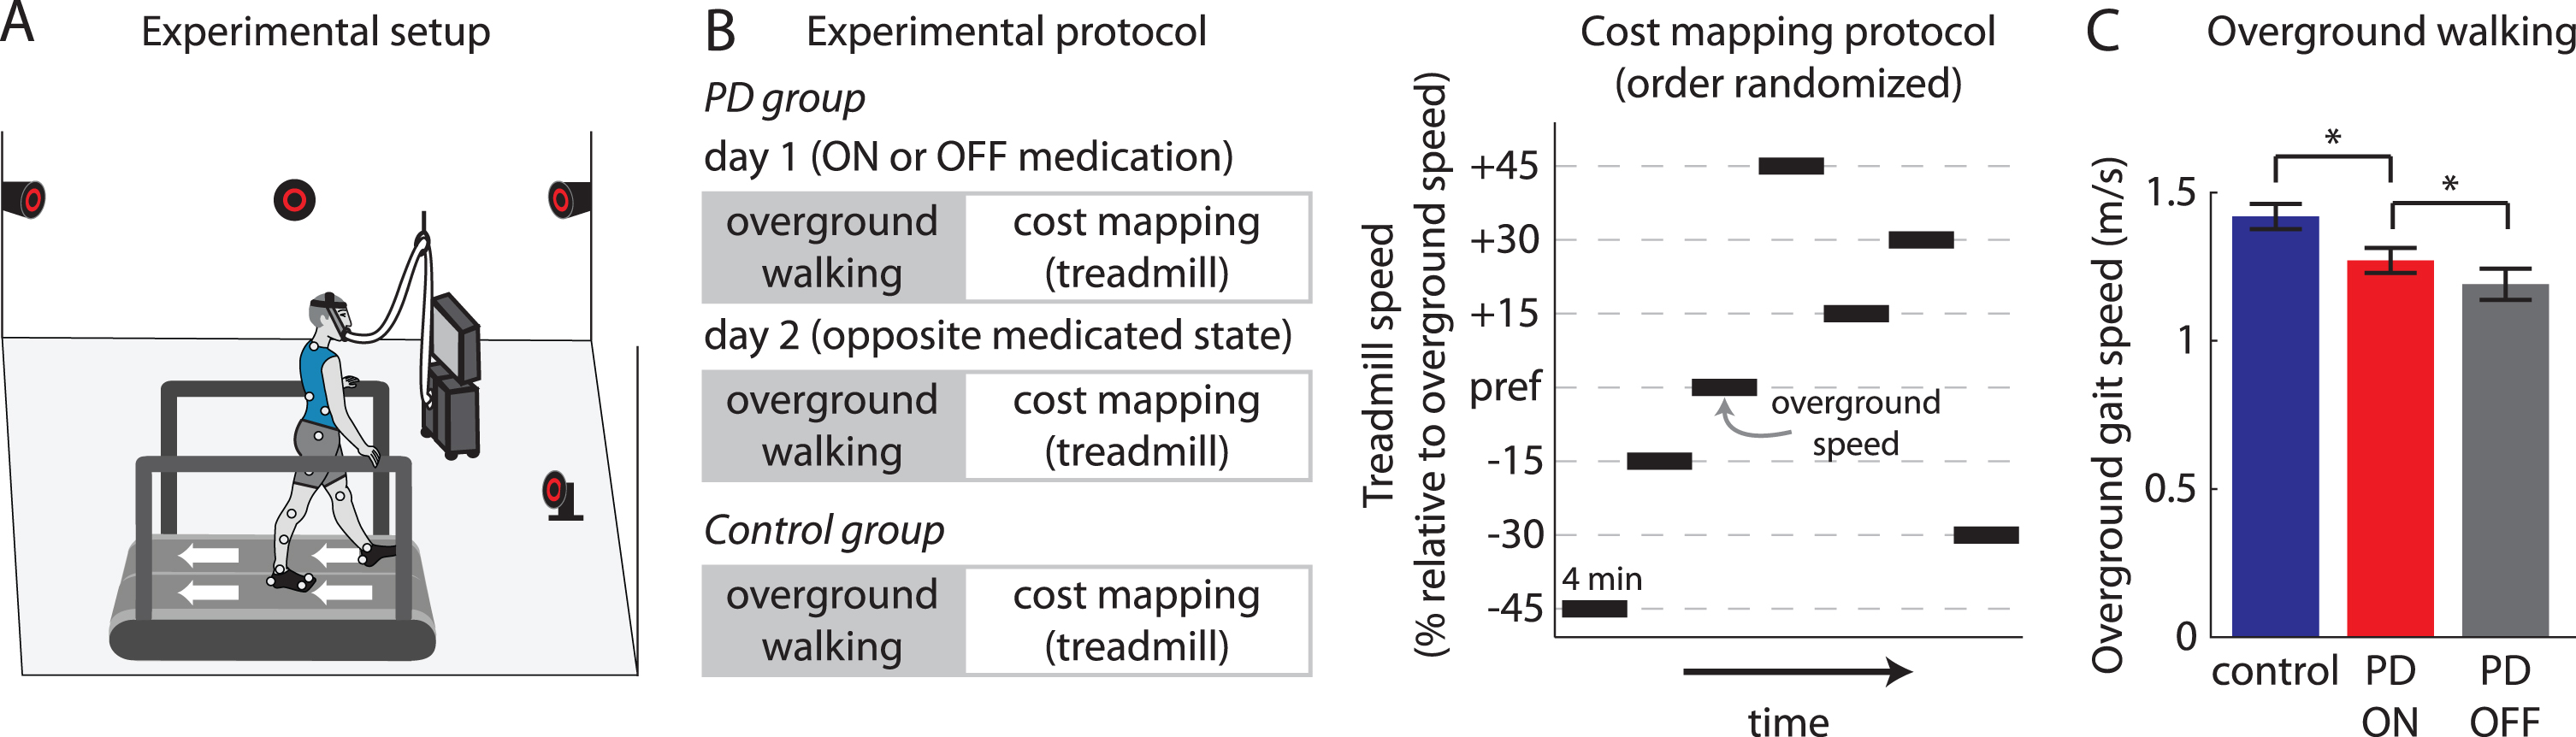
Lab setup for all experiments, experimental protocols, and overground walking speed measurements. A) Participants walked on a split-belt treadmill while kinematics were recorded using a three-dimensional motion capture system and metabolic measurements were taken using a metabolic cart. B) Experimental protocols for PD group (two testing sessions—ON and OFF dopaminergic medication—on separate days, order randomized) and Control group (one testing session). We first measured each participant’s preferred overground walking speed, and participants then underwent our cost mapping protocol. We conducted the cost mapping protocol on the treadmill, where we measured kinematics and metabolic data across several different walking speeds. C) Mean±SEM preferred overground gait speed across participants for Control (blue), PD ON (red) and PD OFF (grey) groups are shown. * indicates p < 0.025 (corrected for multiple comparisons). PD ON group was compared against the Control and PD OFF groups.
Metabolic energy expenditure was measured using expired gas analysis. Expired gases were collected and analysed using a TrueOne 2400 system (Parvomedics, Sandy, UT). This system warmed up for at least 30 minutes prior to data collection and was calibrated to manufacturer specifications. Participants fasted for at least four hours prior to metabolic testing to reduce effects of digestion. Baseline metabolic measurements were recorded during two minutes of relaxed standing. We calculated total metabolic power using the well-established equation as described below [32].
Total metabolic cost of transport (herein referred to as cost of transport) was calculated as the total metabolic power normalized to treadmill speed.
Protocol
We aimed to test participants at seven different treadmill speeds and recorded kinematic and metabolic data during each four-minute trial. Speeds included the Preferred speed and±15%, 30%, and 45% increments (Fig. 2B). All participants executed at least five different speeds, ensuring that all participants completed at least one trial faster than their Preferred speed. Walking speeds were randomized between participants, although for persons with PD, the order of speeds was consistent between the two sessions. All Control participants were able to walk at the +30% speed, while two participants in the PD group were either uncomfortable or unable to walk at this speed in at least one medication condition. Nine Control and six PD participants walked at the +45% speed, with three Control and six PD participants either uncomfortable or unable to walk at this speed.
Spatiotemporal measurements
Step length and step width were calculated as the distance between the lateral malleoli markers along the anteroposterior and mediolateral axes, respectively, at heel-strike. We calculated the coefficients of variation (CV) for step length and step width as measures of gait variability. Cadence (in steps/minute) was calculated from step time, which was calculated for each leg as the time (in seconds) between consecutive contralateral heel-strikes.
Data analysis
All step length, step width and cadence analyses were performed on the data accrued over the entire trial. Total metabolic power was calculated over the last minute of each trial to ensure steady-state measurement. We integrated metabolic power from the breath recorded closest to the onset of the last minute to the last breath recorded in the trial and divided by the time duration (in seconds) spanned by the breaths. For each participant, we identified the walking condition at which cost of transport was minimal within that testing session and this was termed the Optimal walking condition. All parameters of interest (treadmill speed, cost of transport, metabolic power, step length, step width, step length variability, step width variability and cadence) were selected for the Preferred walking condition (determined from preferred overground walking speed) and the Optimal walking condition (as described above) for each individual participant. We note that Optimal conditions here do not necessarily reflect global minima for each participant, but rather the condition with the lowest cost of all trials in a given session.
Statistical analysis
Descriptive statistics (means and standard deviations) were used to describe participant characteristics (Table 1). We assessed the normality of relevant data variables using the Shapiro-Wilk test before performing the undermentioned analyses. We used paired samples t-tests to compare Preferred speed, UPDRS, Hoehn and Yahr Rating, ABC, HDR, HADS, PDQ-39 and PHQ-9 between PD ON and PD OFF conditions (Table 1). We used independent samples t-tests to compare Preferred speed, baseline metabolic power during standing, age, body mass, ABC, HDR, HADS, PDQ-39, and PHQ-9 between the PD and Control groups (all between-group comparisons were made between PD ON and Control). We used a 2×2 condition (Preferred, Optimal) x group (PD ON, Control) mixed ANOVA to compare walking speed, cost of transport, metabolic power, step length, and cadence between Preferred and Optimal speeds and between groups and a 2×2 condition (Preferred, Optimal) x treatment (PD OFF, PD ON) repeated measures ANOVA to compare the same variables between Preferred and Optimal speeds and between treatments. We set α≤0.05 and applied Bonferroni post-hoc corrections for multiple comparisons when comparing more than two conditions. Because increased variability in spatiotemporal gait parameters has been linked to decreased gait stability [33–35], we performed secondary analyses using paired t-tests to compare step length variability and step width variability between Preferred and Optimal speeds in persons with PD. We also used nested linear mixed models with participant as a random effect to assess the effect of walking speed and group (PD ON, Control) on metabolic power. All analyses were performed using IBM SPSS Statistics for Windows Version 26.0, 2019.
Participant characteristics (data represented as group mean (SEM))
*p < 0.025 (PD ON vs. PD OFF, corrected for multiple comparisons). #p < 0.025 (Control vs. PD ON, corrected for multiple comparisons). UPDRS Motor, Part III of the Unified Parkinson’s Disease Rating Scale; ABC, Activities Balance Confidence; HDR, Hamilton Depression Rating; HADS, Hospital Anxiety and Depression Scale; PDQ, Parkinson’s Disease Questionnaire; PHQ, Patient Health Questionnaire. Note: HDR and PHQ-9 scores were not available for one PD OFF participant and the LEDD was not available for one participant with PD.
RESULTS
Persons with PD can walk faster than their preferred speed
All data variables were normally distributed as validated by the Shapiro-Wilk analysis. As expected, the Preferred speed in PD ON was significantly faster than PD OFF (t(11) = 3.26, p < 0.01) and significantly slower than Control (t(22) = 2.48, p = 0.01; Fig. 2C). Consistent with prior work [6], the slower Preferred speeds observed in the persons with PD were not due to an inability to walk faster. The fastest treadmill walking speeds that persons with PD could tolerate were significantly faster than the Preferred speeds when both ON (t(11) = 4.7, p < 0.001) and OFF (t(11) = 4.59, p < 0.001).
Preferred walking speeds are energetically suboptimal in persons with PD
We compared the relationships between walking speed and cost of transport between PD ON and Control (Fig. 3A). Note that not all participants could walk at all seven speeds; thus, there are missing data at the higher speeds in the left panel of Fig. 3A (this is also the case in Fig. 4A and Supplementary Figures 1 and 2). To provide additional transparency into these data, we show all individual data in the middle and right panels. We assessed whether Preferred speeds corresponded with energy optima in persons with PD and whether there were differences in Optimal costs of transport between PD ON and Control. ANOVA revealed a significant within-participant main effect of condition (F(1,22) = 18.17, p < 0.001) and a between-participant main effect of group (F(1,22) = 6.56, p = 0.018) on cost of transport. Post-hoc analyses revealed that the Preferred speed showed a significantly higher cost of transport than the Optimal speed within a given session (p < 0.001), and PD ON showed a significantly higher cost of transport than Control (p = 0.018). We did not observe a significant interaction between group and condition.
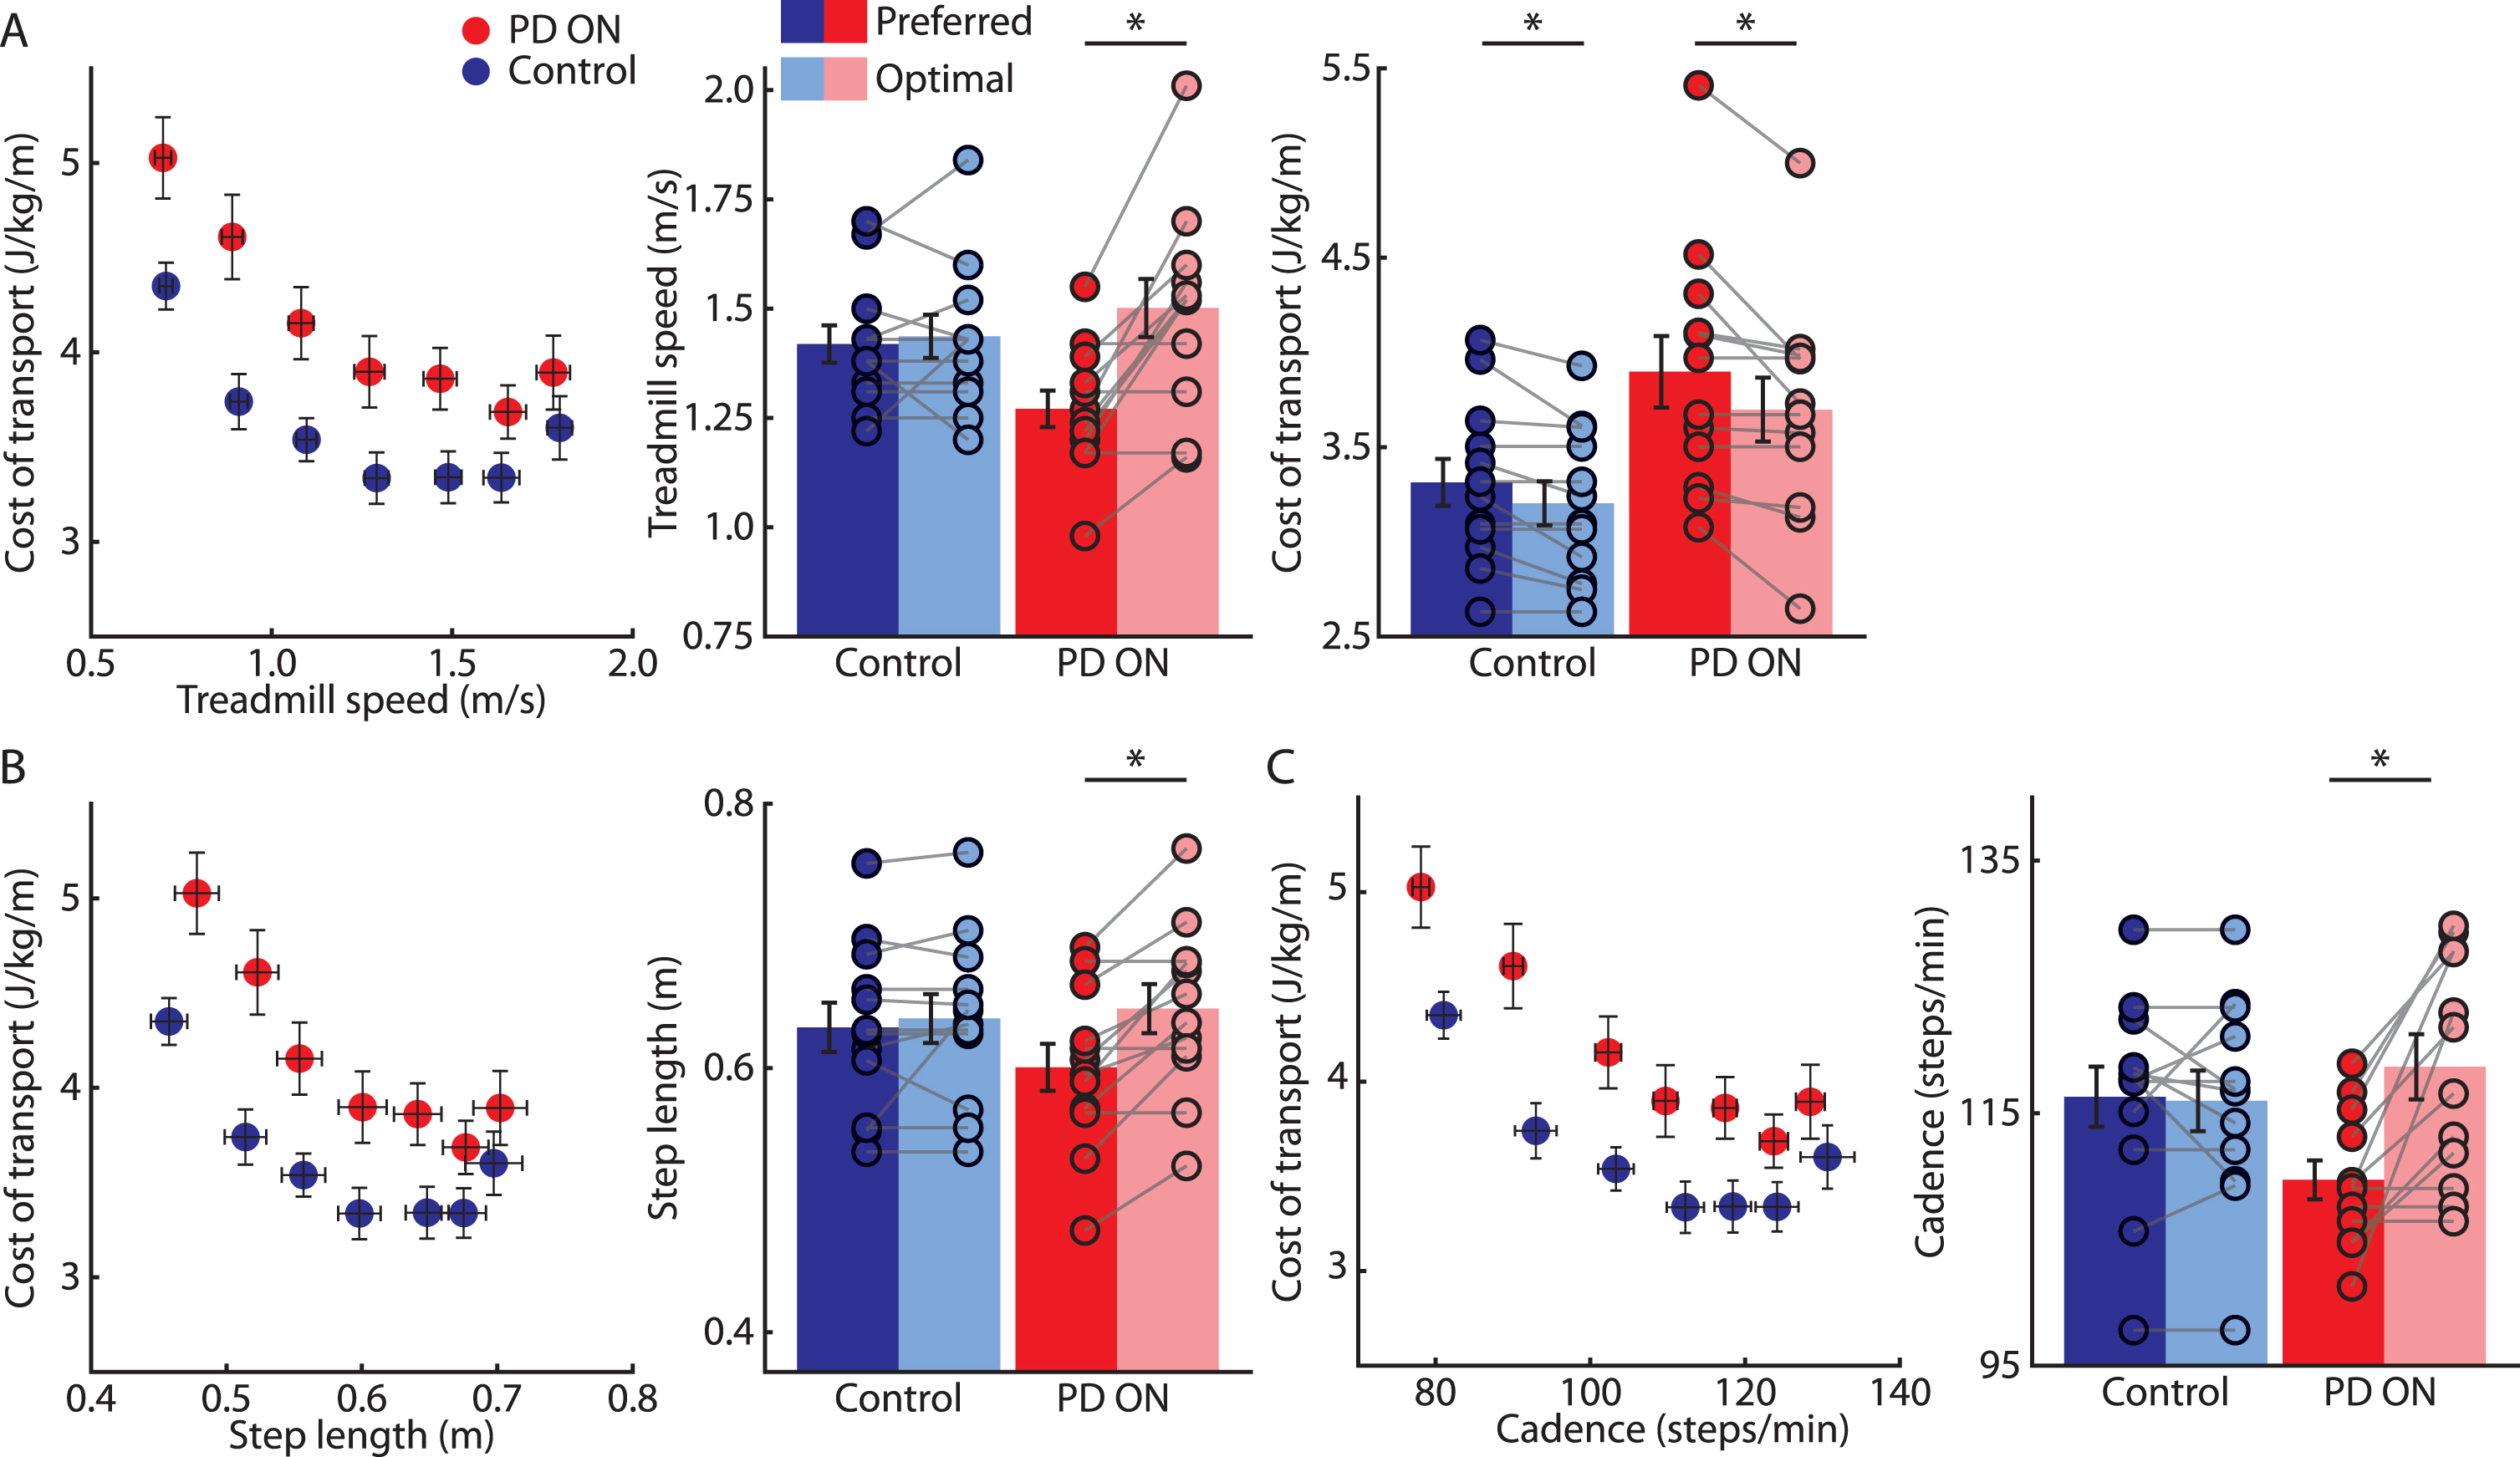
Comparisons between the Control and PD ON groups. A) Mean±SEM cost of transport plotted against treadmill speed across participants for Control (blue) and PD ON (red) groups (left). Mean±SEM treadmill speeds across participants (circles indicate individual participant data) for Preferred (dark colors) and Optimal (light colors) speeds for the Control and PD ON groups (middle). Mean±SEM cost of transport across participants for Preferred and Optimal speeds for the Control and PD ON groups (right). B) Mean±SEM cost of transport plotted against step lengths measured at the different treadmill speeds across participants for the Control and PD ON groups (left). Mean±SEM step length across participants for Preferred and Optimal speeds for the Control and PD ON groups (right). C) Mean±SEM cost of transport plotted against cadence measured at the different treadmill speeds across participants for the Control and PD ON groups (left). Mean±SEM cadence across participants for Preferred and Optimal speeds for Control and PD ON groups (right). * indicates p < 0.025 (corrected for multiple comparisons). To preserve figure clarity, only statistical indicators for within-group comparisons are shown on Figs. 3 and 4. Statistical results for between-group comparisons and interactions are described in the text.
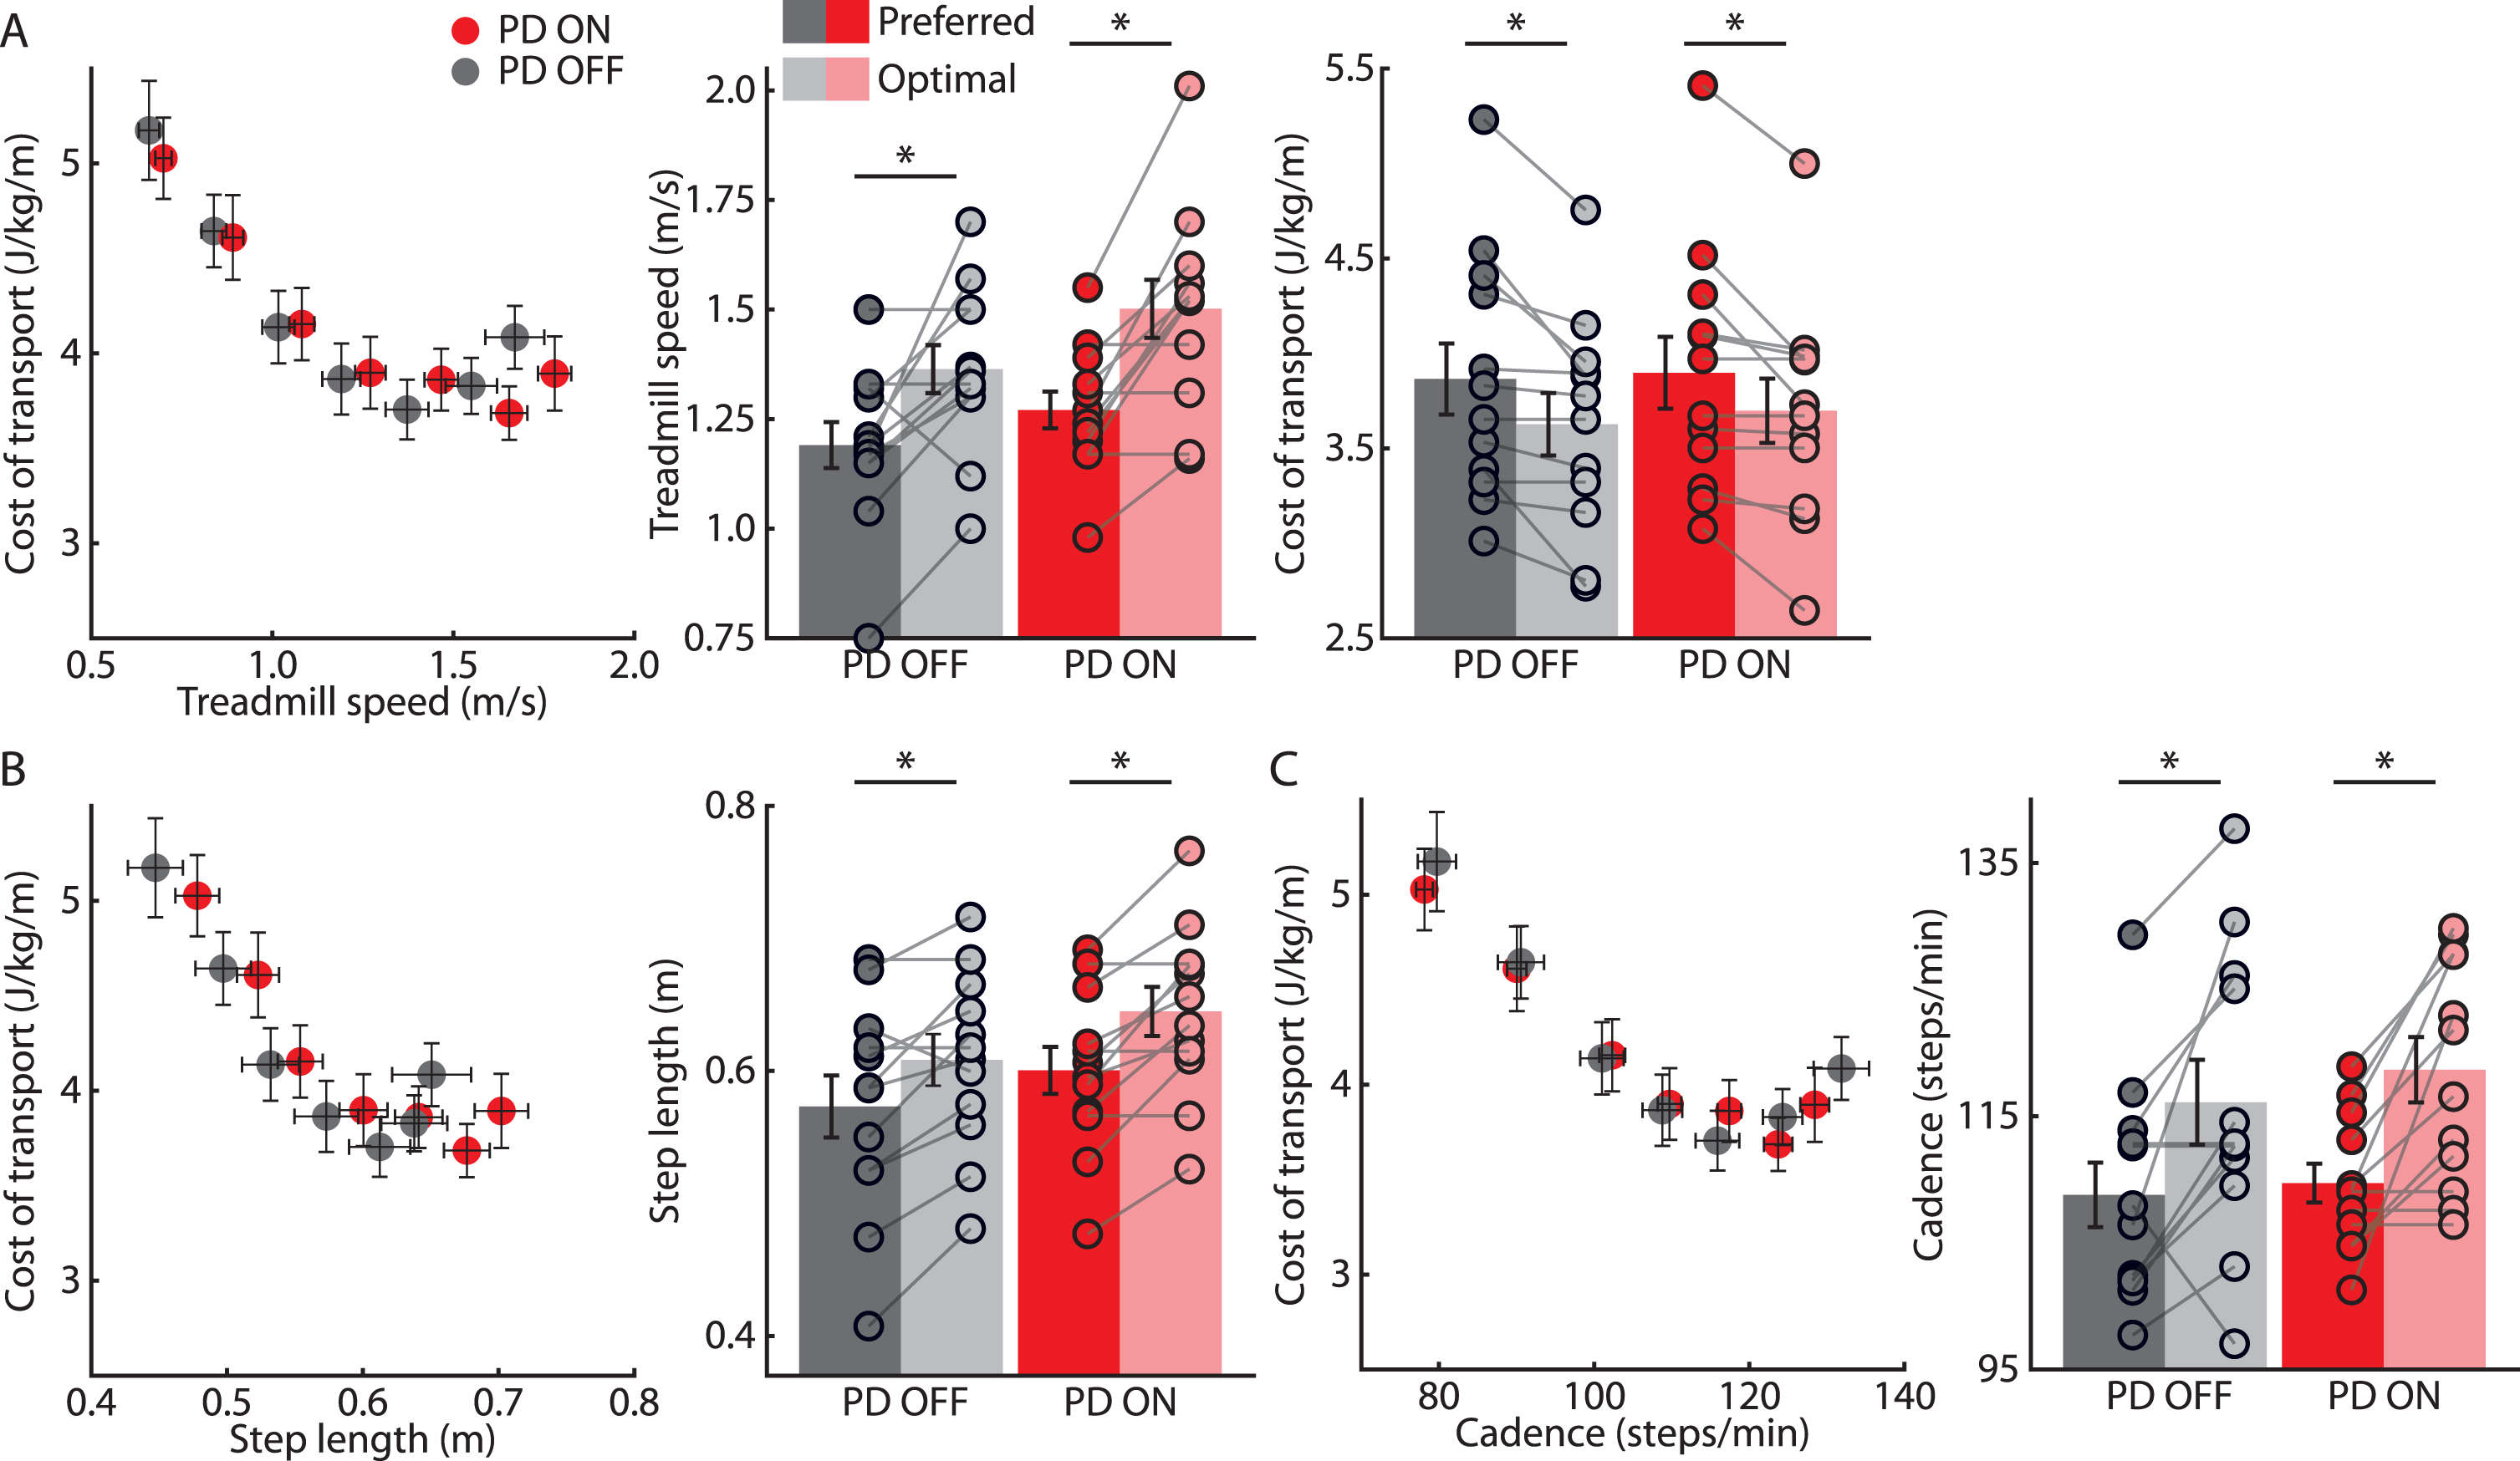
Comparisons between PD OFF and PD ON. A) Mean±SEM cost of transport plotted against treadmill speed across participants for PD OFF (gray) and PD ON (red) groups (left). Mean±SEM treadmill speeds across participants for Preferred (dark colors) and Optimal (light colors) speeds for PD OFF and PD ON (middle). Mean±SEM cost of transport across participants for Preferred and Optimal speeds for PD OFF and PD ON (right). B) Mean±SEM cost of transport plotted against step lengths measured at the different treadmill speeds across participants for PD OFF and PD ON (left). Mean±SEM step length across participants for Preferred and Optimal speeds for PD OFF and PD ON groups (right). C) Mean±SEM cost of transport plotted against cadence measured at the different treadmill speeds across participants for PD OFF and PD ON groups (left). Mean±SEM cadence across participants for Preferred and Optimal speeds for PD OFF and PD ON (right). * indicates p < 0.025 (corrected for multiple comparisons). Statistical results for between-treatment comparisons and interactions are described in the text.
Persons with PD can reduce energy expenditure by walking faster
We next investigated how the PD and Control groups could change their walking speed to achieve a less energetically costly gait (Fig. 3A). ANOVA revealed a significant main effect of condition (F(1,22) = 22.25, p < 0.001) and a significant interaction between condition and group (F(1,22) = 12.25, p = 0.002) on walking speed. Post-hoc analyses revealed that 1) Preferred speeds were significantly slower than Optimal speeds in PD ON (p < 0.001), 2) there was no consistent directional change between Preferred and Optimal speeds in Control, and 3) the Optimal speed in PD ON was not different from the Optimal speed in Control (all p > 0.4). The Control and PD ON speeds were approximately matched across all speeds (Figs. 3 and 4), and there was no significant main effect of group on the walking speeds tested (p = 0.48).
We then determined how different gait parameters that contribute to walking speed varied between conditions in the two groups. ANOVA revealed a main effect of condition (F(1,22) = 17.96, p < 0.001) and a significant interaction between condition and group (F(1,22) = 7.88, p = 0.01) on step length (Fig. 3B). Post-hoc analyses revealed that the step length at Optimal speed was significantly longer than step length at Preferred speed in PD ON (p < 0.001). No differences were observed between step lengths at Preferred and Optimal speeds in the Control group. Furthermore, no significant main effect of group was observed on step length (p = 0.63). ANOVA also revealed a significant main effect of condition (F(1,22) = 15.6, p = 0.001) and a significant interaction of condition and group (F(1,22) = 12.86, p = 0.02) on cadence (Fig. 3C). Post-hoc analyses revealed that cadence at the Preferred speed was significantly lower than cadence at the Optimal speed in PD ON (p < 0.001). Cadences at Preferred and Optimal speeds were not different in the Control group. No significant effect of group was observed on cadence (p = 0.45).
Persons with PD show elevated metabolic power at a variety of walking speeds
Moving beyond relationships between walking speed, spatiotemporal gait variables and cost of transport, we next investigated whether there were underlying differences in metabolic power between PD ON and Control. ANOVA revealed a significant main effect of condition (Supplementary Figure 1; F(1,22) = 9.25, p < 0.01) and significant interaction between condition and group (F(1,22) = 20.05, p < 0.001) on metabolic power. Post hoc analyses revealed that PD ON and Control groups showed similar metabolic power at Preferred speed (p = 0.65). While metabolic power was similar between the Optimal and Preferred speeds in Control (p = 0.32), PD ON showed significantly higher metabolic power at Optimal versus Preferred speed (p < 0.001) as well as Optimum speed in Control (p = 0.03).
We used nested linear modeling to confirm that, across a range of speeds, walking costs more energy in persons with PD when compared to neurologically healthy adults (this is in line with prior findings [27]). Significant main effects of speed (β= 2.8, t(186) = 21.91, p < 0.001) and group (β= 0.3, t(186) = 2.42, p = 0.016) were observed on metabolic power. We also confirmed that the ubiquitously higher metabolic power in PD ON was not due to a higher basal metabolic rate, as basal metabolic rate was not significantly different between PD ON and Control groups (t(22) = 1.38, p = 0.23).
Gait variability is not different between Preferred and Optimal walking speeds in persons with PD
Increased variability in step length and step width have been associated with additional risk of falls [33–35]. Therefore, we considered that persons with PD might adopt energetically suboptimal walking speeds to compensate for poor balance and stability. However, neither step length (t(11) = 0.16, p = 0.88) nor step width (t(11) = 0.22, p = 0.83) variability were significantly different between Preferred and Optimal speeds in PD ON (Supplementary Figure 2).
Dopaminergic therapy makes faster speeds and longer step lengths less effortful in persons with PD
Dopaminergic treatment produces modest improvements in both walking speed and step length in persons with PD [4, 10]. As we have shown that Preferred speeds are energetically suboptimal in persons with PD, we then sought to understand whether dopaminergic therapy 1) produced improvement in cost of transport across all speeds or 2) altered relationships between speed, cadence, step length, and cost of transport. In other words, we asked whether dopaminergic therapy reduced the cost of transport ubiquitously and whether the Optimal walking speed differed between medication states. ANOVA revealed a significant main effect of condition (F(1,11) = 12.44, p = 0.005) on cost of transport (Fig. 4A). Post-hoc analyses showed that cost of transport at Preferred speeds was again significantly higher than the cost of transport at Optimal speeds within a given session (p = 0.005). No significant main effect of treatment or interaction between treatment and condition were observed (all p > 0.51).
We further assessed the effect of dopaminergic therapy on the walking speed, step length and cadence that influenced the cost of transport. Significant main effects of condition (F(1,11) = 25.09, p < 0.001) and treatment (F(1,11) = 16.79, p = 0.002) were observed on speed of walking (Fig. 4A). Post-hoc analyses further demonstrated that 1) Preferred speeds were significantly slower in PD OFF compared to PD ON (p < 0.001), and 2) Optimal speeds were significantly faster than Preferred speeds regardless of medication status (p = 0.002), suggesting that persons with PD walk at energetically suboptimal speeds both when OFF and ON. No significant interaction between treatment and condition was observed (F(1,11) = 0.93, p = 0.36).
ANOVA revealed significant main effects of condition (F(1,11) = 27.86, p < 0.001) and treatment (F(1,11) = 6.96, p = 0.023) on step length (Fig. 4B). Post-hoc analyses further demonstrated that 1) step length at Preferred speeds was significantly shorter than step length at Optimal speeds (p < 0.0001), and 2) step length was significantly shorter when OFF compared to ON regardless of walking condition (p = 0.023). No significant interaction between condition and treatment was observed (F(1,11) = 0.63, p = 0.44). Lastly, ANOVA revealed significant main effect of condition (F(1,11) = 18.57, p = 0.001) on cadence (Fig. 4C). Post-hoc analyses revealed that cadence during Preferred speeds was significantly lower than during Optimal speeds (p = 0.001). No main effect of treatment or interaction between treatment and condition were observed (all p > 0.33).
DISCUSSION
In this study, we explored 1) the relationships between walking speed and energy expenditure in persons with PD as compared to older adults without PD, and 2) how these relationships were affected by dopaminergic medication, the gold-standard treatment for motor dysfunction in PD. First, we observed that persons with PD do not naturally walk at energetically optimal speeds and walking faster often resulted in a less effortful gait as measured by metabolic energy expenditure. Participants achieved an optimal speed by increasing both step length and cadence concurrently relative to their preferred overground pattern. Second, gait was consistently more effortful in persons with PD when compared to the Control group across all speeds tested. Finally, withdrawal of dopaminergic medication made faster speeds and longer steps more energetically costly. In sum, these findings indicate that persons with PD can lessen energy expenditure by walking faster. However, because energy expenditure (when normalized to distance traveled) is not monotonically related to walking speed but rather exhibits a characteristic U-shaped relationship, it is important that interventions aiming to lessen energy expenditure first identify an optimal target speed and not simply emphasize faster walking more generally.
Why do persons with PD walk at slow speeds that are more energetically costly despite having the ability to walk faster? One possibility could be that persons with PD prioritize stability at the expense of increased energy cost. Gait is often highly variable and balance is often impaired in persons with PD, resulting in increased risk of falls [9, 36]. Indeed, the slowed walking speeds that are characteristic of PD gait may be in part compensatory to reduce displacement of the center of mass outside of the base of support [37–39]. We measured step length and step width variability—two often-used measures of gait stability that are linked with falls [33–35]—to investigate whether persons with PD preferred walking patterns that reduced variability. We did not observe differences in step length or step width variability between Preferred and Optimal speeds, contrary to the idea that persons with PD may adopt a preferred walking speed that optimizes stability. Moreover, this was not dependent on medication status.
We also considered that persons with PD may prefer slower walking speeds due to a change in sensitivity to the energetic costs of movements. Prior work has suggested that bradykinesia may represent a shift toward conserving energy at the expense of movement vigor [40, 41]. However, it is important to consider that gait speed and energy expenditure (in terms of cost of transport) are not monotonically related [14]. Therefore, while gait slowness would be expected to result in reduced metabolic rate, cost of transport would be expected to increase. This aligns with the observations of the current study. It is possible that bradykinetic gait results from a desire to reduce metabolic rate at potential expense to overall cost of transport or, alternatively, that other factors such as loss of implicit motivation [29, 42] influence the gait slowness commonly observed in PD.
Our study emphasizes the importance of understanding how gait changes targeted through rehabilitation affect the patient. For example, training approaches that use visual and/or auditory stimuli to increase step length or gait speed often improve performance within a training session but show poor retention beyond the training environment [6, 44]. Similarly, some approaches such as LSVT BIG emphasize “bigger” movement but do not control the magnitudes of these changes [45–47]. These approaches may not result in lasting improvement because patients achieve the training goals by using movement patterns that they were already capable of producing prior to training but that possess little inherent value to the patient (e.g., walking speeds that are too fast or movements that are excessive in magnitude may be energetically costly). Development of therapies that target specific movement parameters with observable benefit to the patient (e.g., lessened energy cost, improved stability) may be effective in providing personalized rehabilitation for persons with PD that results in lasting improvement. The extent to which individualized rehabilitation can optimize walking in PD beyond the effects of dopaminergic medication requires further exploration.
Persons with PD walk at energetically expensive walking patters across a range of speeds. This uniform shift in energy cost is not explained by a higher rate of energy consumption at baseline but is rather due to an increase in the cost of moving. Rigidity is common in persons with PD, with prior studies demonstrating increased co-contraction of muscles during walking that is unaffected by medication status [48, 49]. It is possible that rigidity increases the cost of walking, dopaminergic therapy does not necessarily offer relief to underlying rigidity, and thereby walking remains energetically expensive. Furthermore, previous work has also suggested that gait impairment in persons with PD may be related to proprioceptive deficits [50, 51]. This may contribute to the results observed here regarding the slow, suboptimal gait speeds observed in the participants with PD; however, this remains speculative as we did not collect direct measures of proprioception.
Limitations
While we explored changes in energy cost with speed, step length and cadence were unconstrained. Although we observed that persons with PD showed similar step lengths and cadences as healthy adults at matched speeds, these combinations may not necessarily be optimal in PD. A further investigation into how changes in step length within a constrained speed affect cost of transport in persons with PD is necessary. It is possible that scaling of step length and cadence with speed in persons with PD while on dopaminergic medication is regulated by treadmill walking, as treadmill training has shown to improve stride length and gait speed in persons with PD [52]. It will be important to understand whether these findings (and those regarding the costs of transport associated with different walking speeds in persons with PD) translate to overground walking. In addition, our single-center study design limited generalizability of our findings, and our small sample size limited our ability to consider the contribution of factors including age, PD disease stage, and duration to the results. Finally, while there is prior evidence that persons with PD have higher co-contraction during walking and that this may contribute to energetically expensive walking patterns, we did not measure muscle activity during this study to assess potential contributions of co-contraction or rigidity to cost of transport or other gait parameters.
Summary
Persons with PD walk with suboptimal and energetically expensive walking patterns. Here, we showed that persons with PD can reduce the energy cost of walking by walking faster. Furthermore, dopaminergic medication reduces the effort required to walk faster, specifically by making longer step lengths less costly. Our findings suggest that gait rehabilitation interventions for persons with PD could simultaneously restore faster and less effortful walking by targeting patient-specific, energetically optimal walking speeds.
CONFLICT OF INTEREST
The authors declare no relevant conflicts of interest.
Footnotes
ACKNOWLEDGMENTS
The authors thank Dr. Prasad Sarangapani for helpful comments on the manuscript.
Funding sources: NIH grants K23 AG059891, L30 AG064696, and U01 NS102035 to AYP, NIH grants R01 MH119086 and R01 HD097619 to VSC, NIH grant R21 AG059184 to RTR.