
Abstract
Background:
Previous studies have highlighted serum uric acid as a putative idiopathic Parkinson’s disease (iPD) biomarker. Only one study, so far, showed higher levels of serum uric acid in leucine-rich repeat kinase 2 (LRRK + 2) carriers compared to those who developed PD, however a longitudinal comparison between LRRK2 + PD and healthy controls (HC) has not been performed.
Objective:
The aim of this study was to determine whether there are longitudinal differences in serum uric acid between iPD, LRRK2 + PD and HC and their association with motor and non-motor features.
Methods:
Longitudinal data of uric acid of 282 de novo iPD, 144 LRRK2 + PD patients, and 195 age-matched HC were obtained from the Parkinson’s Progression Markers Initiative (PPMI) database. We also used longitudinal Montreal Cognitive Assessment (MoCA), Movement Disorder Society–Unified Parkinson’s Disease Rating Scale part III (MDS-UPDRS-III), Geriatric Depression Scale (GDS) scores, and DaTSCAN striatal binding ratios (SBRs).
Results:
Longitudinal uric acid measurements were significantly lower in LRRK2 + PD patients compared to HC up to 5 years follow-up. There was no significant impact or correlation of adjusted or unadjusted uric acid levels with MoCA, MDS-UPDRS III, or GDS scores, the presence of RBD or DAT-SCAN SBRs.
Conclusion:
LRRK2 + PD group had significantly lower uric acid concentrations compared to HC after adjusting for age, sex and baseline BMI up to 5 years follow-up. There were no significant associations between uric acid levels and indices of disease severity. These findings identify serum uric acid as a marker linked to LRRK2 + PD.
Keywords
INTRODUCTION
Parkinson’s disease (PD) is a usually sporadic neurological disease that displays motor and non-motor signs, with known and unknown environmental and genetic risk factors [1]. Mutations in the leucine-rich repeat kinase 2 (LRRK2) gene are the most common known genetic cause of both autosomal dominant and idiopathic PD (iPD), with a phenotype largely indistinguishable from iPD [2]. Although genetic testing and patient’s family history help to differentiate between LRRK2 + PD and iPD, biomarkers that can distinguish between them have yet to be identified [3]. Biomarkers could be used to determine the effectiveness of neuroprotective strategies in clinical trials and, their association with disease progression, as well as differentiate between LRRK2 + PD and iPD. Furthermore, biomarkers specific or differentially present in LRKK2 + PD may give clues to the underlying disease pathobiology. Hence, there is a great need for the development of biomarkers for LRRK2 + PD.
Uric acid is an endogenous purine metabolite with antioxidant and neuroprotective properties for dopaminergic neurons [4]. Emerging evidence suggest its role as a predictive biomarker both for reduced risk and slower progression of iPD [5–8]. Many controlled studies and a recent meta-analysis have shown that low serum uric acid levels were associated with iPD [9–16]. A previous study from our group has concluded that levels of uric acid are especially low in manifesting carriers of the p.A53T SNCA mutation, compared to healthy controls (HC), potentially due to the more severe nature of the disease in this specific genetic cohort [17]. One cross-sectional study showed higher levels of uric acid in LRRK2 carriers compared to those who developed PD in each of three independent cohorts [18]. To date, there have been no attempts to longitudinally compare uric acid levels between LRKK2 + PD and HC, and examine the association of these levels with clinical features, such as motor or non-motor function (e.g., cognition, depression, REM-sleep behavior disorder) and imaging variables. Such examination will provide much needed knowledge regarding the potential of uric acid as a progression marker of the LRKK2 + PD cohort.
The Parkinson’s Progression Markers Initiative (PPMI) is an ongoing observational, longitudinal cohort study of clinical, imaging and biochemical parameters in de novo PD patients, healthy controls (HC) and carriers of the most common PD related genetic mutations. The aim of this study was twofold: 1) to determine for the first time whether there are baseline and longitudinal differences in serum uric acid between iPD, LRRK2 + PD and HC enrolled in PPMI, 2) to examine the associations of serum uric acid with specific motor, non-motor features (cognition, depression REM-sleep Behavior disorder) and DaTSCAN striatal binding ratios (SBR) of these patients.
MATERIALS AND METHODS
Participants
PPMI enrolled patients with early, untreated (de novo) PD as well as HC of similar age and sex between June 7, 2010, and May 27, 2013. The study was expanded in 2014 to include genetic cohorts with PD as well as non-manifesting carriers of mutations in the SNCA, LRRK2, and GBA genes. We obtained data from 421 de novo iPD patients and 196 HC from the PPMI database. We have reviewed data regarding GBA and LRRK2 variants in the PPMI de novo PD cohort. We also removed 44 PD carriers of GBA mutations or variants and 8 PD carriers of LRRK2 variants in order to eliminate the impact of genetic forms on uric acid levels in this cohort (remaining iPD patients N = 369). Finally, available data of 282 de novo iPD,144 LRRK2 + PD patients and 195 age-matched HC were analyzed from the PPMI database (http://www.ppmi-info.org/data). Inclusion criteria were 1) age over 30 years; 2) PD diagnosis recently made within the last 24 months (for iPD only); 3) PD drug naivety (for iPD only); 4) PD diagnosis made within the last 84 months (for LRKK2 + PD); 5) DAT scan positivity; 6) availability of uric acid levels in the database. This article is based on the data obtained at baseline, visits 4, 6, 8, 10. and 12 and analyzed for serum urate (http://ppmi-info.org/study-design). Our findings reflect data collected as of 20 April of 2020, from the PPMI database (http://ppmi-info.org). No more data were added due to COVID 19 pandemic restrictions for the transition visits in the expanding PPMI2. According to PPMI2 protocol, biochemical measurements, including uric acid levels, will be performed only during screening for new participants and not in follow up visits for already existing subjects.
Standard protocol approvals, registrations, and patient consents
The present study was conducted in accordance with the ethical principles of the declaration of Helsinki. Signed informed consent was obtained from all participants recruited. The study was approved by the Scientific Board of all PPMI sites involved (including the Scientific Board of Attikon and Eginition hospitals). For up-to-date information on the study, visit http://www.ppmi-info.org.
Serum uric acid collection/analysis and genetic testing
Biochemical analyses of uric acid have been carried out in Covance laboratories in a uniform fashion, as per the study protocol. Genetic testing for the LRRK2 gene was performed either at the individual sites or through a central recruitment initiative via a Clinical Laboratory Improvement Amendments (CLIA) or other certified testing laboratory. The LRRK2 genetic testing included G2019S and R1441G/C, N1437H mutations.
Clinical assessment measures
The clinical assessment battery is described on the PPMI website. In brief, motor assessment was performed with the Movement Disorder Society–sponsored revision of the Unified Parkinson’s Disease Rating Scale part III (MDS-UPDRS III). Non-motor assessment comprised screening for cognition with the Montreal Cognitive Assessment (MoCA) Scale, depression with the Geriatric Depression Scale (GDS) and REM-sleep Behavior disorder using the REM Sleep Behavior Disorder Screening Questionnaire (RBDSQ).
DaTSCAN data
DaTSCAN ([123I]-FP-CIT SPECT) [(123) I-2β-carbomethoxy-3β-(4-iodophenyl)-N-(3-fluoropro-pyl) nortropane single photon emission computed tomography] imaging was acquired at PPMI imaging centers as part of the PPMI imaging protocol at baseline and years 1, 2, and 4 and sent to the imaging core for processing and calculation of striatal binding ratios (SBR). Imaging results were analyzed according to the imaging technical operations manual (http://ppmi-info.org/). Imaging data were presented as the regional specific binding ratio of the specific binding ratio by striatal subregion (putamen, caudate nucleus). Contralateral/ipsilateral striatum (putamen/caudate nucleus) was defined as the side contralaterally/ipsilaterally to the most affected side in terms of clinical impairment at baseline, respectively.
Statistical analysis
Continuous variables are presented as mean (standard deviation), while categorical variables are pre-sented as numbers. Due to skewed data and small samples sizes, non-parametric testing Kruskal-Wallis test with Dunn’s post-hoc test was performed to assess group differences. Uric acid levels were adjusted for sex, age, disease duration and baseline body mass index (BMI). Spearman’s correlation coefficient was used to assess the correlation between serum uric acid levels on one hand and MoCA, MDS-UPDRS III, RBD and GDS totals, on the other. A linear mixed effects model, using Satterthwaite’s method for p-value estimation, was constructed for the assessment of the effects of time (visit number) and patient’s status in adjusted uric acid levels during all observations, with subjects as the random effect. Finally, in order to assess the putative impact of uric acid levels on clinical progression of the LRRK2 + group and determine whether high and low uric acid groups follow different trajectories, we compared high serum uric acid level- and low serum uric acid level- subgroups (at baseline) in terms of motor deterioration (UPDRS III score at baseline, UPDRS III on year 2). A two-sided p value of less than 0.05 was considered statistically significant. Statistical analysis was performed with the Statistical Package for Social Sciences software (IBM Corp. Released 2012. IBM SPSS Statistics for Windows, Version 21.0. Armonk, NY: IBM Corp.) and GraphPad Prism 5.
RESULTS
Table 1 shows clinico-demographic characteristics of study participants. There was a statistically significant difference in adjusted uric acid levels in the overall model due to disease status, but not due to time (interaction p = 0.056, status p = 0.001, visit number p = 0.579).There was a statistically significant decrease in uric acid at baseline, visits 4, 6, 8, 10 and 12 in LRRK2 + subjects compared to HC (p-values 0.0002, 0.09, 0.0005, 0.038, 0.007, 0.039, respectively) as shown in Fig. 1. There was a statistically significant decrease in baseline MoCA scores in PD patients (both types) vs HC and between LRRK2 + and iPD patients at baseline (Table 1, Fig. 2), but not at visit 6. No significant correlations were found between uric acid and MoCA or MDS-UPDRS III scores (all pairs had absolute values of rho coefficients below 0.06) after Bonferroni correction (Supplementary Table 1).
Clinico-demographic characteristics in idiopathic and LRRK2 + PD patients vs healthy controls
achi-square test. bKruskal-Wallis Test. cMann-Whitney Test. dNot enough data available BMI, body mass index; MoCA, Montreal Cognitive Assessment test; MDS-UPDRS III, Movement Disorder Society-Unified Parkinson’s Disease Rating Scale III; HC, healthy controls, iPD, idiopathic Parkinsons Disease, y, years Data presented as mean (Standard deviation).
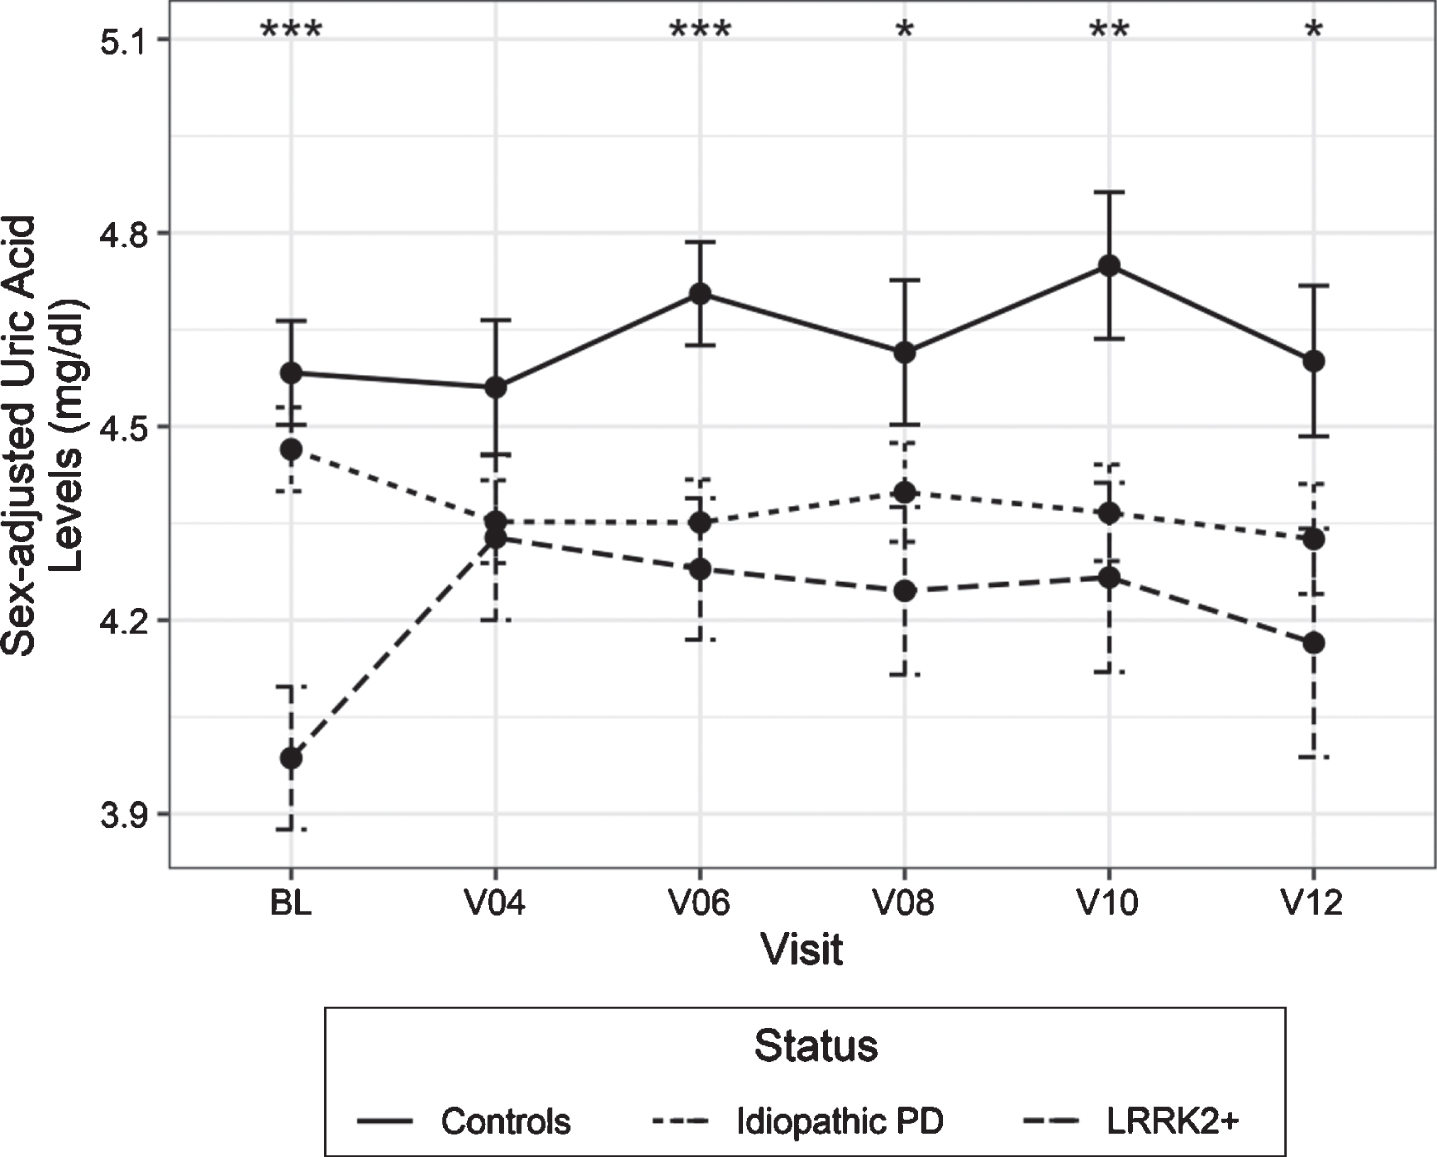
Longitudinal measurements of adjusted uric acid levels in idiopathic and LRRK2 + PD patients vs healthy controls. Statistical analysis was performed using a linear mixed effects model at different available time points BL, V04, V06, V08, V10 and V12 correspond to Years 0, 1, 2, 3, 4, 5 Error bars indicate 95% confidence intervals. *p < 0.05, **p < 0.01, ***p < 0.001.
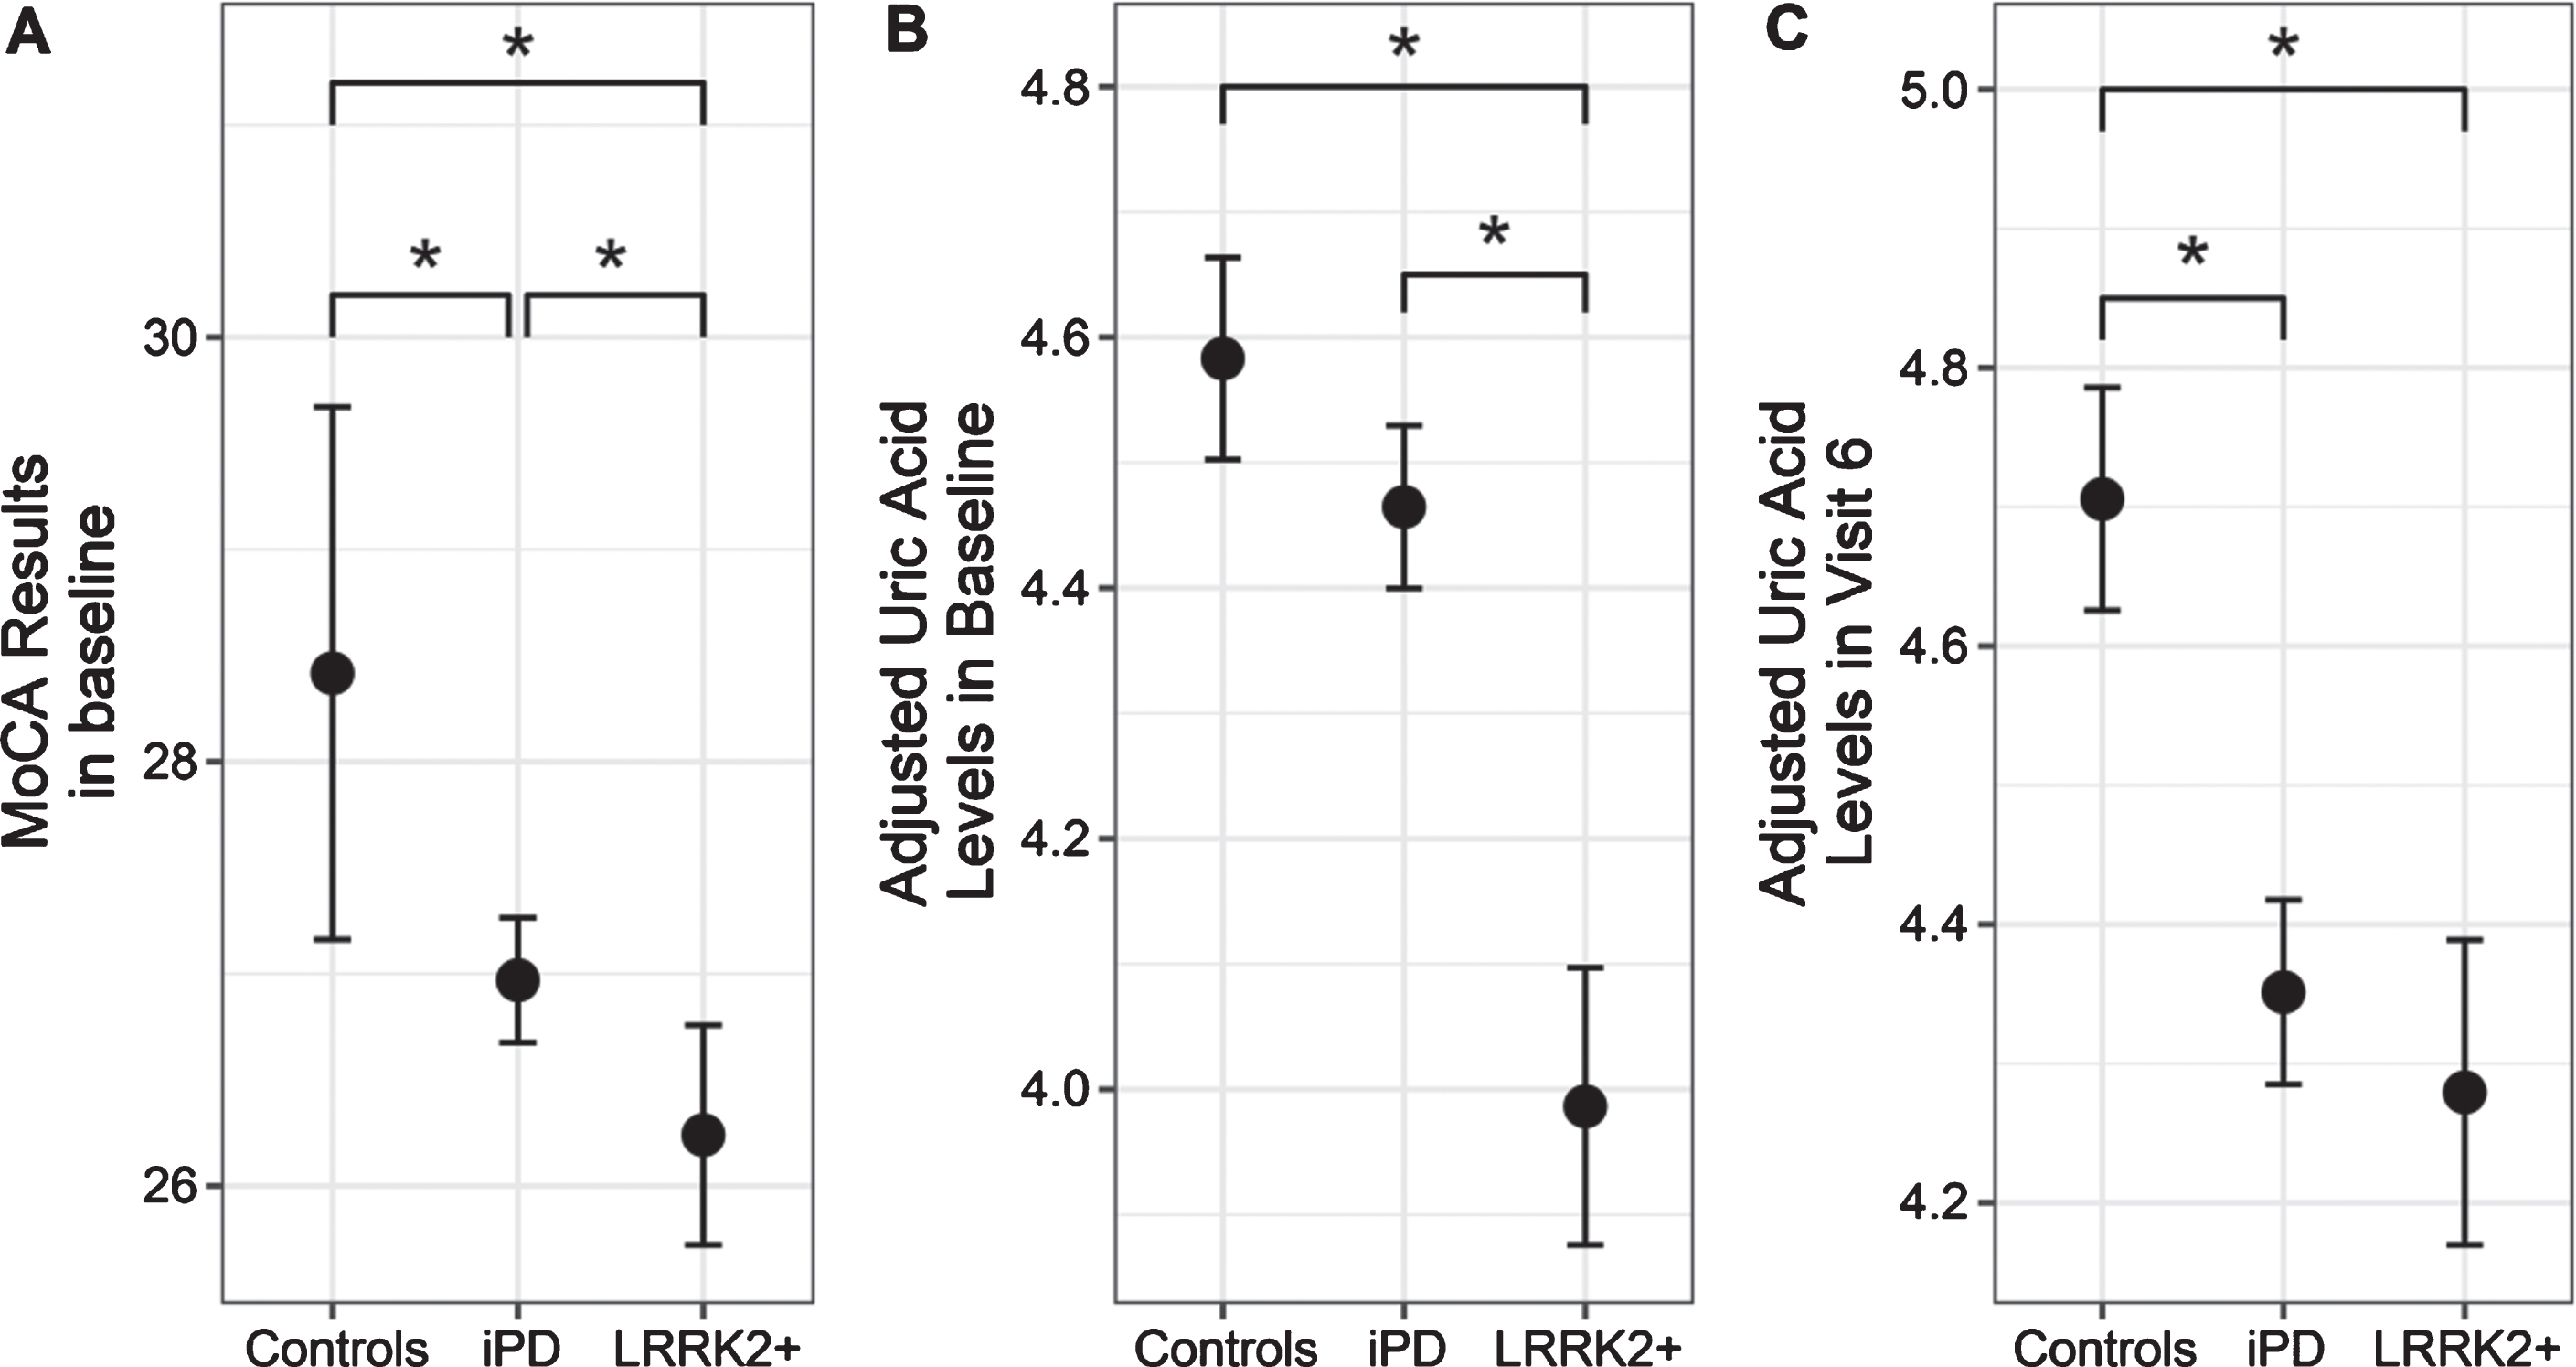
MoCA results (A) and adjusted uric acid levels at baseline (B) and on visit 6 (C) in controls, idiopathic PD and LRRK2 positive PD. Data presented as mean±95% confidence intervals (*p < 0.05) They are adjusted for sex as described in the methods section, by fitting a regression model with age, sex, disease duration and BMI as parameters and adjusting with the resulting coefficients.
We failed to reveal any significant impact of initial uric acid levels in iPD on the severity of motor deterioration when comparing high and low uric acid subgroups [baseline MDS-UPDRS III score 19.8 vs 20.5 (p = 0.899), Visit 6 MDS-UPDRS III score 27.2 vs 26.0 (p = 0.324) and 3-year change + 7.4 vs + 5.5 (p = 0.407). There was no significant impact or correlation of adjusted or unadjusted uric acid levels with GDS or RBDSQ scores (Supplementary Table 1).
A linear regression model was fitted with uric acid levels as the dependent variable and sex, age and BMI as the independent variables. The contribution of sex, but not age or BMI, to the model was statistically significant, with men having higher serum uric levels. As a result, uric acid levels for men were adjusted by subtracting the extra serum levels attributed to them by the model (b = 1.29 mg/dl; p < 0.0001). Because of the marked difference in disease duration between iPD and LRRK2 + PD patients, due to study eligibility criteria, an additional adjustment was made for disease duration with the appropriate coefficient from the aforementioned model (b = –0.003 times disease duration).
At baseline and Visit 6 there was a statistically significant decrease in unadjusted uric acid serum levels in LRRK2 + males when compared with iPD males (baseline: p = 0.006 V6: p = 0.001), which was absent in their female counterparts (baseline: p =0.99, V6: p = 0.828). In both cases HC subjects had higher unadjusted uric acid values from iPD and LRRK2 + subjects.
There was no statistically significant correlation between adjusted uric acid levels and DaT-SCAN SBRs (absolute rho values less than 0.07) in the four main striatal regions (ipsilateral and contralateral putamen and caudate nucleus). Moreover, treating the SBRs from the different striatal regions as covariates in the regression model which included visit and disease status as independent variables and adjusted uric acid levels as dependent did not uncover any significant relationship (Supplementary Table 1).
Both iPD and LRRK2 + PD patients showed a progressive decrease in SBR in all four distinct regions (ipsilateral and contralateral putamen and caudate nucleus) among the visits (all p-values less than 0.001). No statistically significant difference was found in the respective results between iPD and LRRK2 + PD patients (Table 2).
DAT-scan characteristics in iPD and LRRK2 + PD patients
BL, baseline; iPD, idiopathic Parkinsons Disease; LRRK + 2, leucine-rich repeat kinase 2; v, visit Data presented as mean (Standard deviation).
DISCUSSION
The important novel finding of this study is that the LRRK2 + PD group had significantly lower uric acid concentrations compared to HC after adjusting for age, sex disease duration and baseline BMI up to 5 years of follow-up. Uric acid concentrations across 5 years did not trend significantly up or down for any of the study groups. This latter result is consistent with the analysis in a PPMI iPD and an independent iPD cohort [19, 20]. Similarly, a previous cross-sectional study reported reduced plasma uric acid in 12 subjects with LRRK2 + PD, but data from LRRK2 + and iPD subjects were apparently pooled and compared to HC without adjustment for age or sex [21]. In contrast, another study reported that asymptomatic LRRK2 carriers had higher uric acid levels compared to LRRK2 + PD and controls; however, the retrospective, cross-sectional design and large age difference between LRRK2 carriers and LRRK2 + PD patients were limitations of that particular study [18]. In our study, we failed to observe a relationship between some basic indices of disease severity and uric acid levels at 2-year follow- up, which concurs with two recent PPMI studies for iPD patients vs HC [17], suggesting that a change in uric acid levels may not serve as a reliable marker of progressive disease severity, at least within this time frame. In a similar vein, no significant correlations were found between uric acid and DaTSCAN SBR scores. The small sample size and the early stages of the disease (in PPMI de novo patients) may account for a lack of statistical power to detect clinical or DaTSCAN imaging correlations.
The lack of correlation of indices of nigrostriatal degeneration with uric acid levels in LRKK2 + PD is consistent with a recent study in the iPD population of PPMI [20]. However, previous iPD studies have shown that lower serum uric levels were associated with more severe nigrostriatal degeneration [22, 23]. These correlations are also in line with findings from the PRECEPT study, in which higher levels of uric acid were associated with a greater likelihood of a DAT scan without evidence of a dopaminergic deficit in iPD [24]. Other cross-sectional studies have mainly focused on the comparison of DaTSCAN SBR values among iPD, non manifesting LRRK2 carriers and HC [22, 25–27]. For the first time, we report the progression of DaT deficits in LRRK2 + PD group over a 4-year period, similar to that reported in iPD groups [28].
Data on uric acid measurements in other genetic forms of PD are very scarce, and in some cases conflicting. Our present results are consistent with our previous study reporting reduced uric acid in 24 PD carriers of the p.A53T mutation in the alpha-synuclein gene as compared with age- and sex-matched healthy controls that were also enrolled in the PPMI study [17]. As concerns asymptomatic GBA1 carriers, a recent study using PPMI data failed to show any significant difference in uric acid levels as compared with HC [25]. Although established faster progression rate and increased disease severity (also in terms of cognitive decline) may correlate with the lower serum uric acid observed in A53T PD patients, this is not the case for LRRK2 + PD, which is thought to represent a rather typical, and in some cases more benign form of PD. In our study, however, we observed baseline lower MoCA scores in LRRK2 + PD compared with iPD, suggesting mild cognitive impairment in this group of patients even in the early stages of the disease. It has to be noted, however, that LRRK2 + PD had a longer disease duration, and the difference was no longer apparent at visit 6.
How LRRK2 is involved in the pathogenesis of PD remains unclear, and it is unknown how the low urate levels described in the current study may correlate with such pathogenic effects. The contrasting findings in asymptomatic LRRK2 carriers mentioned above would suggest that low urate is not a direct consequence of mutant LRRK2 but is somehow linked to the pathogenic process of symptomatic PD in manifesting carriers. It is possible that aberrations in the purine pathway in PD could occur upstream from urate as the final product of purine metabolism. This hypothesis is supported by significant changes in major metabolites (xanthine) of the purine pathway in the plasma of LRRK2 + PD patients compared to HC [21]. Causal mutations in the LRRK2 gene may accelerate PD pathophysiology through enhanced enzymatic activity of the kinase it encodes, and enhanced LRRK2 autophosphorylation has been linked to idiopathic as well as LRRK2 PD. In vitro kinase activity of LRRK2 from LRRK2 G2019S mutation carriers was significantly elevated in comparison to non-carriers [29]. Alternatively, urate’s modulatory action on idiopathic and LRRK2 PD may occur downstream from pathogenic hyperphosphorylation of LRRK2 kinase substrates, consistent with evidence that LRRK2 mutations produce neurodegeneration via oxidative stress [30]. A number of other studies have attempted to identify specific indices of elevated LRRK2 kinase activity in LRRK2 + PD and iPD, with mixed results [31, 32]. It will be of interest in future studies to correlate such indices to uric acid levels in order to identify possible common underlying mechanisms in LRRK2 + PD.
Interestingly, we found that the difference in uric acid levels was significant between men with iPD and LRRK2 mutations, but not in women at 2 years of follow-up. Bakshi et al. reported higher urate levels both in men and women with LRRK2 mutations, which may be related to the comparable PD penetrance of LRRK2 mutations in women and men in both Ashkenazi Jewish (AJ) and non-AJ LRRK2 + populations [18]. Koros et al. failed to demonstrate any statistically significant effect in either sex in iPD [17]. By contrast, a recent prospective study demonstrated that men, but not women, with higher urate concentrations had a lower future risk of developing PD, suggesting that urate in high levels present in males could slow disease progression during the early stage of the disease [7].
A main limitation of this study is that we did not adjust for several environmental factors, such as coffee consumption, smoking, hypertension, thiazide diuretic therapy and hormonal factors, as this information was not available for the whole sample. There is a considerable difference in disease duration between iPD and LRRK2 + PD patients, taking into account the PPMI inclusion criteria (see Methods); however, we made all the appropriate adjustments. Nonetheless, our study also has several strengths, including a population-based and longitudinal design, a systematic evaluation of incident de novo and drug naïve iPD and LRRK2 + PD cases with a typical profile of LRRK2 mutation carriers, and their motor and non motor characteristics. Larger cohorts with broader ascertainment of pathogenic mutations are needed to analyze the effect of specific mutations on uric acid and other biomarker levels.
CONCLUSION
This is the first longitudinal study to identify serum uric acid as a biomarker linked to LRRK2 + PD at different time points up to 5 years follow-up in the disease trajectory. Significant differences in uric acid levels between men with iPD and LRRK2 mutations, but not in women at 2 years of follow–up may be suggestive of a sex dependent role of uric acid in this genetic PD cohort. These findings may have implications for the understanding of the pathogenic process in LRRK2 + PD and provide targets for novel treatments.
CONFLICT OF INTEREST
Christos Koros received funding from the Michael J Fox Foundation for his participation in PPMI.
Athina-Maria Simitsi received funding from the Michael J Fox Foundation for her participation in PPMI.
Ion Beratis received funding from the Micheal J Fox Foundation for his participation in PPMI.
Maria Stamelou serves on the editorial boards of Movement Disorders Journal and Frontiers in Movement Disorders, received travel and speaker honoraria from Abbvie, UCB and Specifar Pharmaceuticals, and the International Parkinson’s disease and Movement Disorders Society, receives research support from the Michael J Fox Foundation (PPMI), royalties from Oxford University Press, Cambridge University Press, and Elsevier.
Leonidas Stefanis is employed by the National and Kapodistrian University of Athens, Medical School and the Biomedical Research Foundation of the Academy of Athens. He has received the following grants: MULTISYN European Program (EU, FP7-HEALTH.2013.1.2-1, number 602646), PPMI (supported by the Michael J. Fox Foundation), IMPRIND-IMI2 Number 116060 (EU, H2020), SANTE Research Grant in Biomedical Sciences, NO-MND (EUFP7-PEOPLE-2013-IRSES), NPF 2015 Investigator Award (Collaborator), “PBMC and urine collection in LRRK2 and idiopathic PD” Grant by the Michael J. Fox Foundation (Collaborator).
None of the other authors have any disclosures to report.
Footnotes
ACKNOWLEDGMENTS
This work was supported by funding from the PPMI study, Parkinson’s Progression Markers Initiative. PPMI, a public-private partnership, is funded by the Michael J. Fox Foundation for Parkinson’s Research and funding partners, including Abbvie, Avid, Biogen, Bristol-Myers Squibb, Covance, GE Healthcare, Genentech, GlaxoSmithKline, Lilly, Lundbeek,Merck, Meso Scale Discovery, Pfizer, Pir-amal, Roche, Servier, Teva, UCB, and Golub Capital.