
Abstract
Background:
Coding mutations in the LRRK2 gene, encoding for a large protein kinase, have been shown to cause familial Parkinson’s disease (PD). The immediate biological consequence of LRRK2 mutations is to increase kinase activity, suggesting that inhibition of this enzyme might be useful therapeutically to slow disease progression. Genome-wide association studies have identified the chromosomal loci around LRRK2 and one of its proposed substrates, RAB29, as contributors towards the lifetime risk of sporadic PD.
Objective:
Considering the evidence for interactions between LRRK2 and RAB29 on the genetic and protein levels, we set out to determine whether there are any consequences on brain function with aging after deletion of both genes.
Methods:
We generated a double knockout mouse model and performed a battery of motor and non-motor behavioral tests. We then investigated postmortem assays to determine the presence of PD-like pathology, including nigral dopamine cell count, astrogliosis, microgliosis, and striatal monoamine content.
Results:
Behaviorally, we noted only that 18–24-month Rab29-/- and double (Lrrk2-/-/Rab29-/-) knockout mice had diminished locomotor behavior in open field compared to wildtype mice. However, no genotype differences were seen in the outcomes that represented PD-like pathology.
Conclusion:
These results suggest that depletion of both LRRK2 and RAB29 is tolerated, at least in mice, and support that this pathway might be able to be safely targeted for therapeutics in humans.
INTRODUCTION
As of 2016, 6.1 million people worldwide were diagnosed with Parkinson’s disease (PD) [1]. With an increasing aging population, the burden of PD will also rise [2]. PD is classically defined by neurodegeneration, including nigral dopamine (DA) expressing neurons, reduced motor function and non-motor symptoms, including affective and cognitive concerns. While approximately 10–15% of cases are caused by single genetic mutations, most cases have no clear cause [3] and are defined as sporadic PD. However, there is increasing evidence that genetics contributes to the etiology of sporadic PD, particularly as genome-wide association studies have identified multiple independent risk alleles that increase lifetime disease risk [4].
Mutations in the LRRK2 gene have been found in 1% of apparently sporadic and 4% of familial PD patients [5, 6]. Those with LRRK2 mutations have convergent symptomatology with sporadic cases, suggesting shared pathogenic mechanisms [5, 7]. LRRK2 is a large multidomain protein that contains GTP-binding Ras of complex protein (ROC), carboxyl-terminal of Roc (COR), and kinase domains [8, 9]. Pathogenic mutations in the ROC-COR and kinase domains result in elevated kinase activity which mediates toxicity, indicating that LRRK2 inhibition may be a viable therapeutic strategy [10, 11]. LRRK2 is located in the cytosol and a number of membranous structures, including the Golgi and lysosomes, and shown to affect multiple cellular functions, including autophagy, vesicular trafficking, and endolysosomal system regulation [12–16].
The PARK16 locus is one of several chromosomal regions associated with risk of sporadic PD [6, 17]. One of the five genes in the PARK16 locus is RAB29 (also known as RAB7L1) [4, 18]. RAB29 belongs to the family of Rab GTPases that regulate membrane trafficking and intracellular signaling [18, 19] and is largely localized to the Golgi complex [14, 21].
While mutations at the LRRK2 and RAB29 loci are independently associated with increased PD risk, there is evidence suggesting a genetic interaction between the two genes [17]. Additionally, LRRK2 phosphorylates RAB29 when RAB29 is membrane and GTP bound [21–23]. PD-related LRRK2 mutations exacerbate RAB29 phosphorylation [21, 24], suggesting relevance to familial PD. Additionally, RAB29 activates LRRK2 autophosphorylation and recruits LRRK2 to the Golgi and lysosomes [14, 25–27]. Recent evidence has shown that RAB29 expression rescues impaired trafficking due to pathogenic LRRK2 mutation [28]. This suggests that LRRK2 and RAB29 are reciprocal effectors in the same pathway that may play a role in membrane trafficking [14, 25]. How the relationship between LRRK2 and RAB29 contributes to PD pathology remains unclear.
Rodent models lacking either LRRK2 or RAB29 do not exhibit any central nervous system (CNS) phenotype. No significant motor or non-motor deficits have been observed in Lrrk2-/- mice or in mice with silencing of striatal LRRK2 [29]. No brain pathology including DA neurodegeneration, alpha-synuclein, or ubiquitin levels were found in Lrrk2-/- mice [30]. Similarly, Rab29-/- or Lrrk2-/-/Rab29-/- mice did not have any DA degeneration [31]. These results are consistent with human genetic data where predicted loss-of-function mutations in LRRK2 are not associated with PD risk [32]. Collectively, this data supports the hypothesis that LRRK2 kinase inhibition would be an effective and safe therapeutic strategy to stop human PD progression.
While these reports demonstrate a lack of CNS phenotype in single knockout models, there has, to date, been no direct behavioral comparison of Lrrk2-/-, Rab29-/-, or Lrrk2-/-/Rab29-/- mouse models across different ages. Given the relationship between these two targets is potentially reciprocal, additive effects of double mutants might be expected. The current study aimed to fully characterize motor and non-motor assessments and PD-like pathology in Lrrk2-/-/Rab29-/- mice compared to WT, Lrrk2-/-, and Rab29-/- mice across different age groups. We find that loss of both Lrrk2 and Rab29 does not result in substantial behavioral deficits or pathological measures, suggesting the safety of targeting this pathway therapeutically.
MATERIALS AND METHODS
Animals
All animal procedures were performed in accordance with the Institutional Animal Care and Use Committee of the National Institute on Aging (ASP 463-LNG-2021) animal care committee’s regulations. Male and female C57BL/6J mice (N =118; approximately 30–70 g) were used for the current study. Rab29-/- mice were generated by crossbreeding Rab29 LacZ-knockin mice (EUC-OMM; Wellcome Trust Sanger Institute, Strain EM:05517) with mice expressing Cre under the constitutive CMV promoter (Jackson Laboratory, stock #006054) to remove exon 4. Single Lrrk2-/- and Rab29-/- mice were bred to create double knockout (Lrrk2-/-/Rab29-/-) mice. Genotypes were confirmed using gel-based PCR (Lrrk2 pri-mers: forward: CTCTGAGAGCAGGAGCCGT, re-verse: TGCCTTCCTGGACATTATTCAGCC; Rab29 primers: forward: ATGTTTGACGTCACCAATGC, lacZ: CCCCCTGAACCTGAAACATA, re-verse: CTCCCAGACCCATGAATGTGA) and wes-tern blot analyses using striatal tissue (LRRK2, Abcam, ab133474; RAB29, Abcam, ab137029; see Fig. 1B). The mice were provided with group housing and given access to food and water ad libitum and housed in a facility with 12-h light/dark cycles with temperature maintained at 22–23°C, and experiments took place between Zeitgeber Time ZT2 –ZT11.
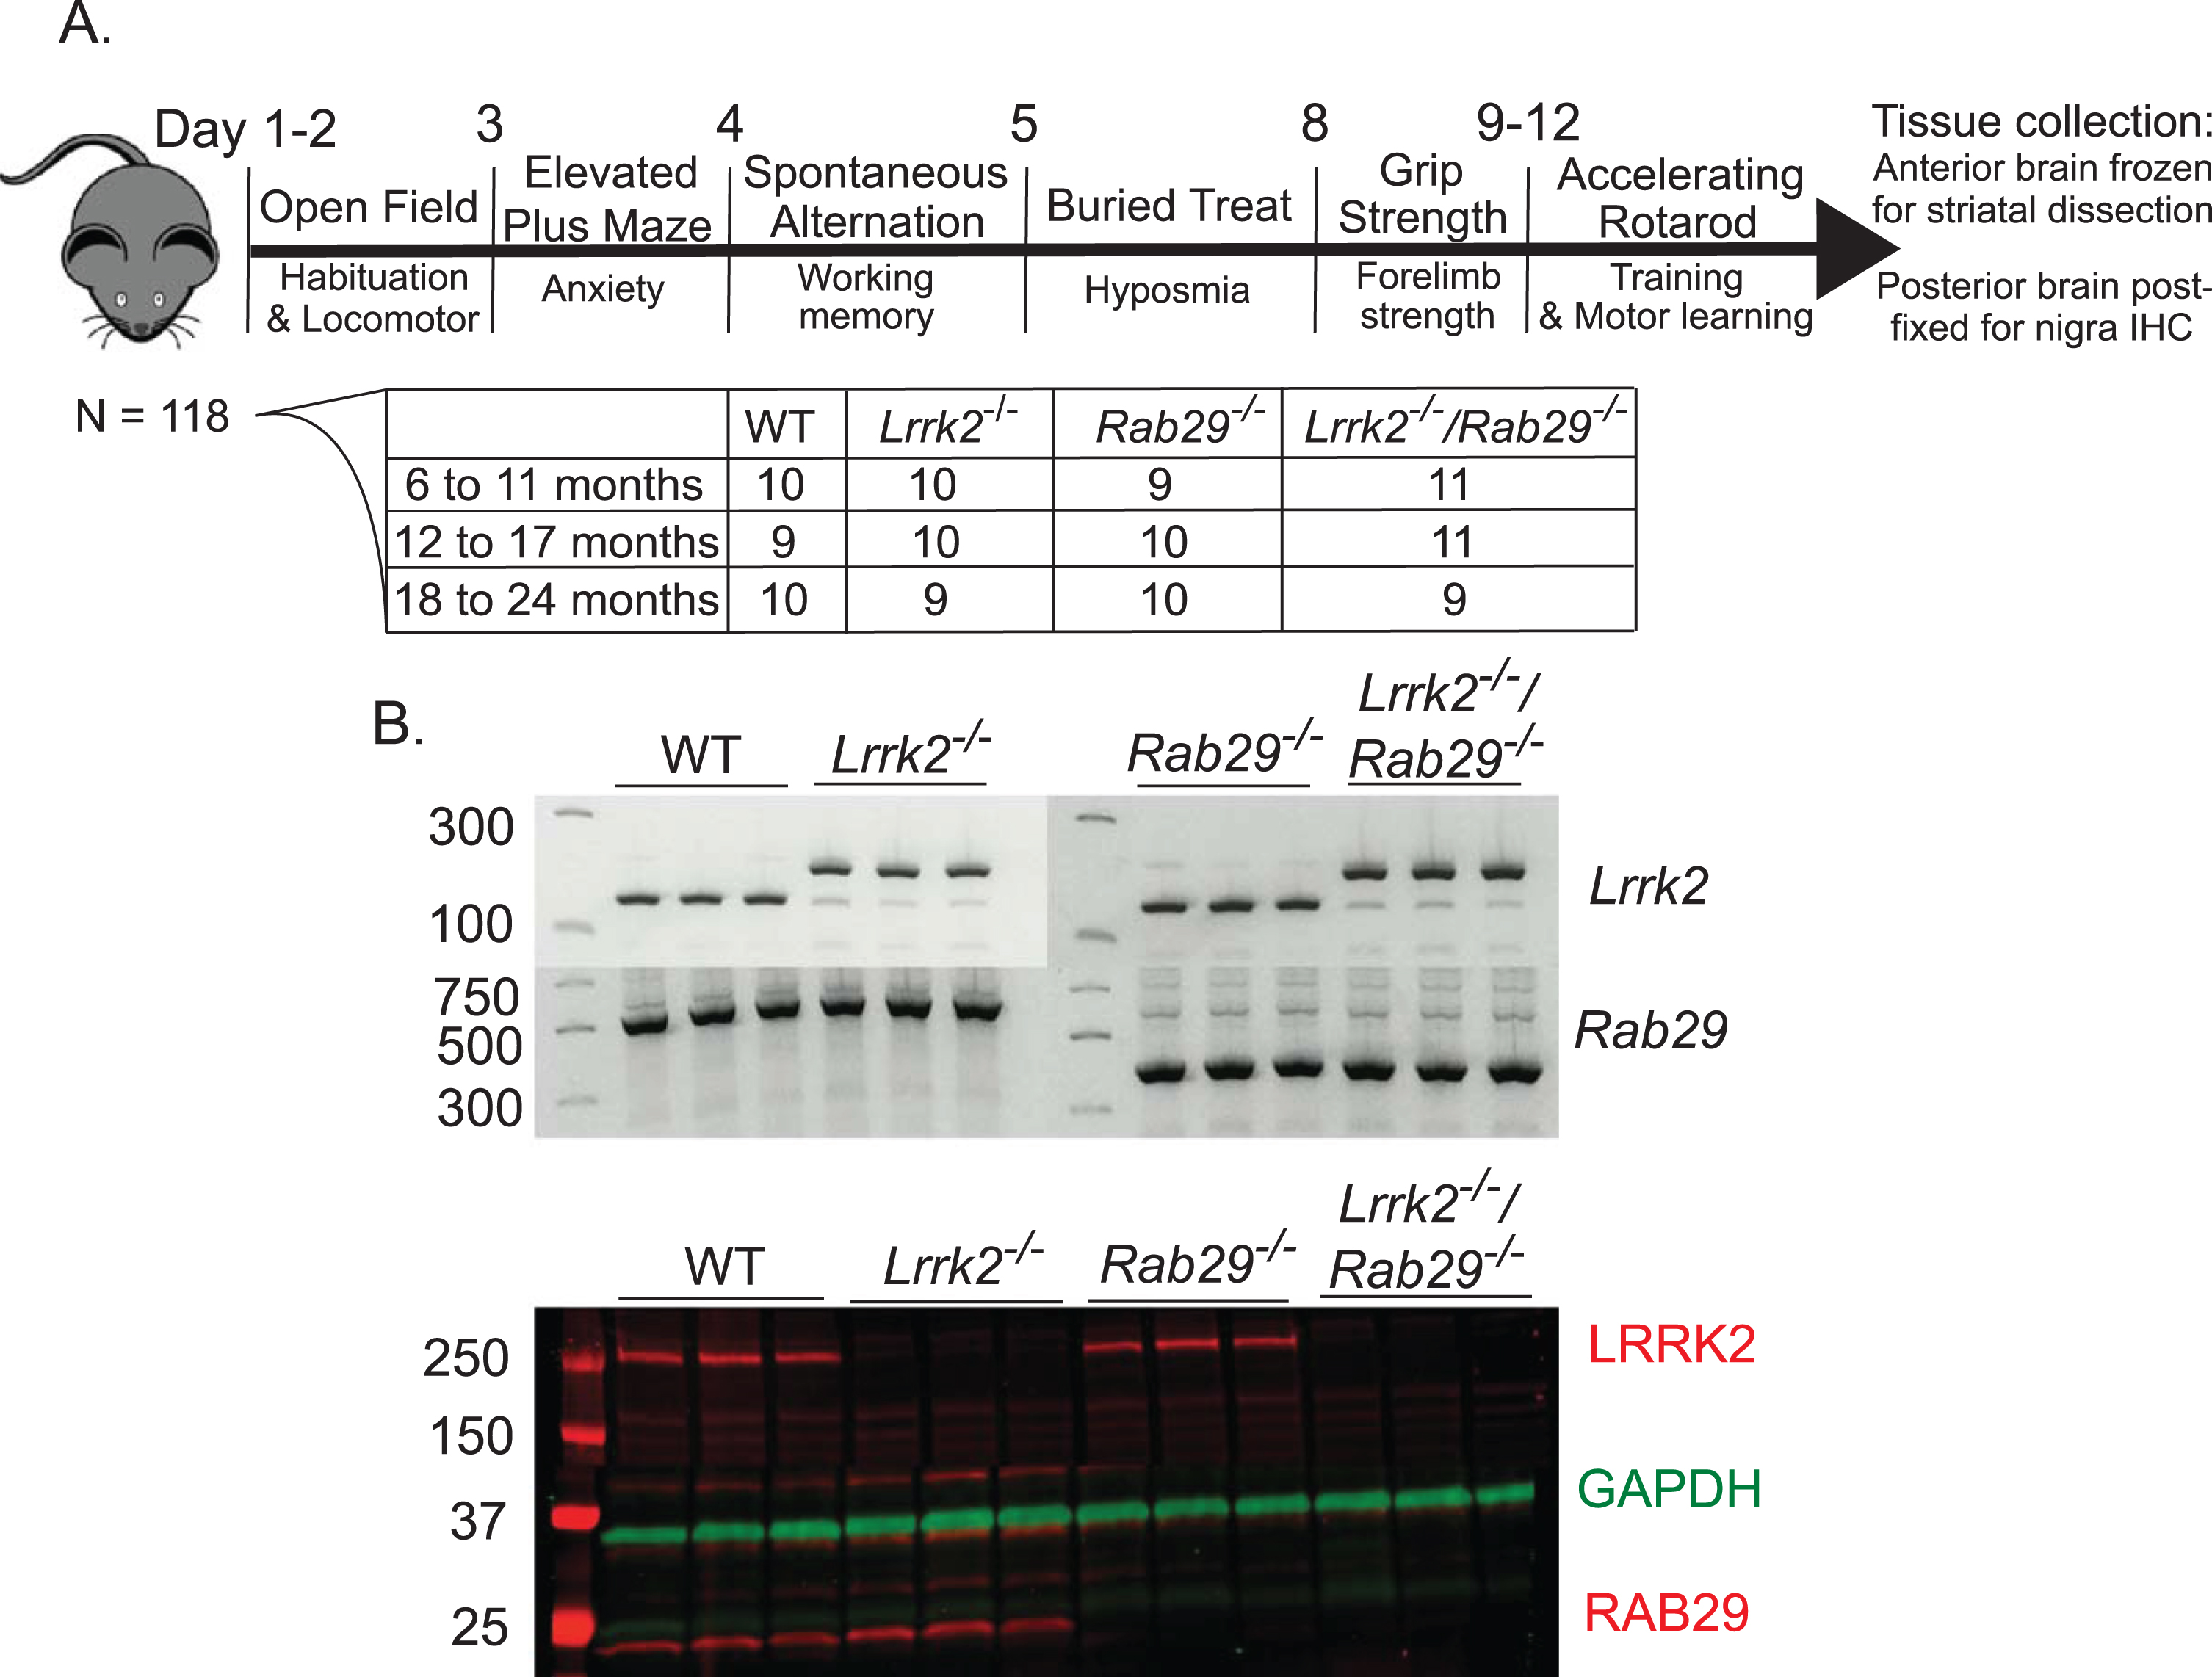
Study design and genotype confirmation. Male and female mice were handled prior to behavioral testing (A). Mice underwent all testing from 8:00 AM - 5:00 PM during their light cycle. Once all behavioral testing was complete, brain tissue was collected for post-mortem analysis. The anterior brain was flash frozen on dry ice for striatal tissue dissection for western blot and HPLC analyses. The posterior brain was post-fixed in 4% paraformaldehyde for 48 hours then stored in 30% sucrose for immunohistochemistry staining of the SNc. Genotypes were confirmed at the DNA and protein levels with diagnostic gel PCR and western blot analyses, respectively (B). Representative blots are shown.
Experimental design
Mice were tested in three age groups to determine genotype- and age-related differences across multiple behaviors (see Fig. 1A for n by age and genotype). Mice were handled prior to behavioral testing to reduce stress response and body weight was recorded. For 2 weeks, mice were tested daily on various behavioral tasks using the Rodent Behavior Core facility (National Institute of Mental Health). These tasks included: open field, elevated plus maze, spontaneous alternation, buried treat test, grip strength, and accelerating rotarod. Experimenters evaluating behavior were blinded to age and genotype. Once behavioral testing was complete, at 18-24 months of age, mice were weighed and tissue was collected for postmortem analyses. The anterior brain was flash frozen and stored at –80°C for striatal tissue dissection for western blot and high performance liquid chromatography (HPLC) analysis. The posterior brain was post-fixed in 4% paraformaldehyde for 48 h and then stored in 30% sucrose prior to tissue preparation for immunohistochemistry.
Behavioral tests
Open field
Mice underwent open field testing twice; first to habituate to the test and the second to test for baseline locomotor performance. Each day, mice were placed in the testing room under red light for 1 h prior to habituate to the room. Mice were then placed in a plexiglass chamber equipped with 2 layers of beams (4×8; Photobeam Activity System-Open Field, San Diego Instruments) for a 30 min trial and allowed to explore freely. Ambulatory frequency, a measure for repetitive, stereotypic movements, was calculated as the ratio of ambulatory movements to the sum of unique beam breaks by ambulatory movement. Path length, a measure for total distance travelled, was calculated through relative distance by coordinates of beam breaks. All other data are measured as counts. Only data from the test day is shown.
Elevated plus maze
The elevated plus maze was used to measure differences in anxiety-related behaviors [33]. Mice were placed in testing room lit at 100 lux and allowed to habituate for 1 h. Mice were then placed in center of elevated plus maze containing 2 open and 2 closed arms 77.5 cm from the floor (each arm measured 38.1×5.1 cm with walls 15.2 cm tall). Mice started off facing a closed arm and allowed to explore the maze freely for 10 min. Trials were recorded and later scored using Top Scan 3.0 software. Anxiety-related measures were determined as percent open arm behaviors were the sum of the open arms was divided by the sum of all the arms.
Spontaneous alternation
To detect deficits in working memory, spontaneous alternation was carried out on a plexiglass Y-maze with each arm measuring 40×8×12 cm [34]. Each mouse was placed in the center of the maze and allowed to explore the arms freely for 8 min. The sequence of arm entry and total number of arm entries was recorded. Spontaneous alternation (percent) was determined by taking the total number of consecutive arm entries divided by the number of possible alternations (total arm entries minus 2) multiplied by 100. Mice with less than 10 arm entries were excluded from this analysis (n = 13).
Buried treat test
To determine whether mice exhibited hyposmia, a promising marker for PD severity [35] mice were tested on the buried treat test [36]. Three days prior to testing, mice were habituated to fruit-scented cereal treats. The day before testing, mice were food deprived for a minimum of 12 h. On test day, mice were individually placed in a new cage with 3 cm of clean bedding. A chow pellet and cereal treat were buried 0.5 cm deep. The mouse was free to locate the treat and time to treat was recorded with a maximum time of 5 min. Three trials were performed with bedding replaced in between each trial. The average time across trials was recorded for each mouse.
Grip strength
The grip strength test was used to quantify differences in skeletal muscular strength in mouse forelimbs [37]. The grip strength apparatus (BioSeb) includes a wire grid (8×8 cm) where mice were lifted by the tail so that the forepaws grasped the grid and then were gently pulled backward by the tail until they released the grid. The maximal force was recorded and the mean of 5 trials was included for each mouse.
Accelerating rotarod
Motor performance and motor learning were testing using the accelerating rotarod assay. Mice were habituated to the test by walking on the rod for 1 min at the stable speed of 5 rpm. Mice were then tested for the following 3 days where they underwent 3 trials each day at an increasing speed from 4–40 rpm across 5 min. Trials were separated by at least 15 min. Latency to fall was recorded for each trial and the mean across trials was entered for each day.
Postmortem analyses
Immunohistochemistry
Post-fixed posterior brains were sectioned on a microtome into 30μm coronal sections and stored in cryoprotectant at –20°C as previously described [38]. Briefly, sections containing the substantia nigra pars compacta (SNc) were quenched in glycine (0.3 M in PBS) and were then washed in PBS 3 times. Sections were blocked for 1 h at RT in blocking buffer (1% BSA, 0.3% Triton X-100, and 10% donkey serum in PBS). Following 3 PBS rinses, sections were incubated in primary antibodies at 4°C overnight: tyrosine hydroxylase (TH, Abcam ab112, rabbit polyclonal, 1:500), neuronal nuclei (NeuN, Abcam, ab104224, mouse monoclonal, 1:1000), glial fibrillary acidic protein (GFAP, Sigma-Aldrich, MAB360, mouse monoclonal, 1:500), Iba1 (Abcam, ab5076, goat polyclonal, 1:500), LAMP1 (Developmental Studies Hybridoma Bank, 1D4B, supernatant, rat, 1:200), TGN-38 (Bio-Rad, AHP499G, sheep polyclonal, 1:500) in 1% BSA, 0.3% Triton X-100, and 1% donkey serum in PBS. Sections were rinsed and incubated in secondary antibodies for 1 h at RT (Alexa Fluor 488 donkey anti-rabbit IgG, donkey anti-goat IgG, donkey anti-rat IgG, 1:500; Alexa Fluor 568 donkey anti-mouse IgG, donkey anti-sheep, 1:500; Alexa Fluor 647 donkey anti-rabbit IgG, 1:500; Hoechst 33,342, 1:10,000). Sections were rinsed and mounted on glass slides which were then rinsed in water and coverslipped using Prolong Gold mounting media. Slides were imaged on a Zeiss 880 confocal microscope at 10x and 63x magnification. For TH, NeuN, Iba1, and GFAP: positively-labeled cells were manually counted and summed across 3 nigra sections as a representative cell count. For LAMP1, differences in lysosomal size were determined using the average size of positively-labeled lysosomes and then averaging across 20 cells per mouse. For TGN-38, differences in trans-Golgi network (TGN) morphology were determined by the average number of fragments across 20 cells per mouse. ImageJ software was used for generating and quantifying imaging data.
Western blot
Western blot procedures were carried out as pre-viously described [39]. Frozen striatal tissue was dissected and homogenized in lysis buffer (20mM Tris pH 7.5, 10% glycerol, 1 mM EDTA, 150 mM NaCl, 1×protease inhibitor cocktail (Halt), 1×phosphatase inhibitor cocktail (Halt)) and lysed on ice for 30 min. Samples were spun at 20,000 g for 10 min at 4°C and protein supernatant was separated. Protein concentrations were determined by the Pierce 660 assay. Protein lysates were diluted to 10μg per sample and boiled in 1× Laemli Sample Buffer (Bio-Rad). Samples were loaded on pre-cast 4–20% TGX polyacrylamide gels (Criterion, Bio-Rad). Electrophoresis was performed in 1×pre-mixed buffer (10 mM Tris, 10 mM Tricine, 0.01% SDS, pH 8.3, diluted with water) using the Criterion Vertical Electrophoresis Cell (Bio-Rad). Gels were then transferred to 0.45μm pore-size nitrocellulose membranes (Bio-Rad) using the Trans-Blot Turbo Transfer System (Bio-Rad). Membranes were blocked using a 1:1 solution of phosphate buffered saline (PBS) and Odyssey Blocking Buffer (LiCor). After blocking, membranes were incubated overnight on gentle agitation at 4°C with primary antibodies (TH, 1:1000; GAPDH, Sigma, G8795, mouse monoclonal, 1:10,000) diluted in antibody buffer (1:1 of Tris buffered saline (TBS) with 0.1% Tween and Odyssey Blocking Buffer. Membranes were then washed 3 times for 5 min each in TBS–0.1% Tween followed by a 1 h incubation at room temperature in fluorescent secondary antibodies (IRDye, Li-Cor) diluted 1:15,000 in antibody buffer. After 3 additional washes, western blots were imaged using the Odyssey CLx system (Li-Cor) and quantified using Image Studio software.
High performance liquid chromatography
Reverse-phase high performance liquid chromatography (HPLC) coupled to electrochemical detection was performed based on a previously described protocol [40, 41]. Tissue was homogenized in ice-cold 0.1 M perchloric acid with 10 mM ethylenediaminetetraacetic acid (EDTA) and 1% ethanol and spun for 45 min at 14,000 g while maintained at 4°C. Supernatant was collected and loaded into an ESA autoinjector (Model 542; currently owned by Thermo Scientific; Chelmsford, MA, USA) and continuously maintained at 4°C. MDTM Mobile Phase Type II comprised of 78 mM sodium phosphate (monobasic, monohydrate), 46 mM citric acid monohydrate, 50 nM EDTA, 1.7 mM octane sulfonic acid, and 9.5% acetonitrile, adjusted to pH 3.0 with sodium hydroxide was propelled by an ESA solvent delivery system (Model 582), flowing through an external pulse dampener followed by a guard cell (Model 5020) set to +500 mV, before intermixing with sample from the autoinjector. Samples were then chromatographically separated by a Hypersil ODS C18 Column (150x3 mm, 3μm particle size; Thermo Scientific PN: 30103-153030) held at 37°C, then passing through an analytical cell (model 5011A) housing 2 electrodes (set to +150 mV and +250 mV, respectively) connected to a Coulochem III electrochemical detector. Neurotransmitters were oxidized upon contact with the second electrode of the analytical cell, generating a spike in current. This measure of electrical current over time was recorded and later analyzed using EZChrom Elite software via Scientific Software Inc. SS420X module. Each neurotransmitter was detected as a peak, therefore peak areas were converted to picograms per milligram of tissue using a standard curve (1E–6 to 1E–9 M).
Statistical analyses
Divergence from a normal distribution was estimated using the Shapiro-Wilk Normality test. Accelerating rotarod data was analyzed using a three-way mixed design ANOVA (genotype×age×test day). Postmortem analyses were analyzed for genotype differences in the 18–24-month age group using a one-way between-subjects ANOVA. All other data was analyzed with a two-way between-subjects ANOVA (genotype x age). Tukey post-hoc analyses were used to determine significant differences when appropriate. All analyses were carried out using RStudio (https://rstudio.com/) and alpha was set to 0.05. For one-way ANOVAs and main effects, Cohen’s f and achieved power were determined using the “powerAnalysis” package in R. For interactions, eta squared was calculated using the “rstatix” package in R. Eta squared was converted to Cohen’s f to determine achieved power using GPower (3.0.10; https://www.psychologie.hhu.de/arbeitsgruppen/allgemeine-psychologie-und-arbeitspsychologie/gpower.html). Calculated effect sizes (Cohen’s f), n, and p values calculated from ANOVAs were used when determining achieved power (see Table 1 for values). While both males and females were included in all age groups and genotypes, we decided a priori to collapse data across sex and focus on genotype and age differences for the results. For analyses relating to sex differences, see the Supplementary Material and Supplementary Table 1.
Statistical table
Post-hoc power calculations for each statistical test were recorded. To calculate achieved power, we used the calculated effect size, group sample size, and the p value from the indicated test. Superscript letters in the text refer to the first column of the table.
RESULTS
Motor behaviors
Age- and gene-related differences in baseline locomotor behavior was determined by placing WT, Lrrk2-/-, Rab29-/-, and Lrrk2-/-/Rab29-/- knockout mice in open field chambers. There were no differences due to age or genotype in total activity, fine movement, rearing activity, ambulatory activity, ambulatory frequency, and path length (Fig. 2A–F). A significant genotype x age interaction was noted for ambulatory count (F6,106 = 2.23, p = 0.045a) and path length (F6,106 = 2.32, p = 0.038b); however, no post-hoc comparisons between groups were significant. In the oldest age group (18–24 months), there was a main effect of genotype where Rab29-/- and Lrrk2-/-/Rab29-/- mice had lower ambulatory count (one-way ANOVA, F3,34 = 4.05, p = 0.015c; Fig. 2D, p < 0.05) and travelled less according to path length (F3,34 = 5.10, p = 0.005d; Fig. 2F, p < 0.05). Furthermore Lrrk2-/-/Rab29-/- knockout mice had reduced ambulatory frequency compared to WT (F3,34 = 3.74, p = 0.02e; Fig. 2E, p < 0.05).
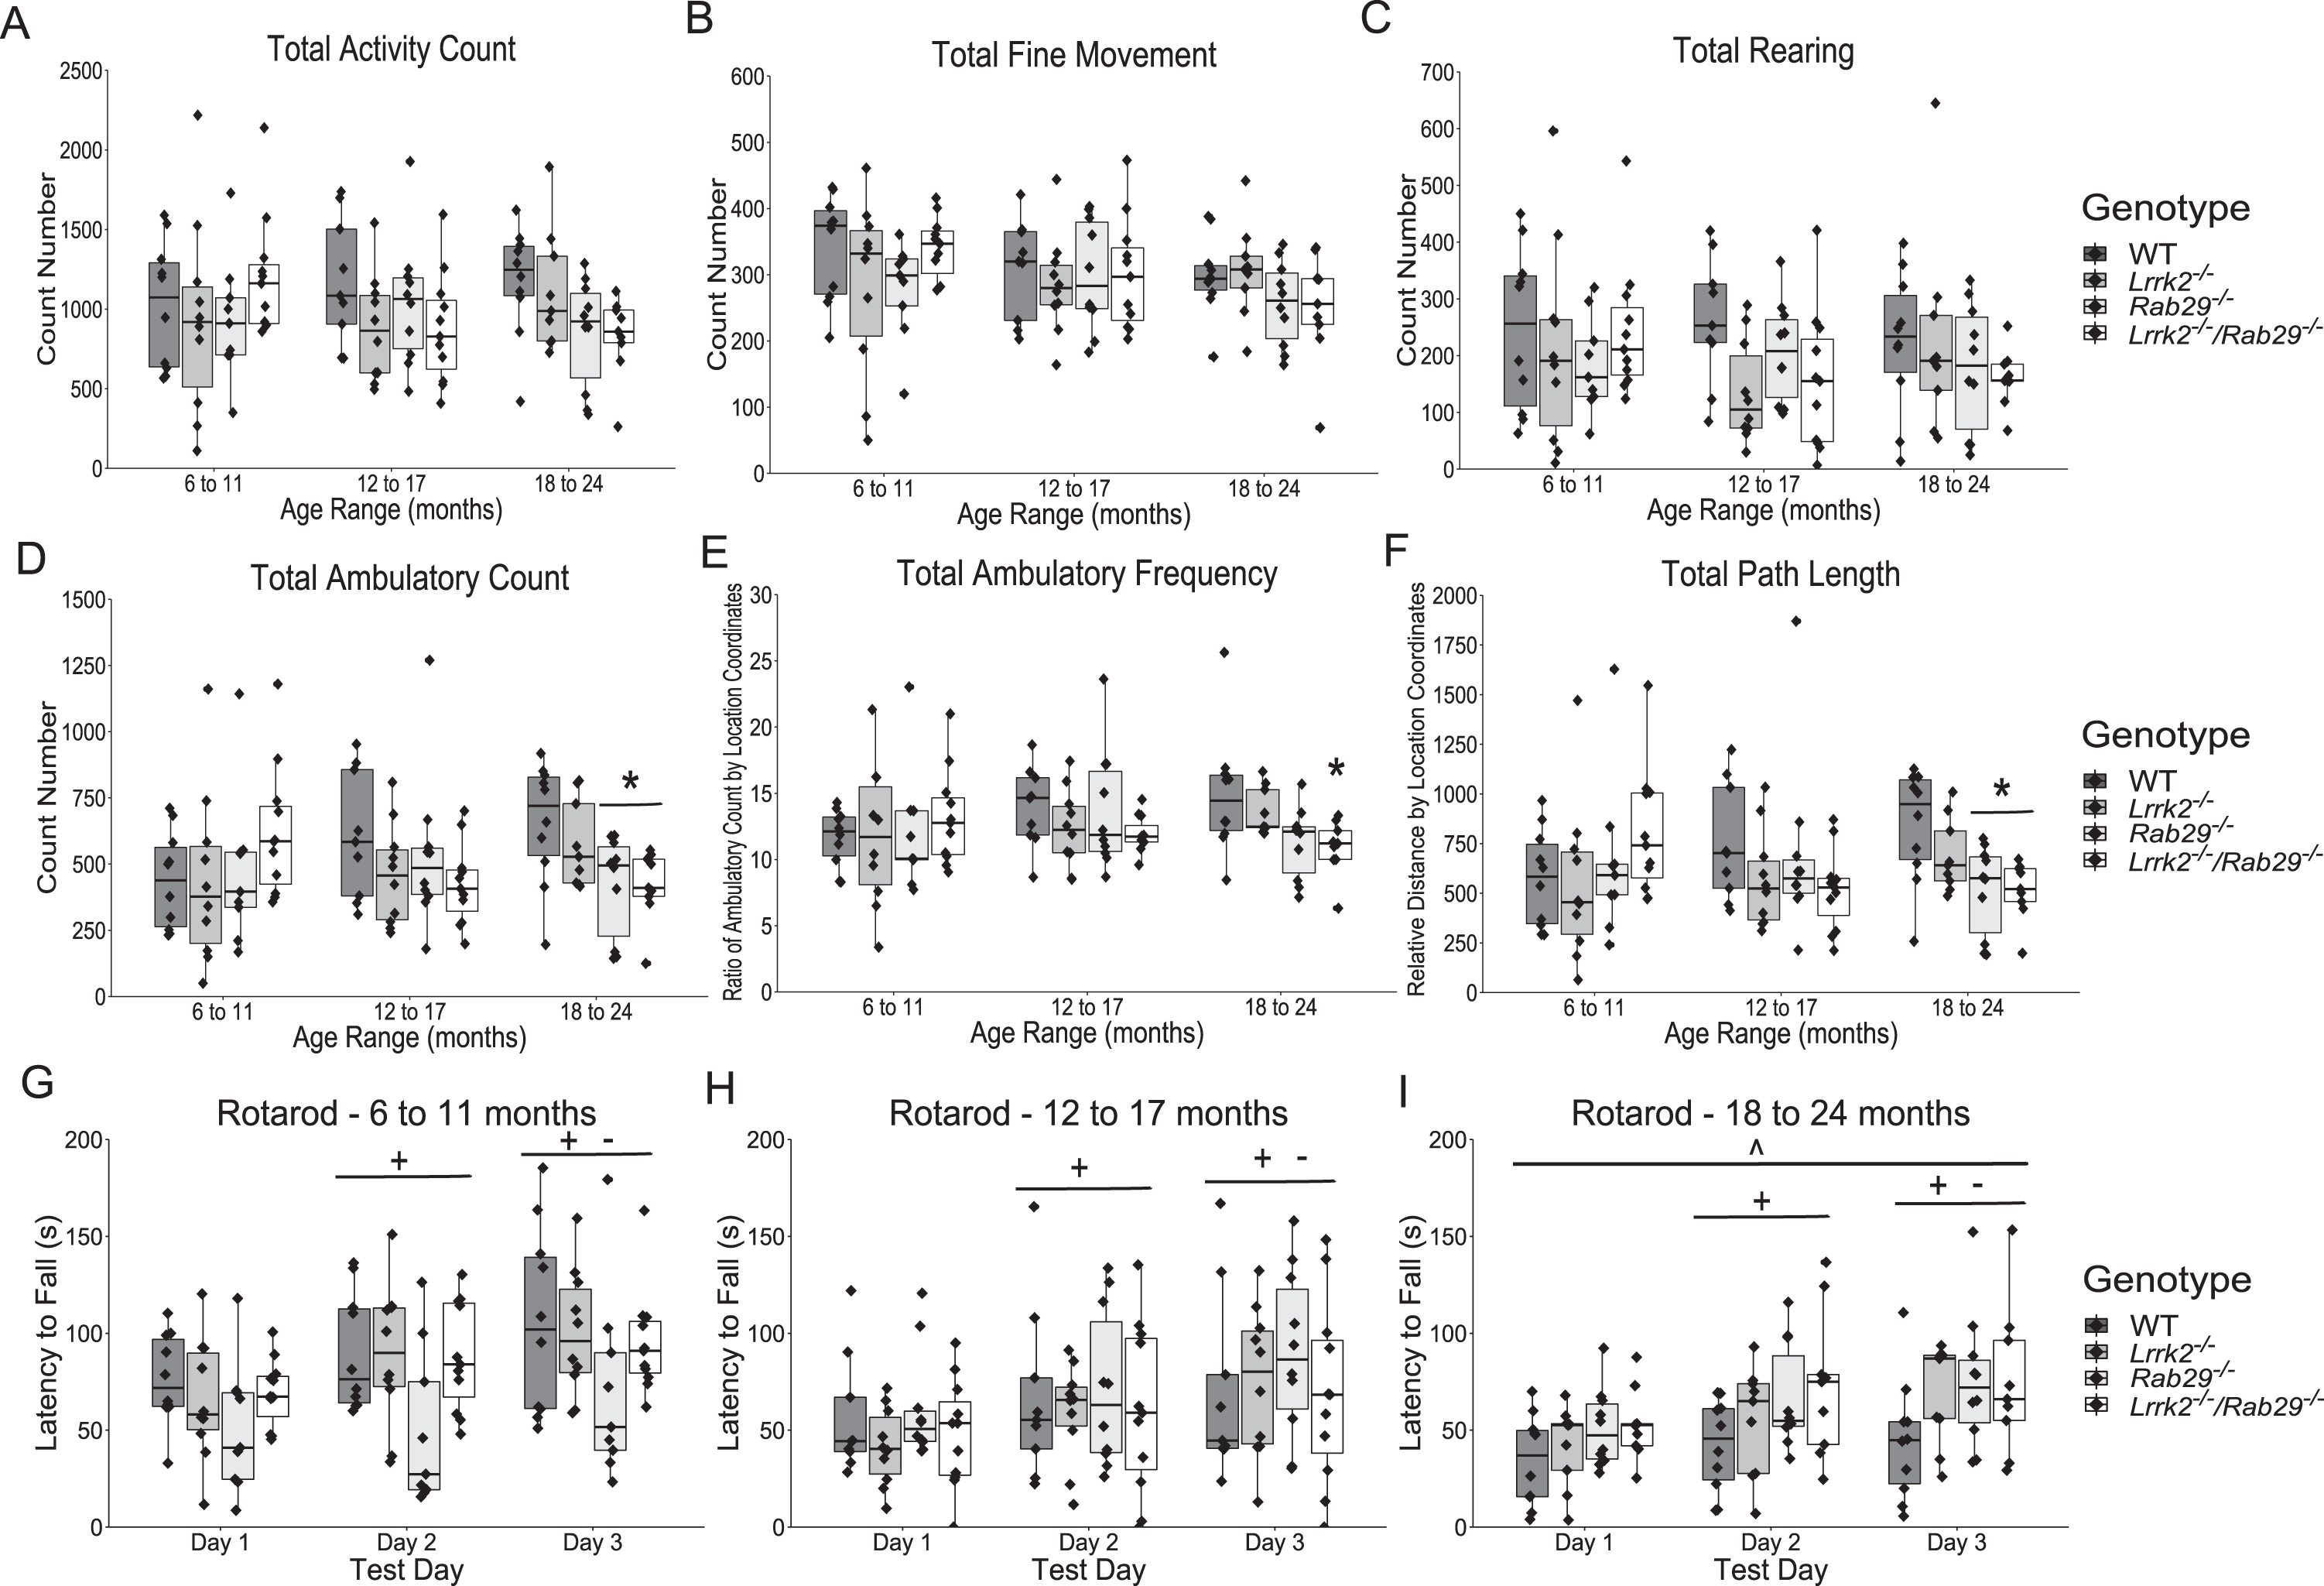
Locomotor behavior characterization of aging single and double knockout mice. Open field measurements of locomotor activity across total session including: activity count (A); fine movement count (B); rearing count (C); ambulatory activity count (D); ambulatory frequency (E; stereotypy measure); and path length (F). Accelerating rotarod to show differences in motor performance and learning for each age: 6 to 11 (G), 12 to 17 (H), and 18 to 24 month (I). *p < 0.05 vs. WT 18 to 24 month, ∧p < 0.05 vs. 6 to 11 month, +p < 0.05 vs. Day 1, and -p < 0.05 vs. Day 2.
Motor performance was also measured using accelerating rotarod. There was a main effect of day (F2,212 = 72.57, p = 2x10-16f), where latency to fall significantly increased each day (p < 0.05). There was also a main effect of age (F2,212 = 5.72, p = 0.004g) where the youngest group (6–11 months) had greater latencies than the oldest age group (18–24 months; p = 0.005).
Overall, the motor evaluations indicated a decline in some open field measures aged Lrrk2-/-/Rab29-/- mice but no effects of genotype on motor learning as determined by rotarod. These results indicate that motor function is impacted by combined Lrrk2 and Rab29 deficiency in modest ways.
Non-motor behaviors
To further characterize the effects of Lrrk2 and Rab29 deficiency, mice were tested on a variety of non-motor behaviors. The elevated plus maze was used to measure anxiety-related behaviors. A main effect of age was found where 6–11 month mice had the lowest amount of anxiety as measured by more open arm entries (F2,105 = 5.06, p = 0.008h; Fig. 3A, p = 0.006) and longer time spent in the open arms (F2,105 = 4.73, p = 0.012i; Fig. 3B, p = 0.008) compared to 18–24 month mice as well as longer distance travelled in open arms compared to 12–17 and 18–24 month mice (F2,105 = 9.41, p = 0.0002j; Fig. 3C, p < 0.05). A significant genotype x age interaction was identified for percent open arm entries (F6,105 = 3.33, p = 0.005k) and distance travelled (F6,105 = 2.26, p = 0.043l). Rab29-/- mice aged 6–11 months entered open arms more than 6–11-month Lrrk2-/-/Rab29-/- mice and 18–24 month Rab29-/- mice (Fig. 3A, p < 0.05). Lrrk2-/- mice aged 6–11 months travelled farther in open arms than 12–17 and 18–24-month Lrrk2-/- mice and 6–11-month Lrrk2-/-/Rab29-/- mice (Fig. 3B; p < 0.05).
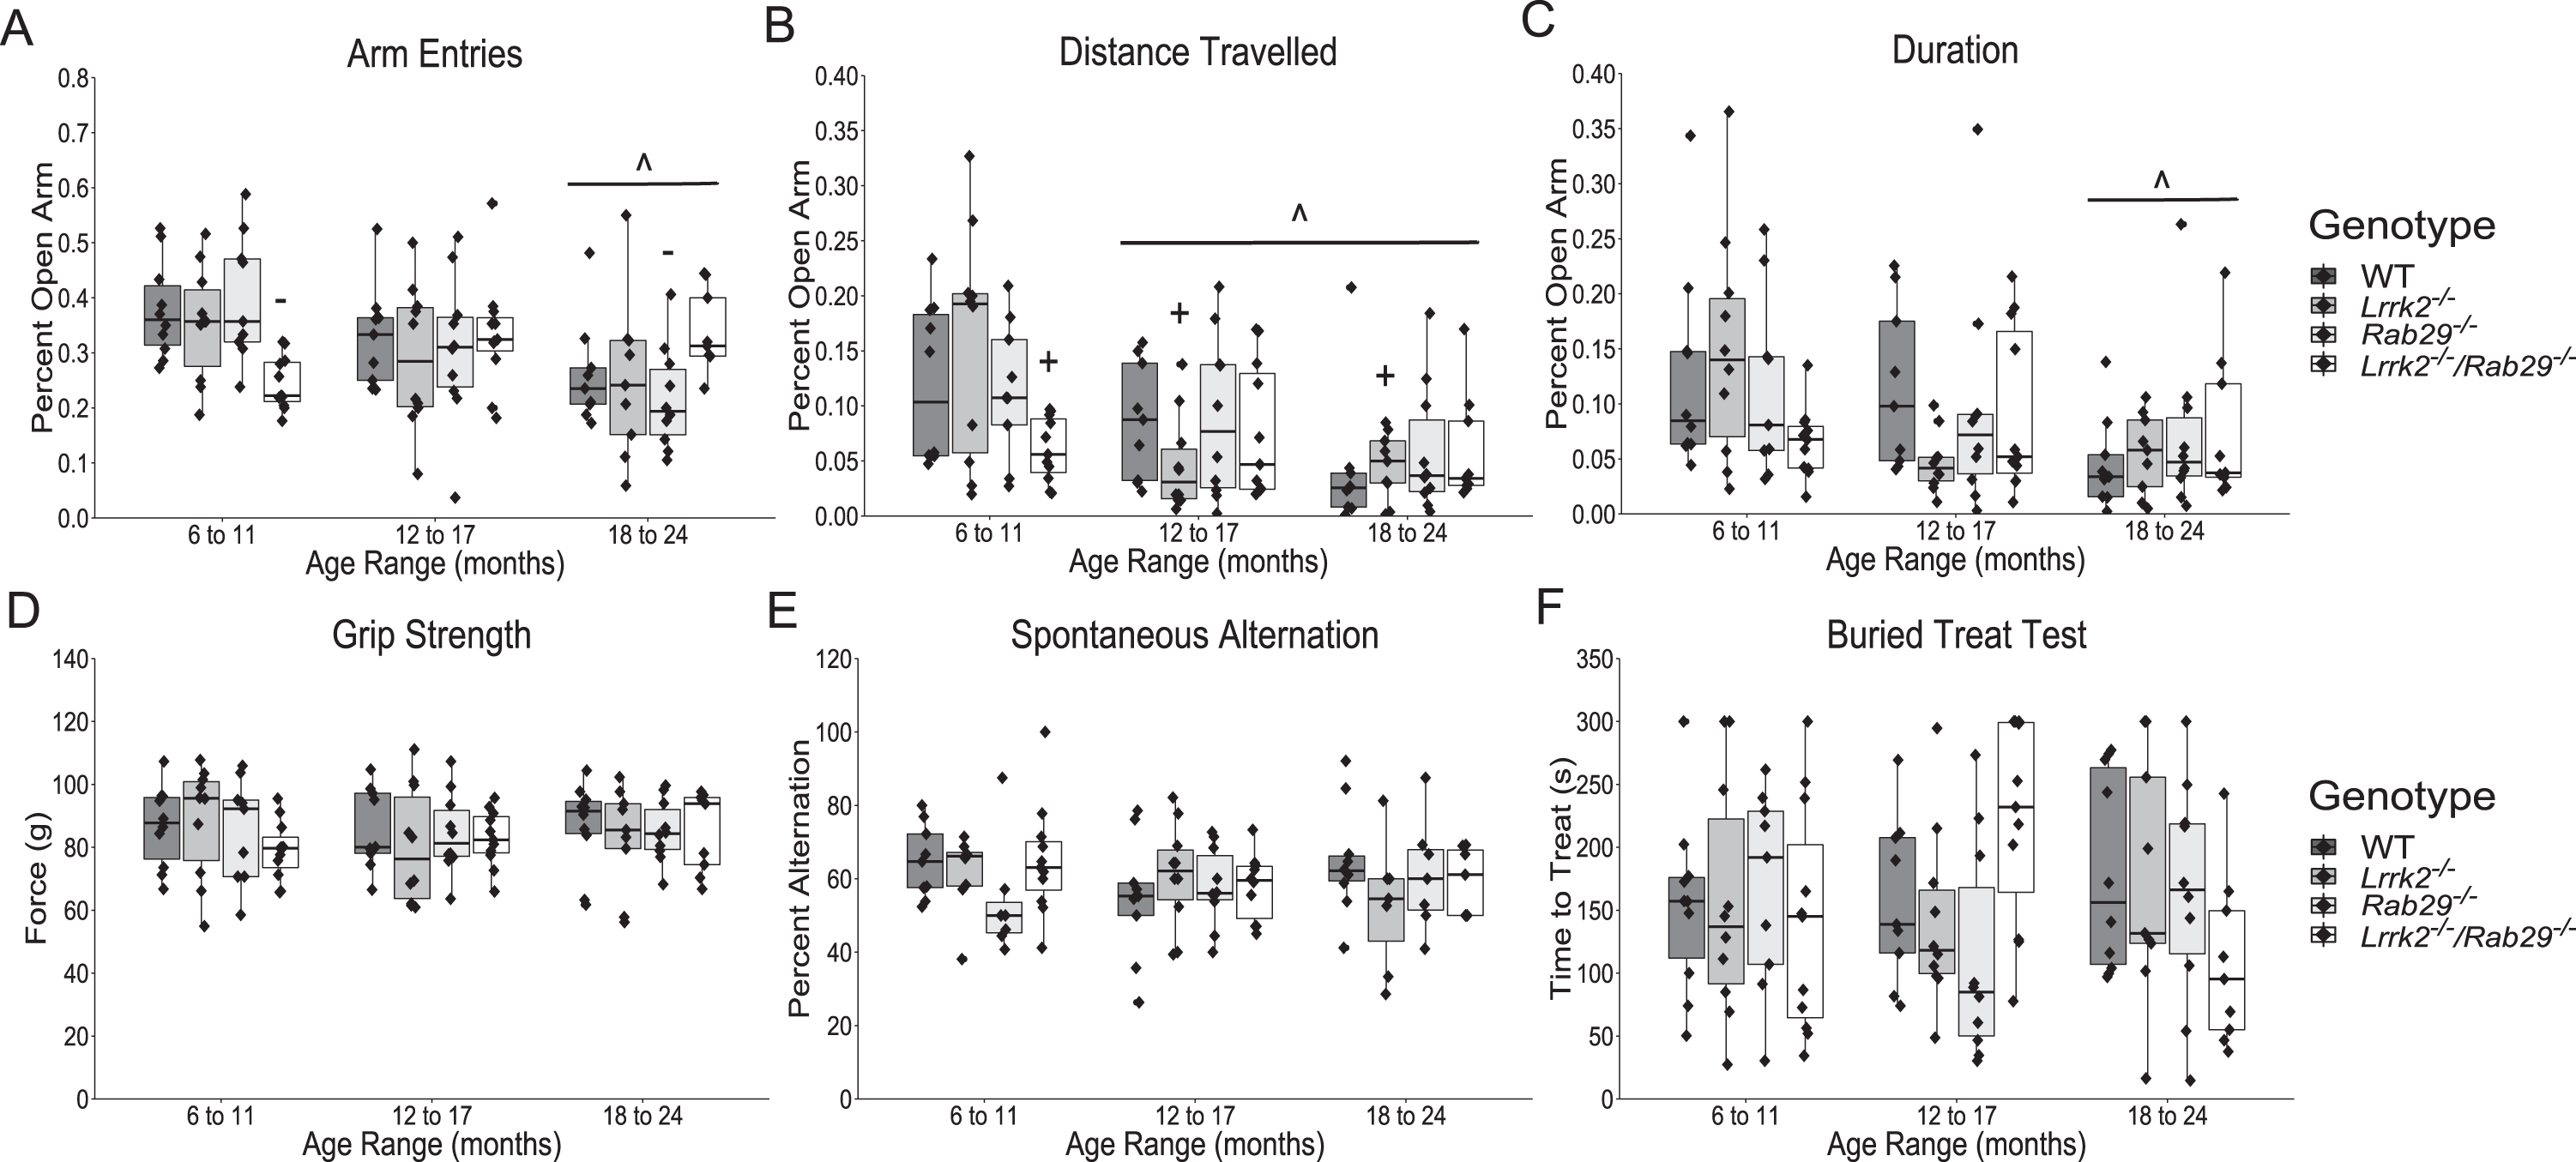
Nonmotor behavior characterization of aging single and double knockout mice. Elevated plus field measurements of anxiety determined by percent of open arm: entries (A), distance travelled (B); and duration (C). Other nonmotor assays included: grip strength (D); spontaneous alternation for working memory (E); and buried treat test as a measure for hypsomia (F). ∧p < 0.05 vs. 6 to 11 month, +p < 0.05 vs. Lrrk2 : 6 to 11 month, and -p < 0.05 vs. Rab29 : 6 to 11 month.
There were no reported age- or genotype-related differences on forelimb strength as measured by the grip strength test (Fig. 3D) or working memory as measured by spontaneous alternation (Fig. 3E). There was a genotype x age interaction found for the buried treat test measurement of hyposmia (F6,106 = 2.39, p = 0.034m); however, no significant post-hoc comparisons were noted between genotypes (Fig. 3F). Overall, the only non-motor behaviors to show group differences were anxiety-related and while 6–11-month Lrrk2-/-/Rab29-/- mice exhibited greater anxiety behavior compared to single knockout mice, age was the most significant factor in increased anxiety behavior.
Postmortem analyses
Due to the reduced motor activity observed in 18–24-month Rab29-/- and Lrrk2-/-/Rab29-/- mice, postmortem analyses focused on genotypic differences in the oldest age group. Using immunohistochemistry, we determined whether known PD-like pathologies were present in the SNc across genotypes. For instance, DA-related cell loss was quantified using the rate limiting enzyme in DA synthesis, TH, and NeuN, as a marker for cell bodies. As increased astrogliosis and microgliosis has been reported in the SN of PD patients (see [42] for review), we stained for reactive astrocytes and microglia using GFAP and Iba1, respectively. Finally, since LRRK2 and RAB29 are reported to be involved with lysosomal and TGN trafficking, we stained for size and morphological differences in lysosomes and TGN using LAMP1 and TGN-38, respectively, in TH-positive neurons. There were no differences among genotypes in the representative cell counts for TH, NeuN (Fig. 4), GFAP, or Iba1 (Fig. 5). Also, no genotype differences were found in either lysosomal size or TGN fragmented morphology (Fig. 6). These findings suggest that no PD-related pathology as well as damaged lysosomal or TGN integrity in the SNc was detected due the single or double knockout.
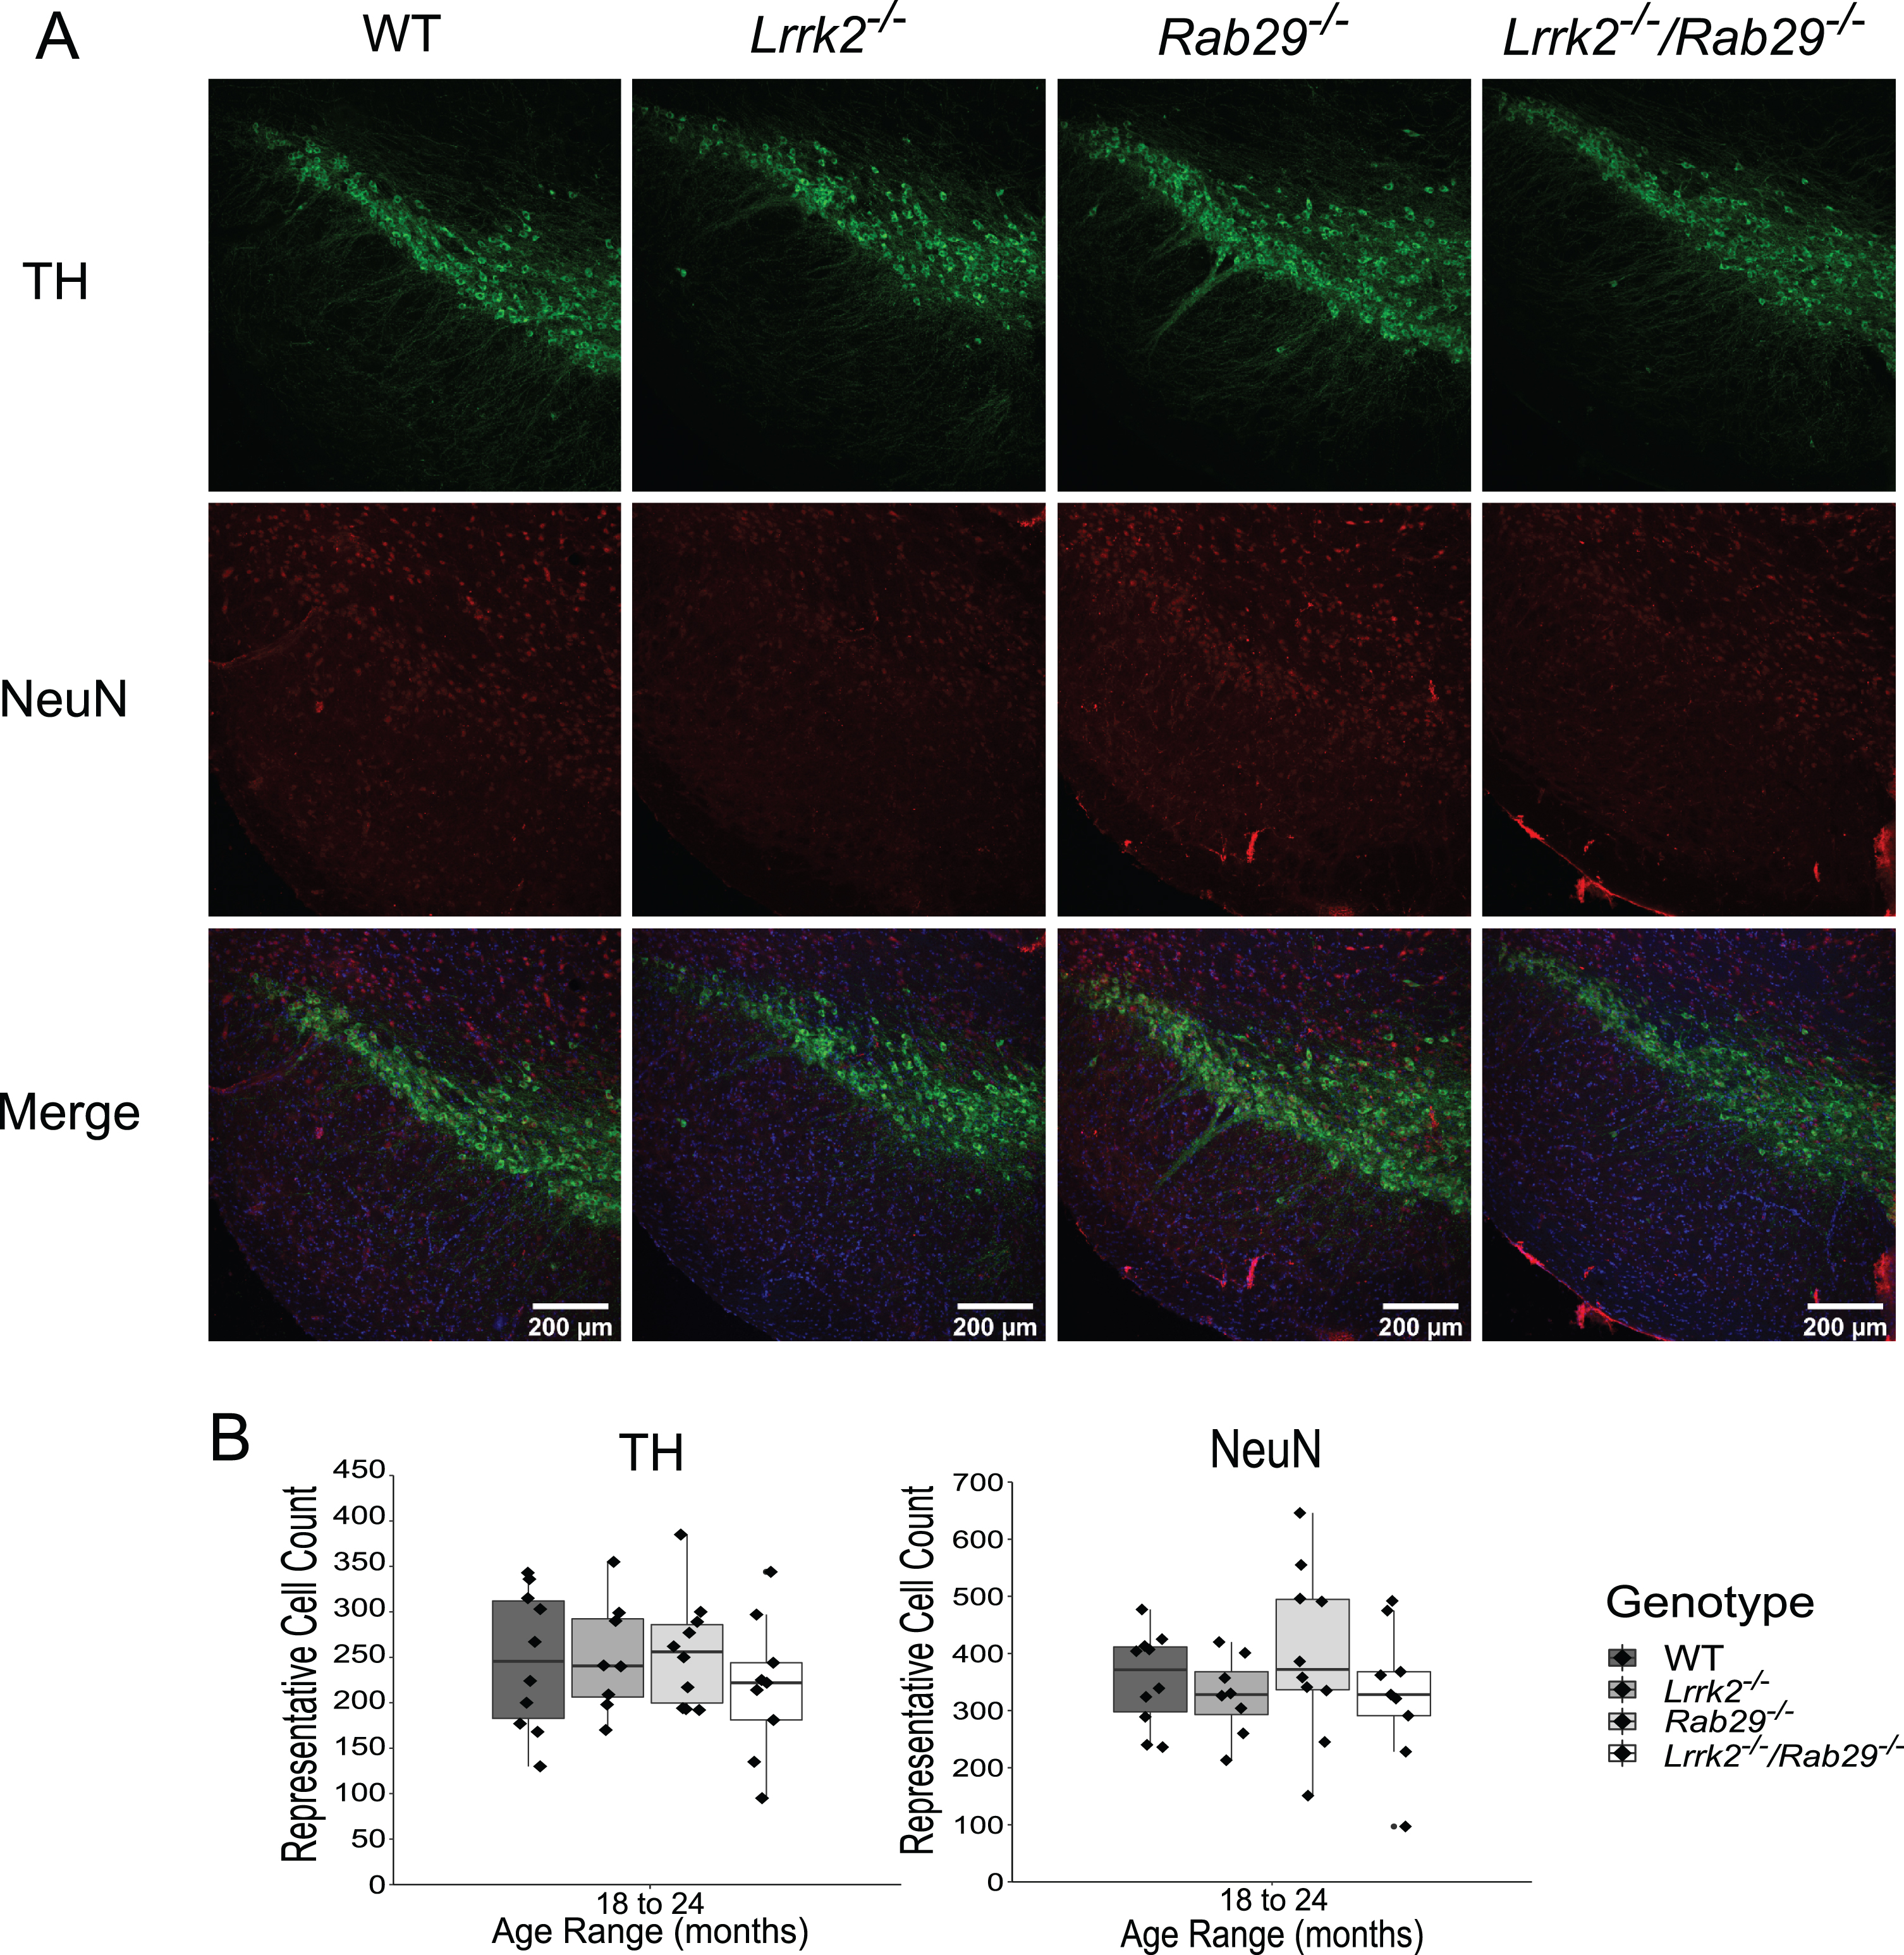
Quantification of DA cell loss in the SNc of 18–24 month single and double knockout mice. Immunohistochemistry images of SNc stained for TH (green), NeuN (red), and Hoechst (blue; A). Genotype differences in TH and NeuN representative cell counts summed across 3 SNc areas were quantified (B).
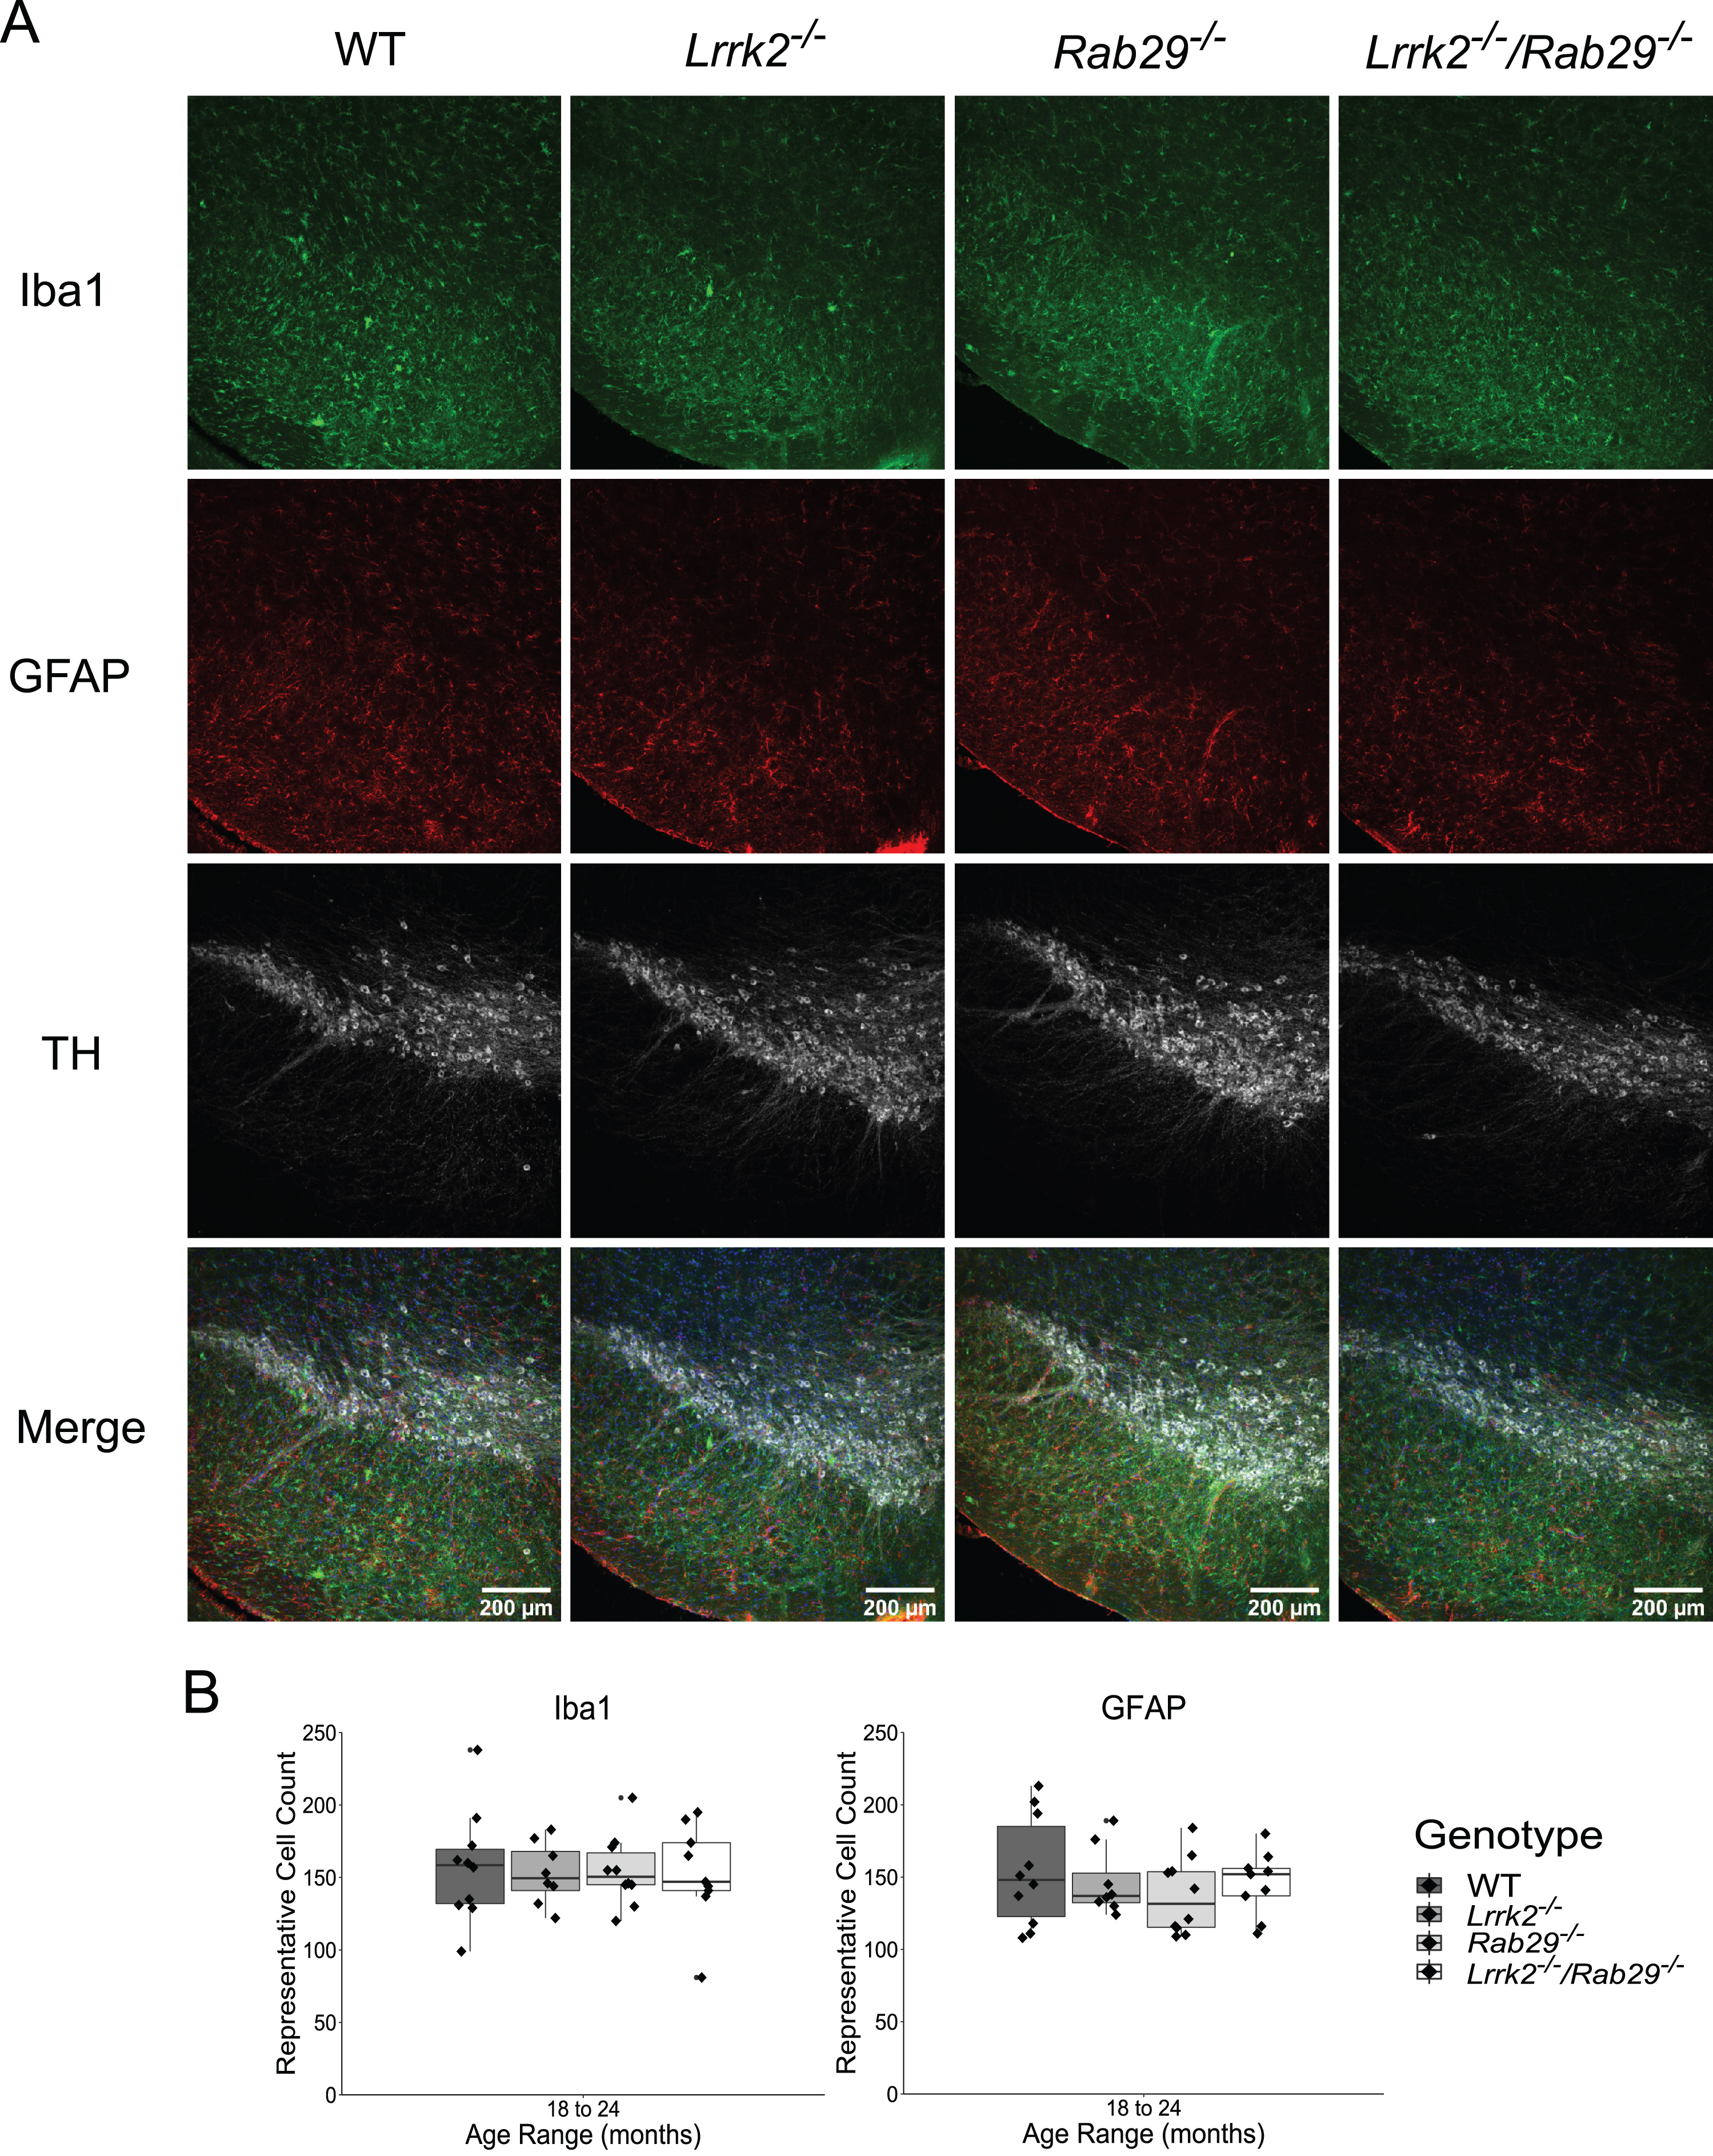
Genotype differences in microgliosis and astrogliosis in the SNc of 18–24 month single and double knockout mice. Immunohistochemistry images of SNc stained for Iba1 (green), GFAP (red), TH (gray), and Hoechst (blue). Genotype differences in Iba1 and GFAP representative cell counts summed across 3 SNc areas were quantified (B).
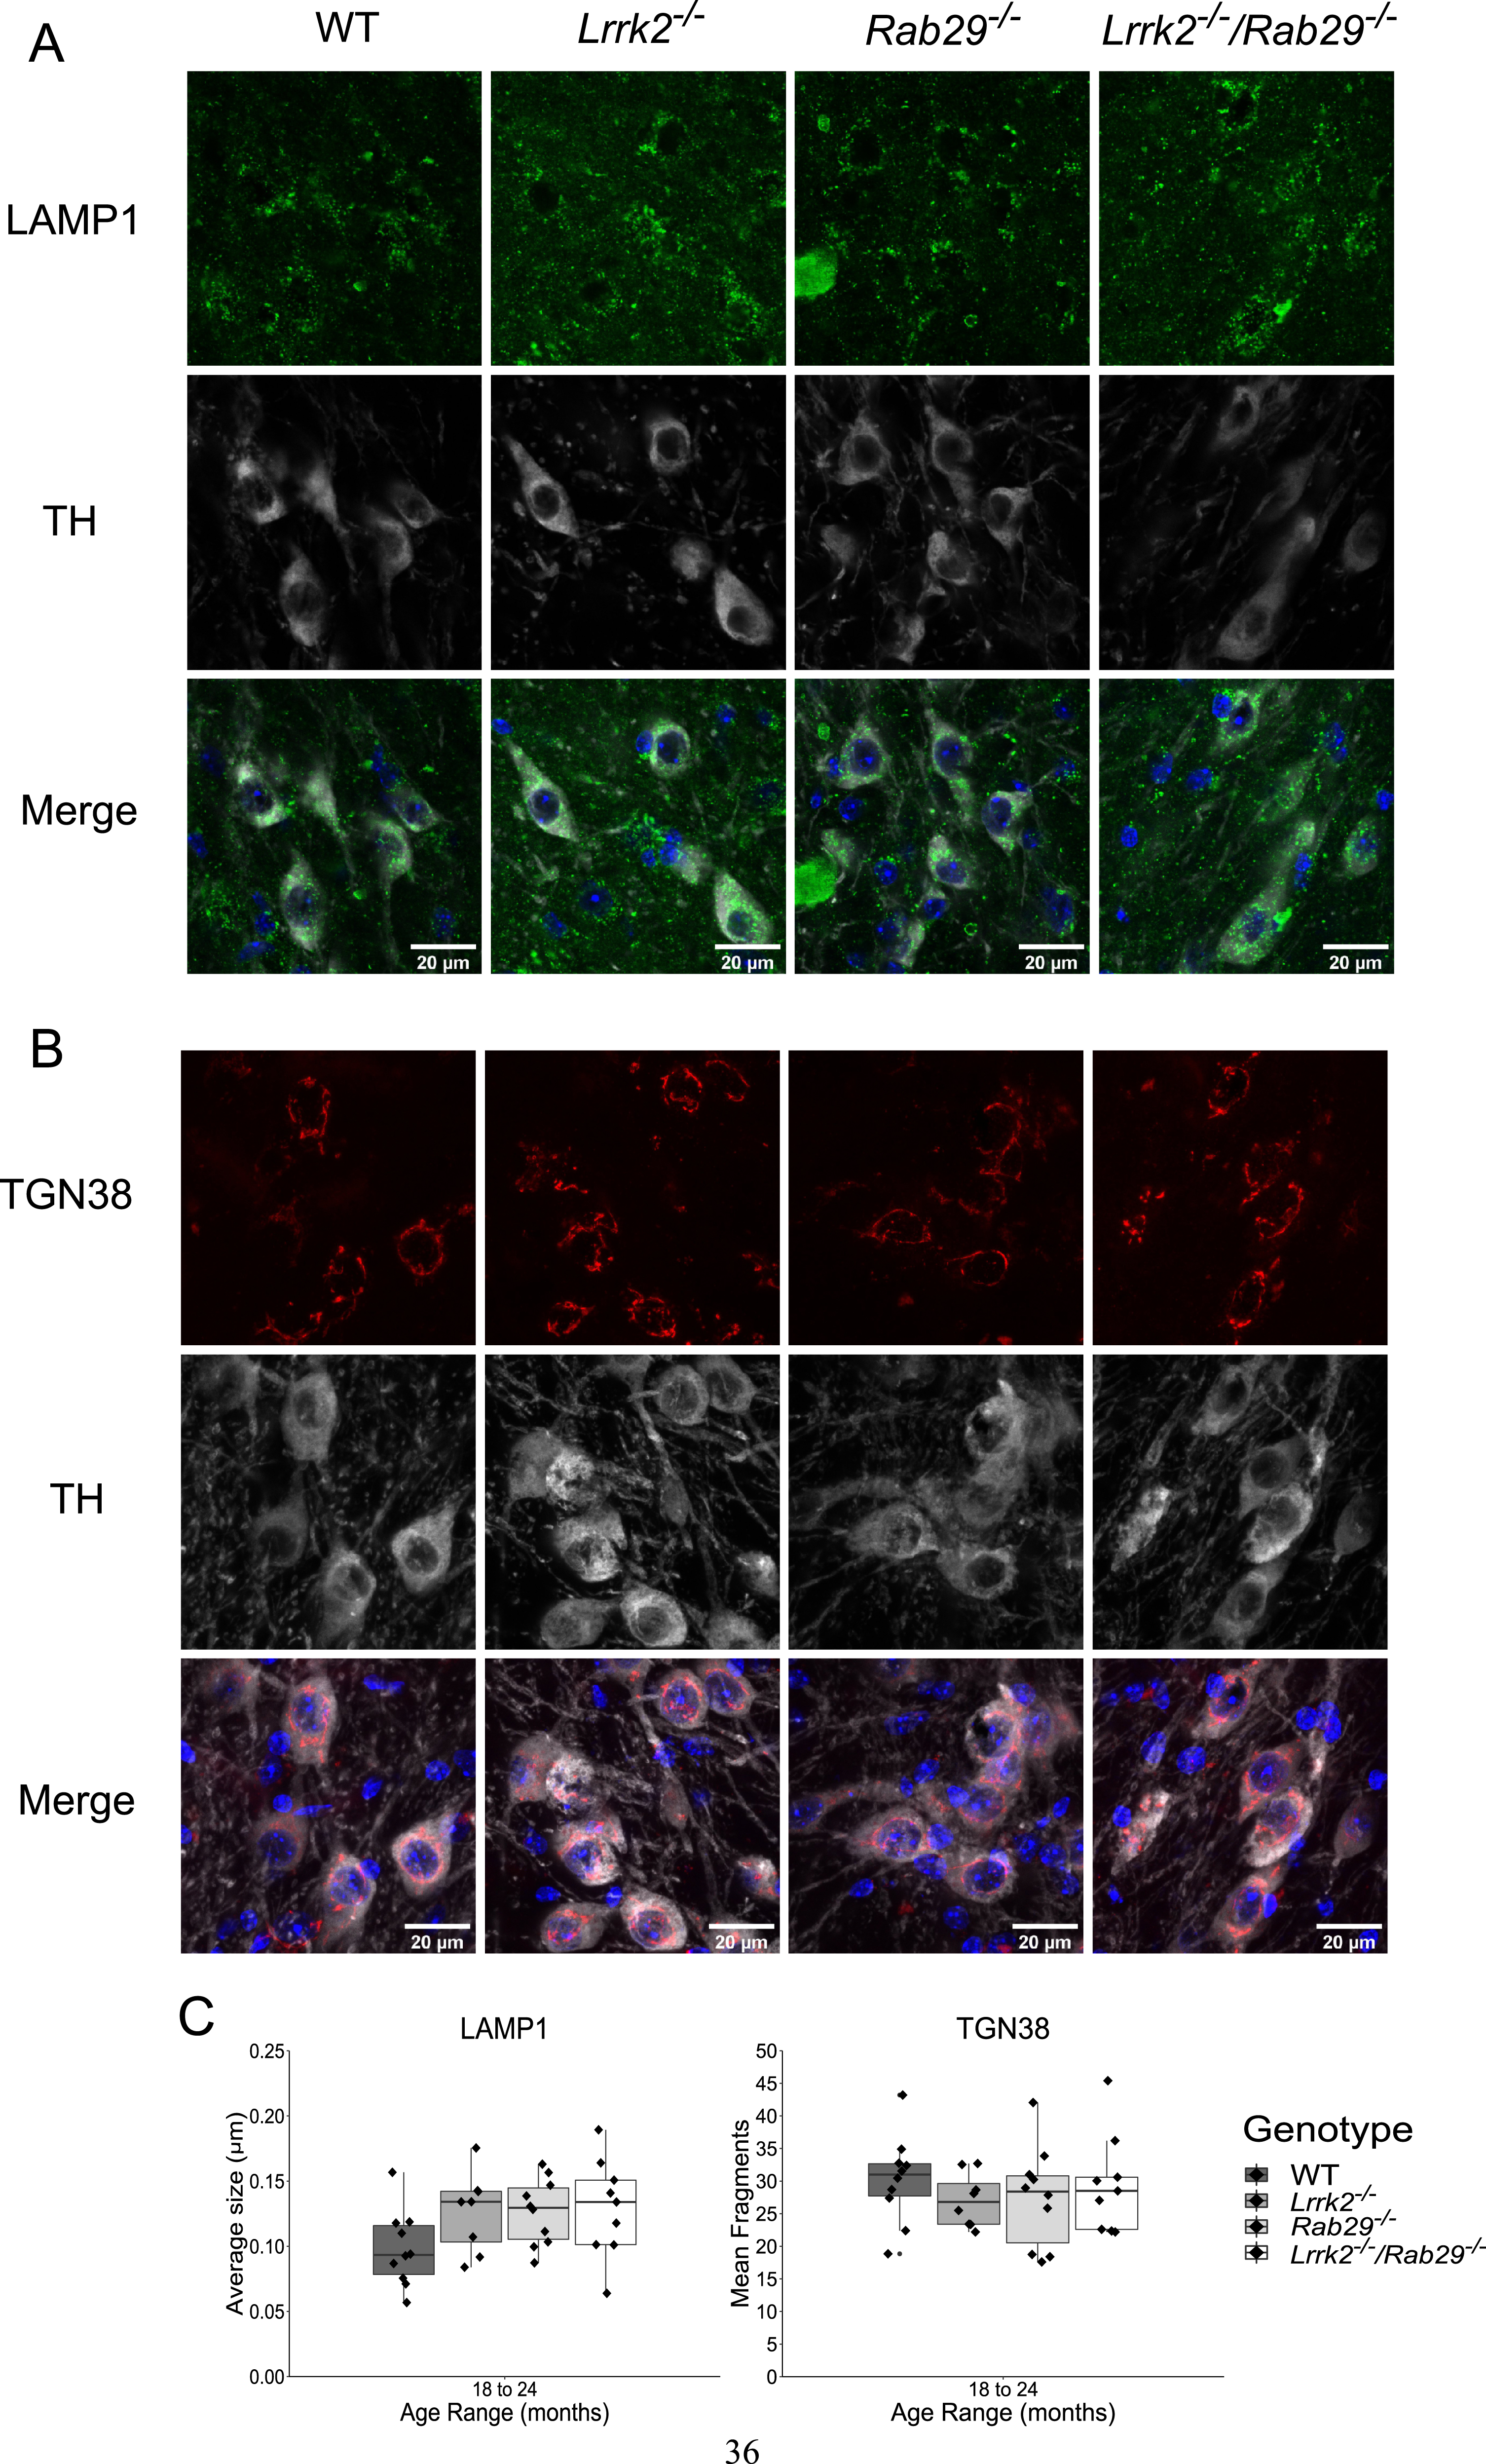
Determination of lysosomal size and TGN morphology differences in TH-positive neurons of 18–24 month single and double knockout mice. Immunohistochemistry images of cells stained for LAMP1 (green, A), TGN-38 (red, B), TH (gray), and Hoechst (blue). The average size of lysosomes was generated for 20 cells per animal which was then averaged for a single value per animal. The same strategy was used for the averaged number of TGN fragments (C).
Loss of TH protein in the striatum could indicate degeneration at the level of dopamine projections from the SNc. Striatal tissue was isolated from fresh frozen anterior brain and analyzed for TH expression by western blot. There were no differences among genotypes in striatal TH, normalized to GAPDH as loading control, expression (Fig. 7A). While this suggests that the DA projections are intact, DA neurotransmission may be independently affected. To investigate this possibility, striatal tissue was dissected for HPLC analysis of monoamine (norepinephrine (NE), DA, serotonin (5-HT)) and metabolite (3,4-dihydroxyphenylacetic acid (DOPAC), 5-hydroxyindoleacetic acid (5-HIAA)) tissue content. There were no differences across genotypes for monoamine or metabolite striatal content (Fig. 7B). DA and 5-HT turnover ratios were determined by dividing the metabolite by the respective monoamine. While DA turnover was not influenced by genotype, a main effect of genotype was found with 5-HT turnover (F3,32 = 3.87, p = 0.018n) where reduced ratios were observed in Rab29-/- and Lrrk2-/-/Rab29-/- mice compared to WT mice (all p < 0.05). Overall, this suggests that there was no pathological neurodegeneration observed in DA neurons at the level of the cell body in the SNc, striatal projections, or DA release. However, 5-HT turnover appeared to be compromised in a Rab29-/--dependent manner.
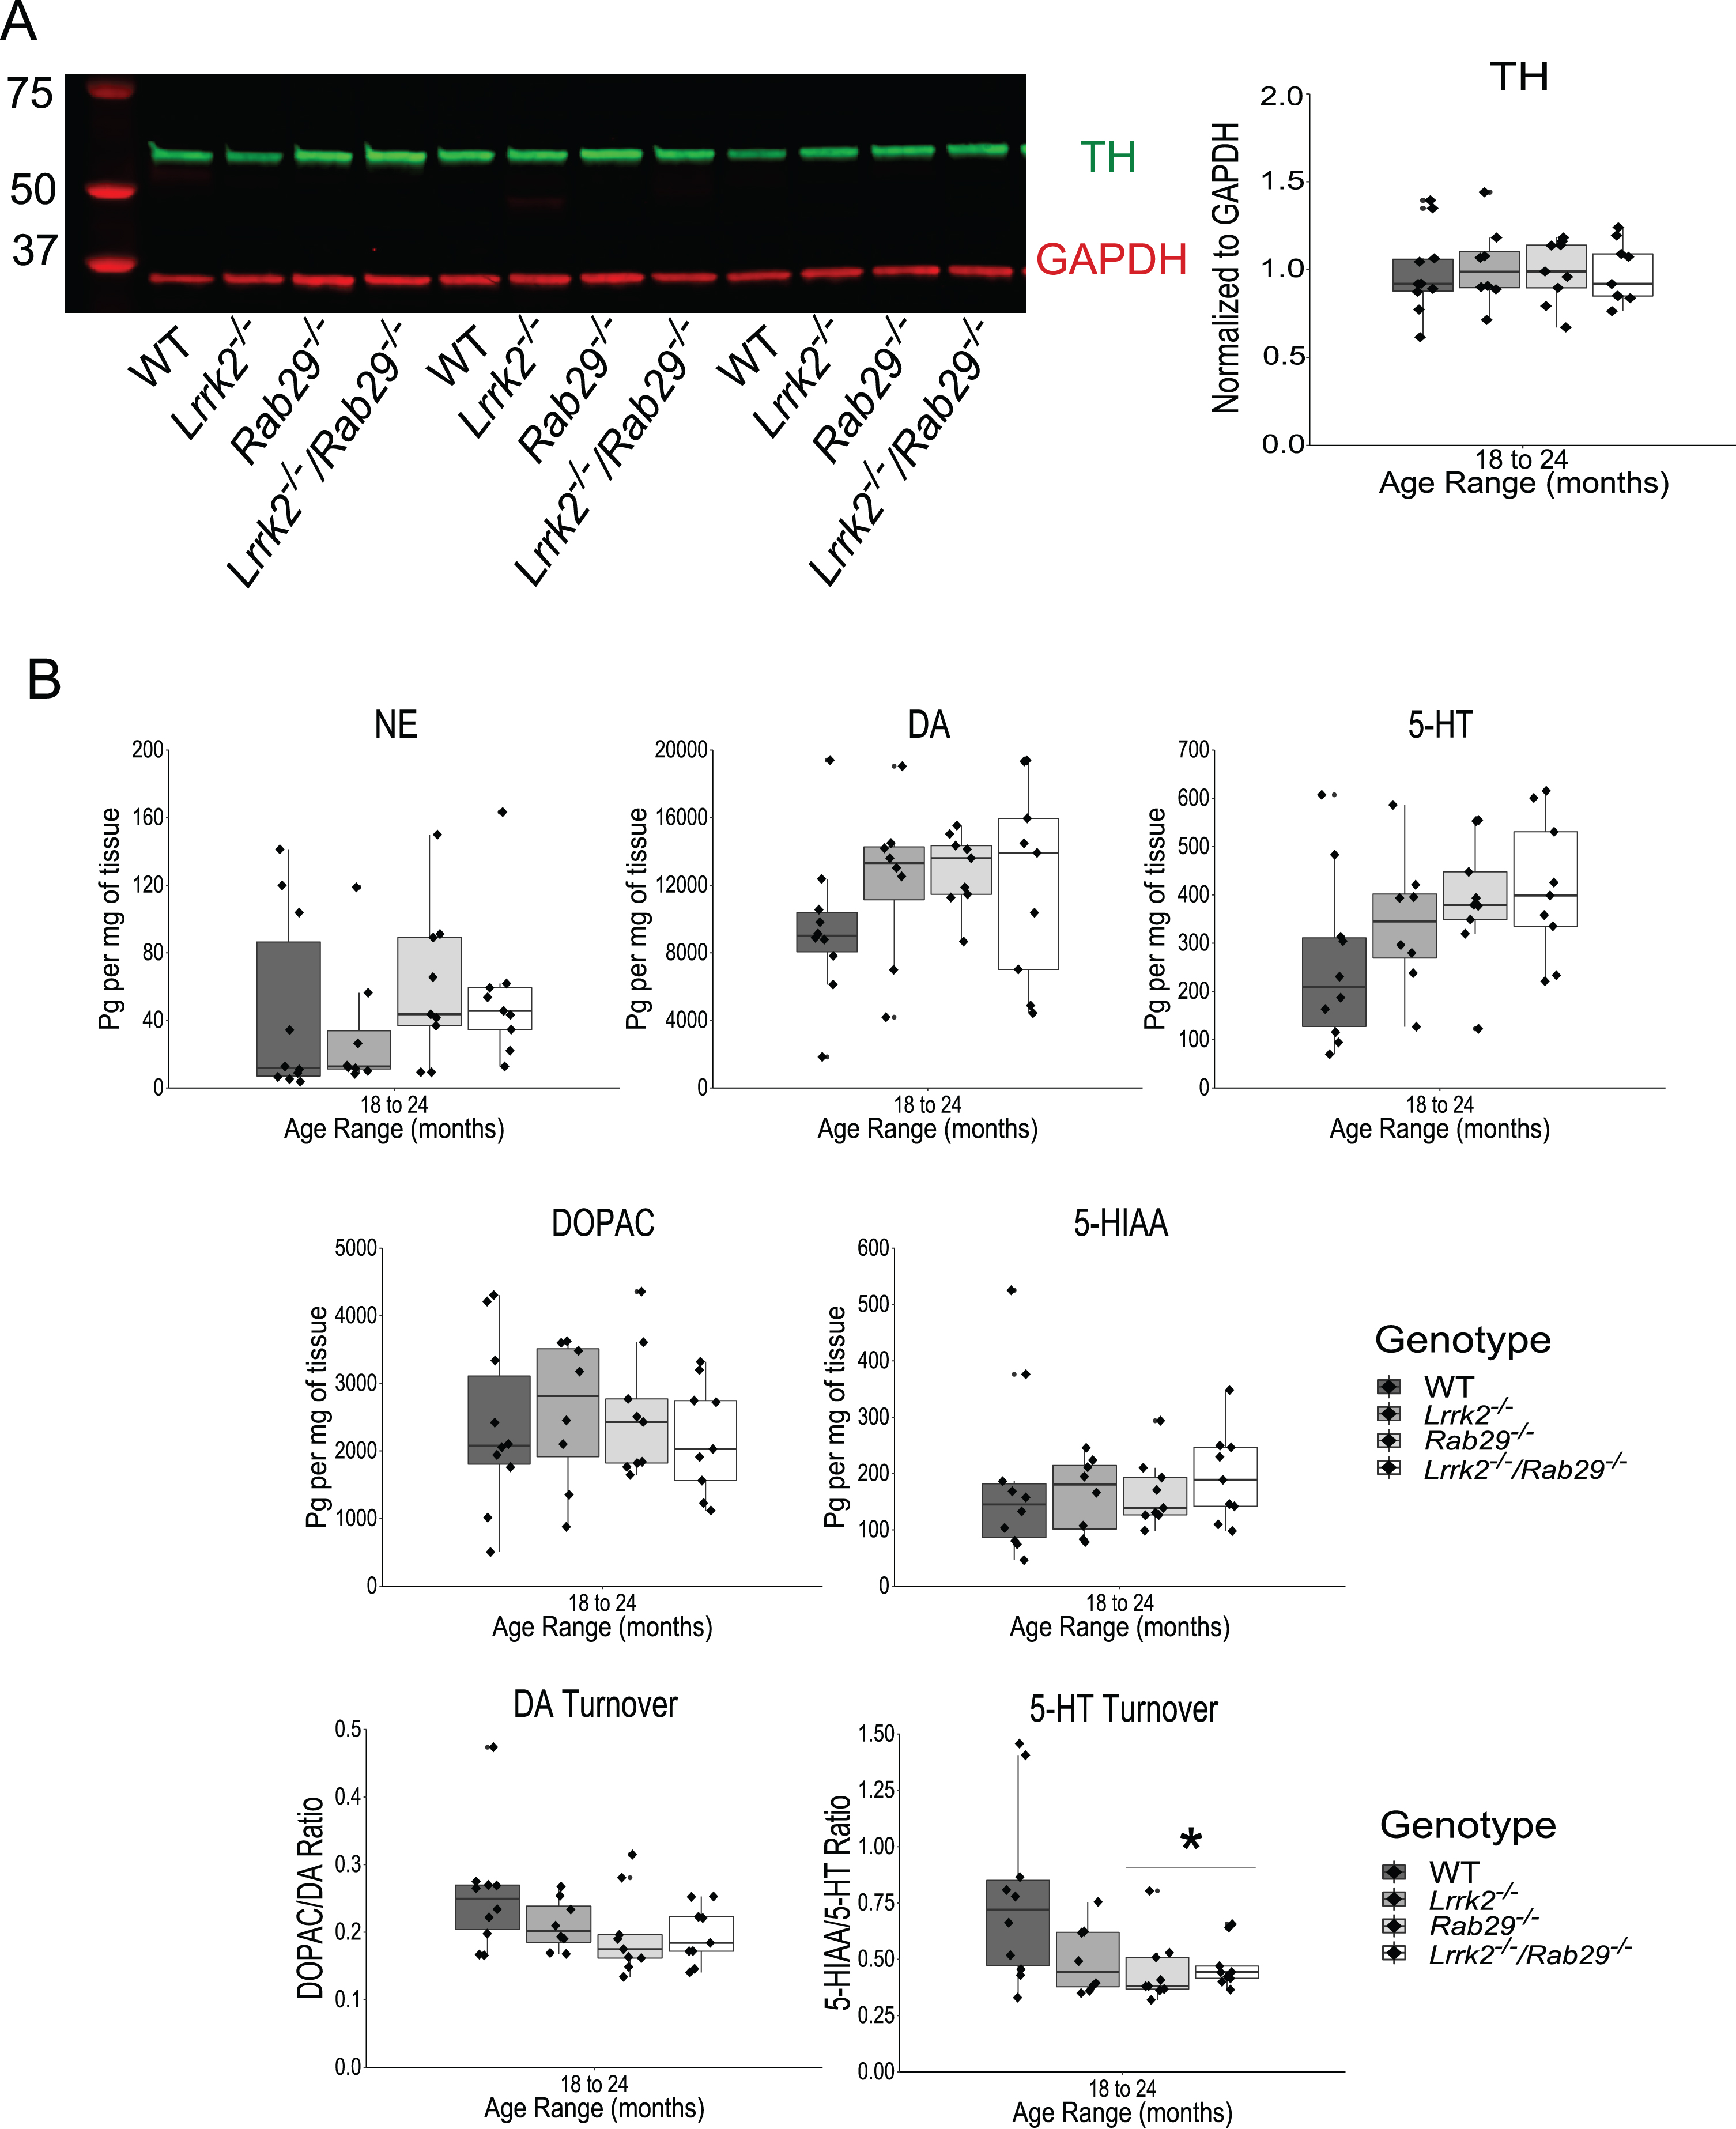
Analysis of striatal DA projections and monoamine content in 18–24 month single and double knockout mice. Western blot analysis of striatal tissue expression of TH and GAPDH (A). Striatal TH was normalized to GAPDH and quantified for genotype differences. HPLC analysis of striatal tissue to quantify monoamine (NE, DA, 5-HT), metabolite (DOPAC, 5-HIAA), and DA and 5-HT turnover (B). *p < 0.05 vs. WT.
DISCUSSION
Prior literature suggests that LRRK2 and RAB29 operate within the same genetic pathway [9, 43]. LRRK2 can phosphorylate membrane bound RAB29, which is normally resident at the TGN [21–22, 43]. This interaction indicates that RAB29 is a downstream effector of LRRK2, where it may mediate alterations in membrane trafficking and neurite outgrowth [31, 44]. Consistent with these ideas, hyperactive mutations in LRRK2 can enhance RAB29–dependent changes in TGN morphology and be rescued by RAB29 expression [14, 28]. However, overexpression of RAB29 can activate LRRK2, suggesting an upstream regulatory relationship of the GTPase on kinase activity [14, 27]. In addition, RAB29 and LRRK2 can affect lysosomal morphology in HEK cells [25]. Therefore, although it is clear that RAB29 and LRRK2 have related functions in cells, there are several uncertainties for direction of effect and the downstream outputs of this pathway [45].
To investigate the nature of the interaction be-tween these PD-related targets in vivo, we generated a LRRK2 and RAB29 double knockout (Lrrk2-/-/Rab29-/-) mouse model. A baseline characterization of PD-related behavior and pathology was performed to determine whether loss of both LRRK2 and RAB29 would result in brain phenotypes. No differences between genotypes were seen in measures of strength, working memory, or hyposmia. We noted a mild motor phenotype in the Rab29-/- and Lrrk2-/-/Rab29-/- animals, which we interpret to be dependent on RAB29, not LRRK2. Additionally, when looking specifically at the oldest age group (18-24 month), no differences in genotype were observed in DA-related pathology, including cell loss, projection damage, or neurotransmission, in the SNc and striatum. A non-significant trend was observed with elevated striatal DA levels in knockout animals compared to WT, but high variability and the number of animals per genotype likely prevented this effect from being determined at this time (F3,32 = 1.11, p = 0.359; Fig. 7B). Another caveat to the present report was the inclusion of a manual cell count for TH-positive neurons in the SNc rather than stereology which may have prevented the detection of subtle differences in DA cell count between genotypes. Age-related decline in DA metabolites have been reported in LRRK2 deficient rats, but not compared to their WT counterparts using in vivo microdialysis [46]. No genotype differences were found in other measures for PD-like pathology, such as elevated astrogliosis and microgliosis. However, a RAB29-dependent reduction was found in striatal 5-HT turnover. To the best of our knowledge, this is the first association between RAB29 and 5-HT and may be the underlying mechanism contributing towards the mild motor deficit we observed. While DA is typically the neurotransmitter of interest when considering PD motor symptoms, other systems, including 5-HT, contribute to both the motor and non-motor symptoms. Striatal 5-HT and 5-HIAA content is reduced in PD cases compared to controls [47]. Changes in the 5-HT system have been associated with anxiety and depression-like phenotypes observed in PD-related LRRK2 mutant mice [48]. However, these effects may be regionally specific as others report no differences in basal 5-HT or 5-HIAA in LRRK2 deficient rats using in vivo microdialysis although no discussion of turnover was mentioned [46]. The lack of robust behavioral phenotype and DA degeneration is consistent with previous reports on single LRRK2 and Rab29 knockout models [29–31]. The lack of CNS phenotypes unfortunately prevents an evaluation of the pathway relationship between LRRK2 and RAB29 at this time.
Elevated kinase activity associated with patho-genic LRRK2 mutations [10, 11] as well as increased LRRK2 phosphorylation associated with sporadic PD indicate that LRRK2 inhibition is a potential therapeutic strategy for PD patients [49]. Given the long duration and gradual nature of PD, chronic, ongoing treatment will be required and it is therefore important to understand the consequences of dampening LRRK2 kinase activity on a long-term basis. Information from knockout models and loss-of-function mutant carriers may grant some clarity towards this issue. As shown here, knocking out Lrrk2 and its interactor Rab29 had no significant effect on DA pathology related to PD in the aging mouse model, consistent with prior reports of single LRRK2 knockouts [29, 31]. However, double knockout of LRRK2 and LRRK1 is reported to cause early mortality and significant DA degeneration highlighting the importance of selectively targeting LRRK2 [50].
Overall, our results support the concept that the LRRK2-RAB29 pathway can be safely targeted for PD-related therapeutics, but suggest that LRRK2 remains the better target compared to RAB29 due to the mild motor and 5-HTergic phenotypes seen in the Rab29-/- and Lrrk2-/-/Rab29-/- animals. However, the lack of a robust brain phenotype precludes us from answering the question of the directional relationship between LRRK2 and RAB29 with the data presented here. There are peripheral phenotypes in models of LRRK2 deficiency, such as accumulation of lysosomal markers in the kidney and invasion of the alveolar space by type-II pneumocytes in the lung [31, 52]. Further studies on the peripheral phenotypes in the Rab29-/- and Lrrk2-/-/Rab29-/- animals will be required to clarify whether LRRK2 is upstream or downstream of RAB29 in vivo.
CONFLICT OF INTEREST
The authors have no conflict of interest to report.
Footnotes
ACKNOWLEDGMENTS
This work was supported, in part, by the NIMH IRP Rodent Behavioral Core (MH002952) and Intramural Research Program of the NIH, National Institute on Aging. Tissue preparation work was performed at the NICHD Microscopy and Imaging Core with the assistance of Mrs. Lynne Holtzclaw.