
Abstract
Background:
Parkinson’s disease (PD) is characterized by brain metabolic networks, specifically associated with motor and cognitive manifestations. Few studies have investigated network changes in cerebral hemispheres ipsilateral and contralateral to the clinically more affected body side.
Objective:
We examined hemispheric network abnormalities and their relationship to striatal dopaminergic deficits in PD patients at different stages.
Methods:
45 PD patients underwent dual-tracer positron emission tomography (PET) with 18F-fluorodeoxyglucose (FDG) and 18F-fluorodopa (FDOPA) in a high-resolution PET scanner. In all patients, we computed expression levels for the PD-related motor/cognition metabolic patterns (PDRP/PDCP) as well as putamen/caudate FDOPA uptake values in both hemispheres. Resulting hemispheric measures in the PD group were compared with corresponding healthy control values and assessed across disease stages.
Results:
Hemispheric PDRP and PDCP expression was significantly elevated contralateral and ipsilateral to the more affected body side in patients with unilateral symptoms (H&Y 1: p < 0.01) and in patients with bilateral limb involvement (H&Y 2-3: p < 0.001; H&Y 4: p < 0.003). Elevations in pattern expression were symmetrical at all disease stages. By contrast, FDOPA uptake in the caudate and putamen was reduced bilaterally (p < 0.002), with lower values on both sides at more advanced disease stages. Hemispheric uptake was asymmetrical in both striatal regions, with lower contralateral values at all disease stages. The magnitude of hemispheric uptake asymmetry was smaller with more advanced disease, reflecting greater change ipsilaterally.
Conclusion:
Symmetrical network expression in PD represents bilateral functional effects unrelated to nigrostriatal dopaminergic asymmetries.
INTRODUCTION
Spatial covariance analysis of 18F-fluorodeoxy glucose (FDG) positron emission tomography (PET) data has been used extensively to identify and validate specific metabolic topographies associated with the motor and cognitive manifestations of Parkinson’s disease (PD) [1–4]. The PD motor-related pattern (termed PDRP) is characterized by increased pallido– thalamic and pontine metabolic activity associated with relative reductions in premotor cortex, supplementary motor area (SMA), and parietal association regions. The PD cognition-related patterns (termed PDCP) is characterized by metabolic reductions in medial frontal and parietal association regions, and relative increases in cerebellar cortex and dentate nuclei [1]. The expression of each pattern in an individual’s metabolic brain image is denoted by a scalar measurement termed the subject score [1, 2]. The subject scores of the PDRP/PDCP discriminate between PD patients and healthy subjects in multiple populations worldwide [4]. PDRP and PDCP expression levels increase with disease progression in PD patients [1, 6], correlate with clinical and dopaminergic indices of disease severity in PD patients [6–9], and are modulated by antiparkinsonian treatment [6, 11].
There is growing evidence that network activity is elevated before the onset of PD motor symptoms. Increased PDRP expression has been noted in the “presymptomic” cerebral hemisphere approximately two years before the onset of symptoms on the contralateral body side [5]. PDRP expression has also been found elevated at levels intermediate between healthy subjects and early-stage PD in individuals with idiopathic REM sleep behavior disorder (iRBD), a prodromal syndrome that can precede motor onset by 5– 10 years [12–15]. A recent study also demonstrated that PDRP expression is abnormally elevated in both cerebral hemispheres in iRBD subjects with imaging evidence of striatal dopamine deficiency [16]. Furthermore, despite published studies on whole-brain expression of PD-related metabolic patterns [4, 6] and its correlation with bilateral loss of striatal dopaminergic integrity [6–8], scant information exists regarding the hemispheric behavior of these networks contralateral and ipsilateral to the more affected body side. Indeed, the relationship between hemispheric asymmetries in network activity and nigrostriatal dopaminergic deficiency is unclear. It is also unknown and important to explore whether the relationship observed in early-stage disease persists throughout the illness.
In this study, we examined the relationship between hemispheric PDRP and PDCP expression and striatal dopamine deficiency in a group of patients with unilateral motor symptoms (Hoehn & Yahr stage 1; “hemi-PD”). We then examined analogous relationships in individuals with moderate (H&Y 2-3) and more advanced (H&Y 4) disease. To achieve these goals, we scanned each patient with FDG, to quantify PDRP and PDCP metabolic network expression, and with 18F-fluorodopa (FDOPA) to measure nigrostriatal dopaminergic function in the caudate and putamen. In each subject, we assessed these measures on a hemisphere-by-hemisphere basis ipsilateral and contralateral to the worse affected limbs. Hemispheric asymmetries were computed for each measure and compared across the patient groups.
METHODS
Subjects
We conducted a retrospective study of 45 patients with PD (sex: 31 male/14 female; age: 57.6±10.5 years (mean±SD), range 30– 75 years, H&Y: 2.4±1.2, disease duration: 7.9±6.4 years) seen in the movement disorders clinic of the Department of Neurology at Cologne University Hospital. All patients underwent dual tracer PET imaging with FDG and FDOPA on a high-resolution 24 detector ring scanner (ECAT EXACT HR, Siemens CTI, Knoxville, TN). Details of the FDG and FDOPA PET protocols have been described previously [7]. This retrospective study was conducted under an approved protocol of the ethics committee of the Medical Faculty of the University of Cologne, as described elsewhere [7, 17]. Scans from the Cologne database were anonymized and deidentified before being transferred to the Feinstein Institutes for Medical Research for imaging analysis. All methods were performed in accordance with the relevant guidelines and regulations of the collaborating institutions; at no point was information provided that could lead to the identification of a participant. For this study, the inclusion criteria were: 1) clinical diagnosis of PD according to the established UK Brain Bank Criteria [18]; 2) a clinically more affected body side could be identified; and 3) the clinically more affected side was associated with lower FDOPA uptake in the contralateral striatum. We excluded subjects who 1) did not show clinical response to levodopa treatment, 2) had clinical signs and symptoms of dementia, or 3) had a history of stroke or brain surgery. The patients were then categorized by Hoehn and Yahr (H&Y) stages 1– 4. Based on their H&Y stages, the 45 PD patients were further assigned into three subgroups: the Mild PD subgroup included 15 H&Y 1 patients, the Moderate PD subgroup included 9 H&Y 2 and 9 H&Y 3 patients, and the Advanced PD subgroup included 12 H&Y 4 patients. For comparison with the 45 PD patients, we examined FDG PET scans from 19 sex-matched healthy control subjects (HC1; sex: 13 male/6 female; age: 42.3±13.9 years, range: 27– 70 years) studied at Cologne University Hospital; the age of the HC1 group was significantly younger (p < 0.001; Mann-Whitney U test) than the PD group. In the FDOPA studies of the PD patients, a second independent cohort comprised of 10 sex- and age-matched healthy controls (HC2; sex: 6 male/4 female; age: 48.1±12.2, range: 36– 71 years) was used.
Imaging data analysis
FDG PET scans were pre-processed using SPM 5 (Wellcome Trust Centre for Neuroimaging, London, UK) implemented in MATLAB 7.3 (Mathworks, Sherborn, MA). Images were spatially normalized and smoothed (FWHM 10×10×10 mm). For the 45 PD patients and 19 HC1 subjects, whole-brain PDRP and PDCP expression values (subject scores) were computed separately in each scan using ScanVP software (freely available upon request at https://feinsteinneuroscience.org). Individual pattern scores were z-transformed with reference to the corresponding values of the HC1 subjects, such that the HC1 group mean was 0 with a SD of 1 for the PDRP and PDCP, respectively [2, 19].
For each network, we also computed hemispheric pattern scores in the left and right hemispheres of each subject [5]. For PD patients, PDRP/PDCP scores computed in the hemispheres contralateral and ipsilateral to the body side with more pronounced motor symptoms were defined as Contralateral and Ipsilateral PDRP/PDCP scores, respectively. For HC1 subjects, the average left and right hemispheric scores of each pattern were calculated and used as the reference values in the comparisons with hemispheric PDRP/PDCP scores of PD patients. To account for the significant difference in age (p < 0.001) seen for the PD patients and HC1 subjects, we applied an age correction to the computed whole-brain, contralateral, and ipsilateral PDRP and PDCP scores in the HC1 subjects in order to minimize potential influence of healthy aging on pattern expression between the PD and HC1 groups. This was done using the linear relationships of whole-brain and hemispheric pattern expression with age determined in a large, independent sample of 73 healthy subjects (sex: 36 male/37 female; age: 51.0±17.6, range: 20– 80), as described previously [7].
For FDOPA data, two manually delineated regions of interest (ROI) were placed in the caudate and putamen in each hemisphere of PD and HC2 subjects. Uptake values in these ROIs were computed relative to the mean occipital FDOPA uptake as the reference, as described previously [7]. For each region, FDOPA uptake values in the contralateral and ipsilateral hemispheres of the PD patients were averaged and then compared to the left-right average uptake values in the HC2 subjects.
Statistical analysis
We used the Shapiro-Wilk test to examine the normality of data distribution of PDRP/PDCP scores and FDOPA uptake values in the PD and HC groups. Because PDRP scores were not normally distributed in the PD group (p < 0.001), we chose to use non-parametric statistical tests consistently for all imaging measures on comparisons between PD and HC groups or between the contralateral and ipsilateral hemispheres. Using Mann– Whitney U tests, we compared the whole-brain, contralateral, and ipsilateral PDRP/PDCP scores and putamen/caudate FDOPA uptake of the PD groups/subgroups with the left-right average values of the corresponding HC1 or HC2 group. Wilcoxon signed-rank tests were used to compare the contralateral and ipsilateral PDRP/PDCP scores and putamen/caudate FDOPA uptake to examine differences in each measure between hemispheres in the whole PD group and the Mild, Moderate, and Advanced PD subgroups. We also calculated non-parametric Spearman’s rank correlation coefficients (rs) to examine the relationship of putamen/caudate FDOPA uptake with the PDRP/PDCP scores on the whole-brain and hemispheric bases in the PD group. Spearman coefficients (rs) were also calculated for correlations of each imaging measure with H&Y ratings in the PD sample.
For comparisons across the three PD subgroups, we found that the data distribution of all imaging measures was normally distributed (p > 0.07) in each subgroup and, therefore, chose to use analysis of variance (ANOVA) models with post hoc Bonferroni’s correction for these analyses. Additional justifications for ANOVAs were that 1) there are currently no effective non-parametric forms of repeated measures ANOVA (RMANOVA) that we used to compare the contralateral and ipsilateral data across the three PD subgroups, and 2) ANOVA models are considered robust against violations of the data normality assumption [20, 21]. One-way ANOVA was used to examine changes in the whole-brain and hemispheric PDRP/PDCP scores, as well as in the contralateral-ipsilateral average and hemispheric putamen/caudate FDOPA uptake across the three PD subgroups. Each ANOVA was then followed by post-hoc Bonferroni’s tests for the correction of multiple comparisons between subgroups. To compare changes in PDRP/PDCP scores and putamen/caudate FDOPA uptake across the three PD subgroups between the two hemispheres, we performed two-way, 3×2 RMANOVA for each measure, with Hemispheres (contralateral and ipsilateral) defined as the within-subject factor and PD Subgroups (Mild, Moderate, and Advanced) as the between-subject factor. For each network and FDOPA measure, we calculated the asymmetry index by subtracting the contralateral and ipsilateral hemispheric values in each subject, and then used one-way ANOVA and post-hoc Bonferroni’s tests to examine changes in this index across the three PD subgroups. Multiple regression analyses were used to determine whether the relationships of the PDRP/PDCP measures (whole-brain, hemispheric, or asymmetry value) with corresponding putamen/caudate FDOPA measures were influenced by clinical severity (i.e., the PD Subgroup, as categorized by the H&Y ratings). In each multiple regression model, the predicted variable was the PDRP/PDCP measure, and the predictor variables were the putamen/caudate FDOPA measure, the PD Subgroup, and their interaction term.
Statistical analyses were performed in SAS Studio, and all results were considered significant at p < 0.05, two-tailed.
RESULTS
Demographic and clinical data of the whole group of 45 PD patients, and in the Mild (H&Y 1; n = 15), Moderate (H&Y 2/3; n = 18), and Advanced (H&Y 4; n = 12) PD subgroups, are presented in Table 1. No sex difference was present across the three PD subgroups (p = 0.54; Chi-square test). Age was significantly different (p < 0.001; one-way ANOVA) across the PD subgroups, while age at onset (p = 0.19; one-way ANOVA) and the left/right ratio of initially affected body side (p = 0.50; Chi-square test) were not different. Both disease duration and levodopa equivalent daily dosage (LEDD) were different across the PD subgroups (p < 0.001; one-way ANOVAs).
Demographic, clinical, and imaging data of Parkinson’s disease patients in the whole group and the three subgroups
Values are presented as mean (SD). H&Y Stage according to the Hoehn and Yahr scale. LEDD, Levodopa equivalent daily dosage; PD, Parkinson’s disease; PDRP, PD-related motor pattern; PDCP, PD-related cognitive pattern; FDOPA, 18F-fluorodopa. Contralateral and Ipsilateral: hemispheric values of each imaging measure computed in the cerebral hemispheres contralateral and ipsilateral to the more severely affected body side. Asymmetry Index: the difference between the contralateral and ipsilateral hemispheric values of each imaging measure. Contralateral and Ipsilateral Average: the average of contralateral and ipsilateral hemispheric values of each imaging measure. Whole-brain: PDRP and PDCP expression values computed in the whole brain.
Whole-brain metabolic network activity and contralateral-ipsilateral average FDOPA uptake in the striatum
Compared to the 19 HC1 subjects, PDRP expression values computed in the whole brain were significantly elevated in the 45 PD patients (Fig. 1A, left; p < 0.0001, Mann-Whitney U test), and in each of the three PD subgroups (Fig. 1A, right; Mild: p < 0.006, Moderate: p < 0.0007, Advanced: p = 0.001, Mann-Whitney U tests). Likewise, the whole-brain PDCP scores were also significantly higher in the PD group (Fig. 1B, left; p < 0.0007, Mann-Whitney U test) and each subgroup (Fig. 1B, right; Mild: p < 0.03, Moderate: p < 0.004, Advanced: p < 0.005; Mann-Whitney U tests) than the HC1 group. If age correction was not applied to the pattern scores of the younger HC1 subjects, the whole-brain expression values of both patterns remained significantly higher in the PD group (p < 0.0001; Mann-Whitney U tests) and each subgroup (PDRP: p < 0.0001; PDCP: p≤0.001). Moreover, the PDRP expression values were different across these PD subgroups (F(2,42) = 4.20, p < 0.03; one-way ANOVA), with significantly higher expression values in the Advanced patients than the Mild patients (p < 0.02, post hoc Bonferroni test). The PDCP scores were also different across the three PD subgroups (F(2,42) = 3.56, p < 0.04; one-way ANOVA), with significantly higher expression values in the Advanced patients than the Mild patients (p < 0.04, post hoc Bonferroni test).
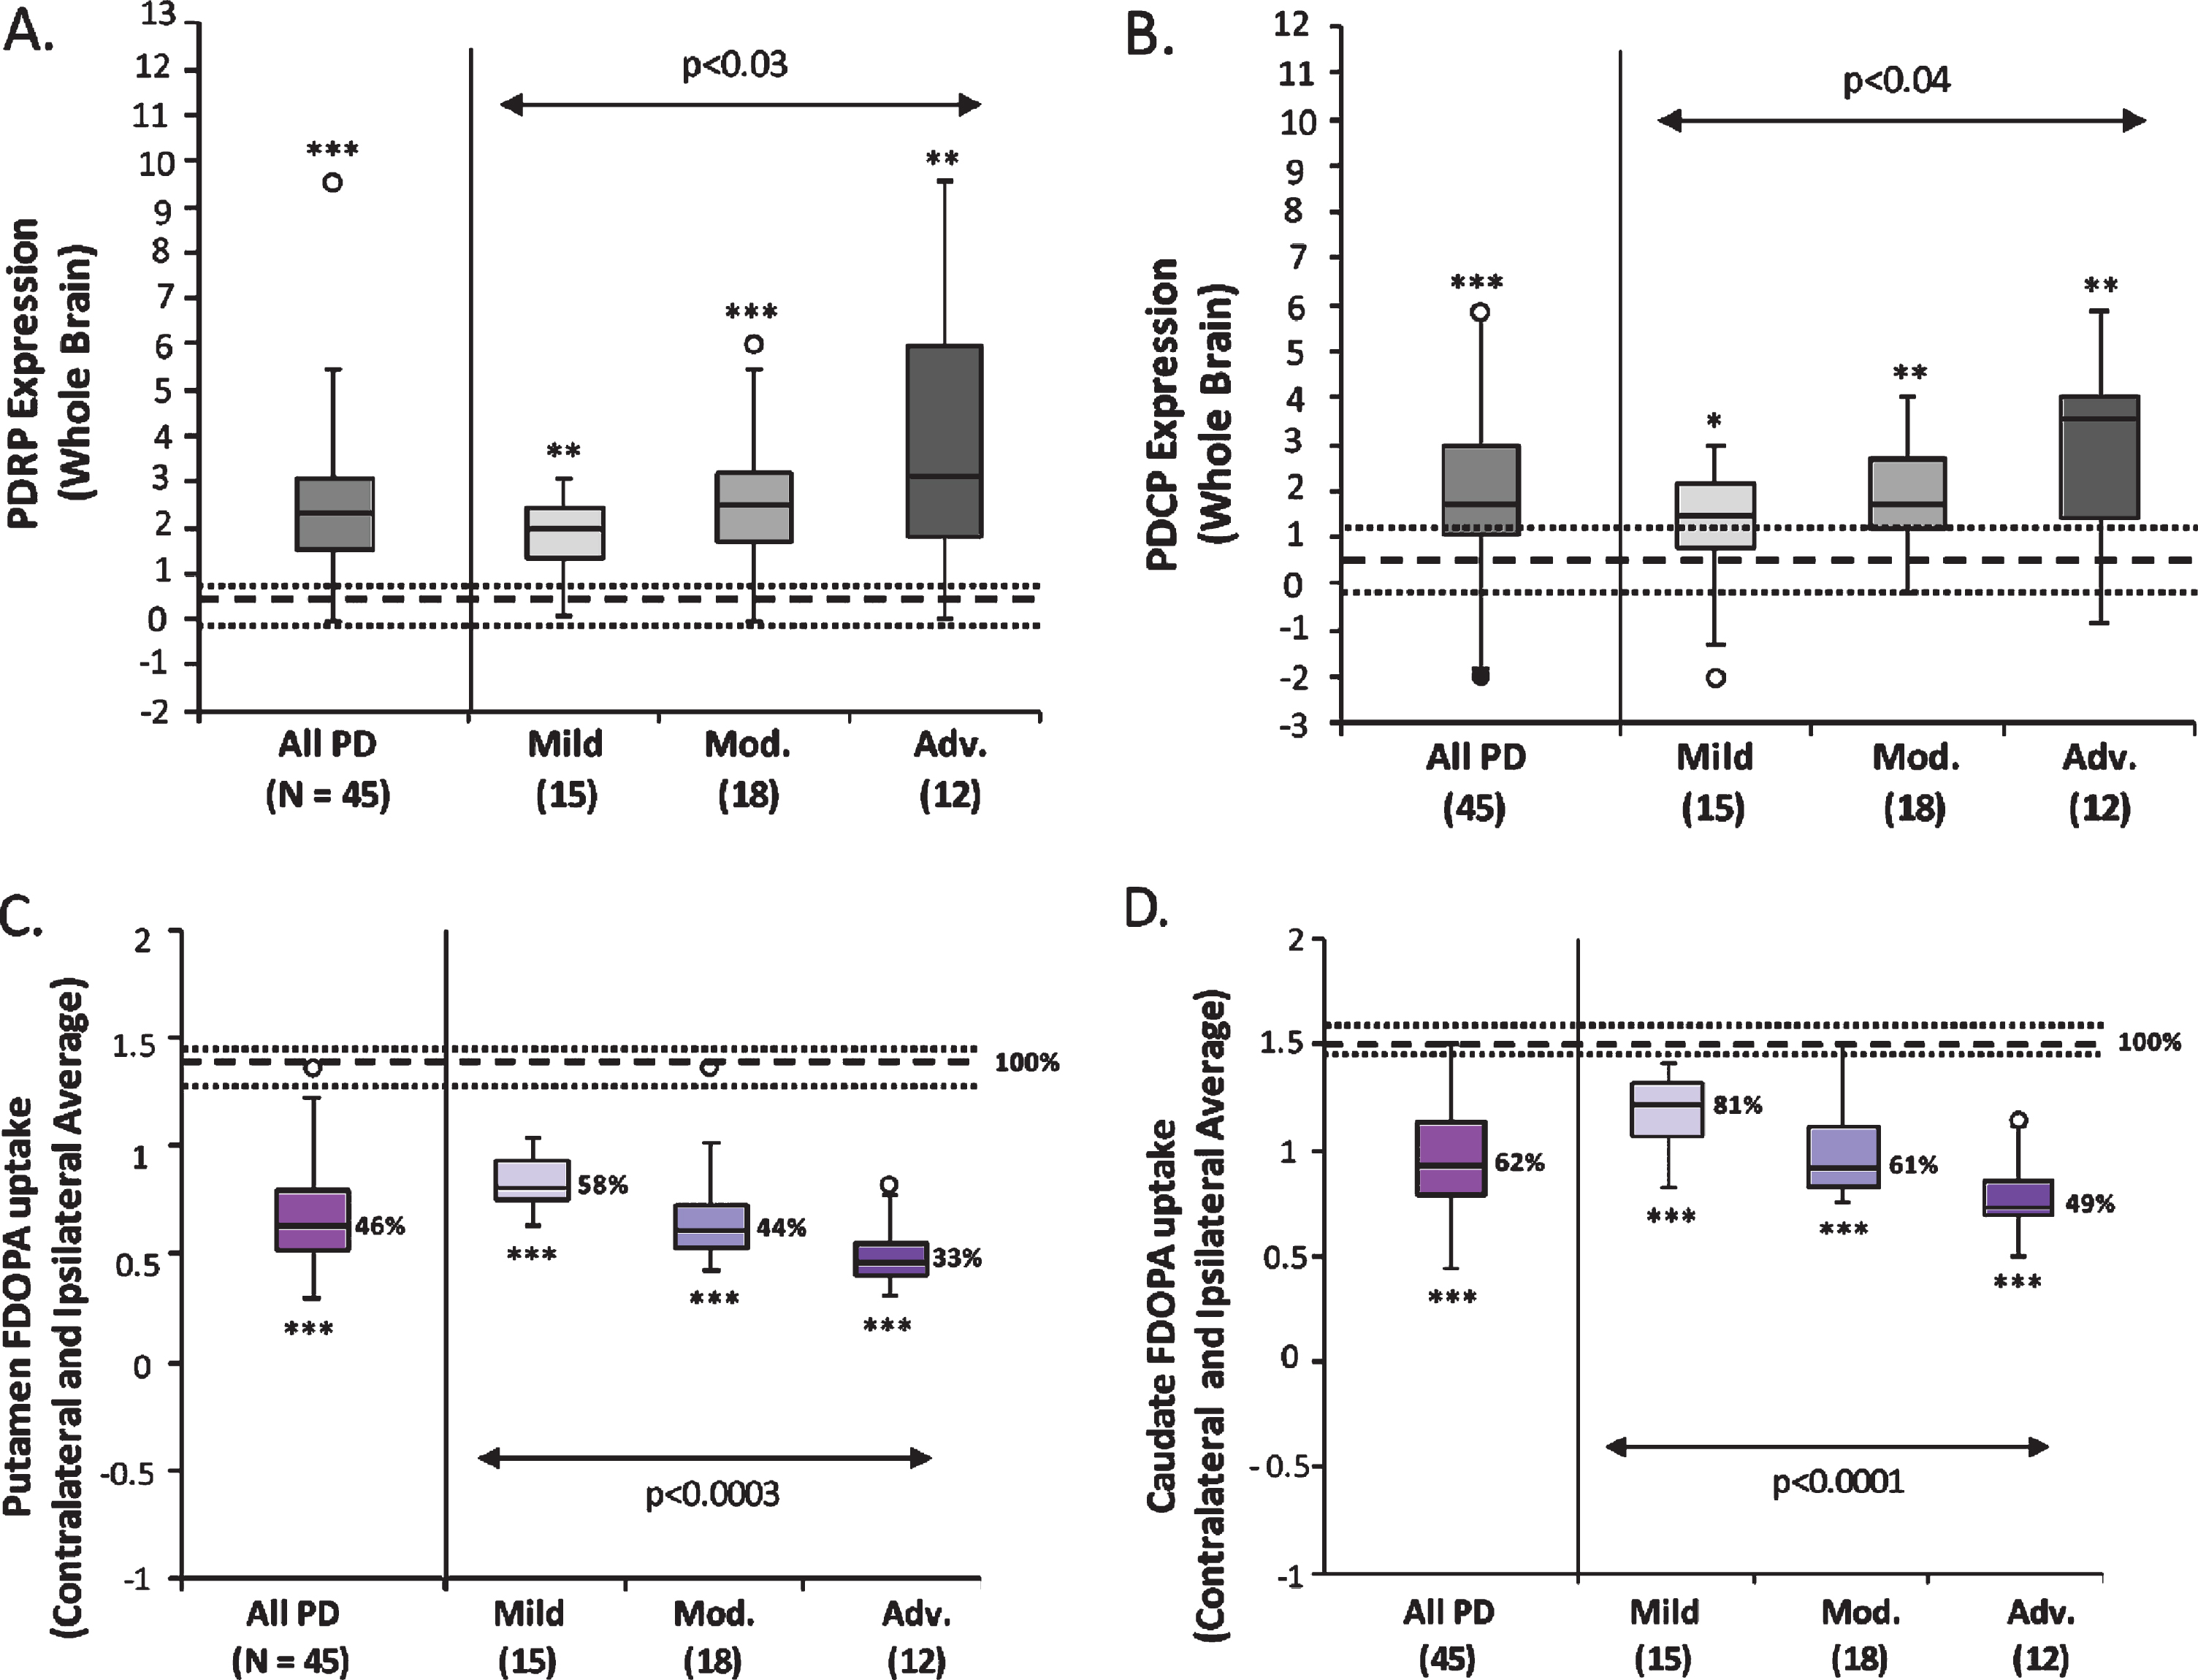
Whole-brain PD-related network activity and contralateral-ipsilateral average striatal FDOPA uptake. Box-whisker plots show the median whole-brain expression values (subject scores) of the PD-related motor (A, PDRP) and cognitive (B, PDCP) spatial covariance patterns, as well as the median putamen (C) and caudate (D) FDOPA uptake values (i.e., average of the contralateral and ipsilateral values in each region) in the 45 PD patients and the subgroups of 15 Mild (H&Y 1), 18 Moderate (9 H&Y 2 and 9 H&Y 3), and 12 Advanced (H&Y 4) PD patients. For both metabolic networks (A, B), pattern expression was elevated in the whole PD group (p < 0.0008) and in each of the three PD subgroups (p < 0.03), relative to 19 healthy control (HC1) subjects. Both PDRP and PDCP expression increased significantly across the three PD subgroups (p < 0.04). By contrast, both putamen and caudate FDOPA uptake (C, D) was lower in the PD group (p < 0.0001) and each subgroup (p < 0.0001) compared to 10 HC2 subjects. FDOPA uptake in both regions decreased significantly across the three PD subgroups (p < 0.0004). [In each plot, dotted lines represent 25% and 75% quartiles above and below the normal median (broken line) for each measure. Median FDOPA uptake values in each region (C, D) are shown as percent of the normal median (100%) in the PD group/subgroup. *p < 0.05, **p < 0.01, ***p < 0.001, Mann-Whitney U tests compared to healthy controls.]
Compared to the 10 age-matched HC2 subjects, putamen FDOPA uptake (i.e., average of the contralateral and ipsilateral values) were significantly lower in the 45 PD patients (Fig. 1C, left; p < 0.0001, Mann-Whitney U test), and in each of the three PD subgroups (Fig. 1C, right; p < 0.0001, Mann-Whitney U tests). The putamen FDOPA uptake was different across these PD subgroups (F(2,42) = 10.74, p < 0.0003; one-way ANOVA), with significantly lower uptake values in the Advanced patients than both the Mild (p = 0.0001, post hoc Bonferroni test) and Moderate patients (p < 0.04, post hoc Bonferroni test); a trend of decline (p = 0.08) was also present between Mild and Moderate patients. Likewise, caudate FDOPA uptake was significantly lower in the 45 PD patients (Fig. 1D, left; p < 0.0001, Mann-Whitney U test), and in each of the three PD subgroups (Fig. 1D, right; p < 0.0001, Mann-Whitney U tests) compared to the HC2 group. The caudate FDOPA uptake was different across these PD subgroups (F(2,42) = 18.75, p < 0.0001; one-way ANOVA), with significantly lower uptake values in the Moderate (p < 0.004, post hoc Bonferroni test) and Advanced patients (p < 0.0001, post hoc Bonferroni test) than the Mild patients; a significant decline was present between Moderate and Advanced patients (p < 0.02).
In the 45 PD patients, the whole-brain PDRP and PDCP scores significantly correlated with each other (rs = 0.70, p < 0.0001), as did the putamen and caudate FDOPA uptake values (rs = 0.94, p < 0.0001). The whole-brain PDRP and PDCP scores did not correlate with the putamen or caudate FDOPA uptake values in this group (p > 0.11); these relationships remained non-significant (F (5,39) < 1.93, p > 0.11) after adding PD Subgroup into the regression model.
Hemispheric PDRP/PDCP expression and putamen/caudate FDOPA uptake
PDRP and PDCP scores computed on the hemispheric basis were significantly elevated in both the contralateral and ipsilateral hemispheres of the 45 PD patients (Fig. 2A, D, left; p < 0.0001; Mann-Whitney U tests), as well as for each of the three PD subgroups (Fig. 2A, D, right; PDRP: p < 0.006; PDCP: p < 0.01) compared to the corresponding values of 19 HC subjects. Without age correction being applied, the results were still significant for the contralateral and ipsilateral expression of both patterns in the PD group (p < 0.0001; Mann-Whitney U tests) and each subgroup (PDRP: p < 0.0004; PDCP: p < 0.002). The scores of both patterns were not different between the two hemispheres in either the whole PD group (p > 0.36; Wilcoxon signed-rank tests) or any of the three PD subgroups (p > 0.22). For both PDRP and PDCP networks, the hemispheric scores increased in parallel in both hemispheres across the three PD subgroups (Fig. 2A, D, right), indicated by a significant main effect of PD Subgroup (PDRP: F(2, 42) = 52.64, p < 0.0001; PDCP: F(2, 42) = 73.0, p < 0.0001; two-way RMANOVAs) and a non-significant Hemisphere×PD subgroup interaction effect (PDRP: F(2,42) = 0.19, p = 0.82; PDCP: F(2,42) = 0.19, p = 0.83). Indeed, one-way ANOVAs further demonstrated that the hemispheric scores of both patterns were different across the PD subgroups in the contralateral (PDRP: F(2,42) = 4.20, p < 0.03; PDCP: F(2,42) = 3.31, p < 0.05) and ipsilateral (PDRP: F(2,42) = 3.89, p < 0.03; PDCP: F(2,42) = 3.24, p < 0.05) hemispheres, with significantly higher expression values of both networks in the Advanced patients than the Mild patients in the two hemispheres (PDRP: p < 0.03; PDCP: p < 0.05; post hoc Bonferroni tests). Additionally, the main effect of Hemisphere in the RMANOVAs was not significant across all three PD subgroups on the hemispheric scores of both patterns (PDRP: F(1,42) = 0.94, p = 0.34; PDCP: F(1,42) = 0.32, p = 0.57; two-way RMANOVAs). Moreover, both the PDRP and PDCP asymmetry index values (i.e., difference between the contralateral and ipsilateral pattern scores) remained unchanged across the Mild, Moderate, and Advanced PD subgroups (Fig. 2B, E; PDRP: F(2,42) = 0.19, p = 0.82; PDCP: F(2,42) = 0.19, p = 0.83; one-way ANOVAs).
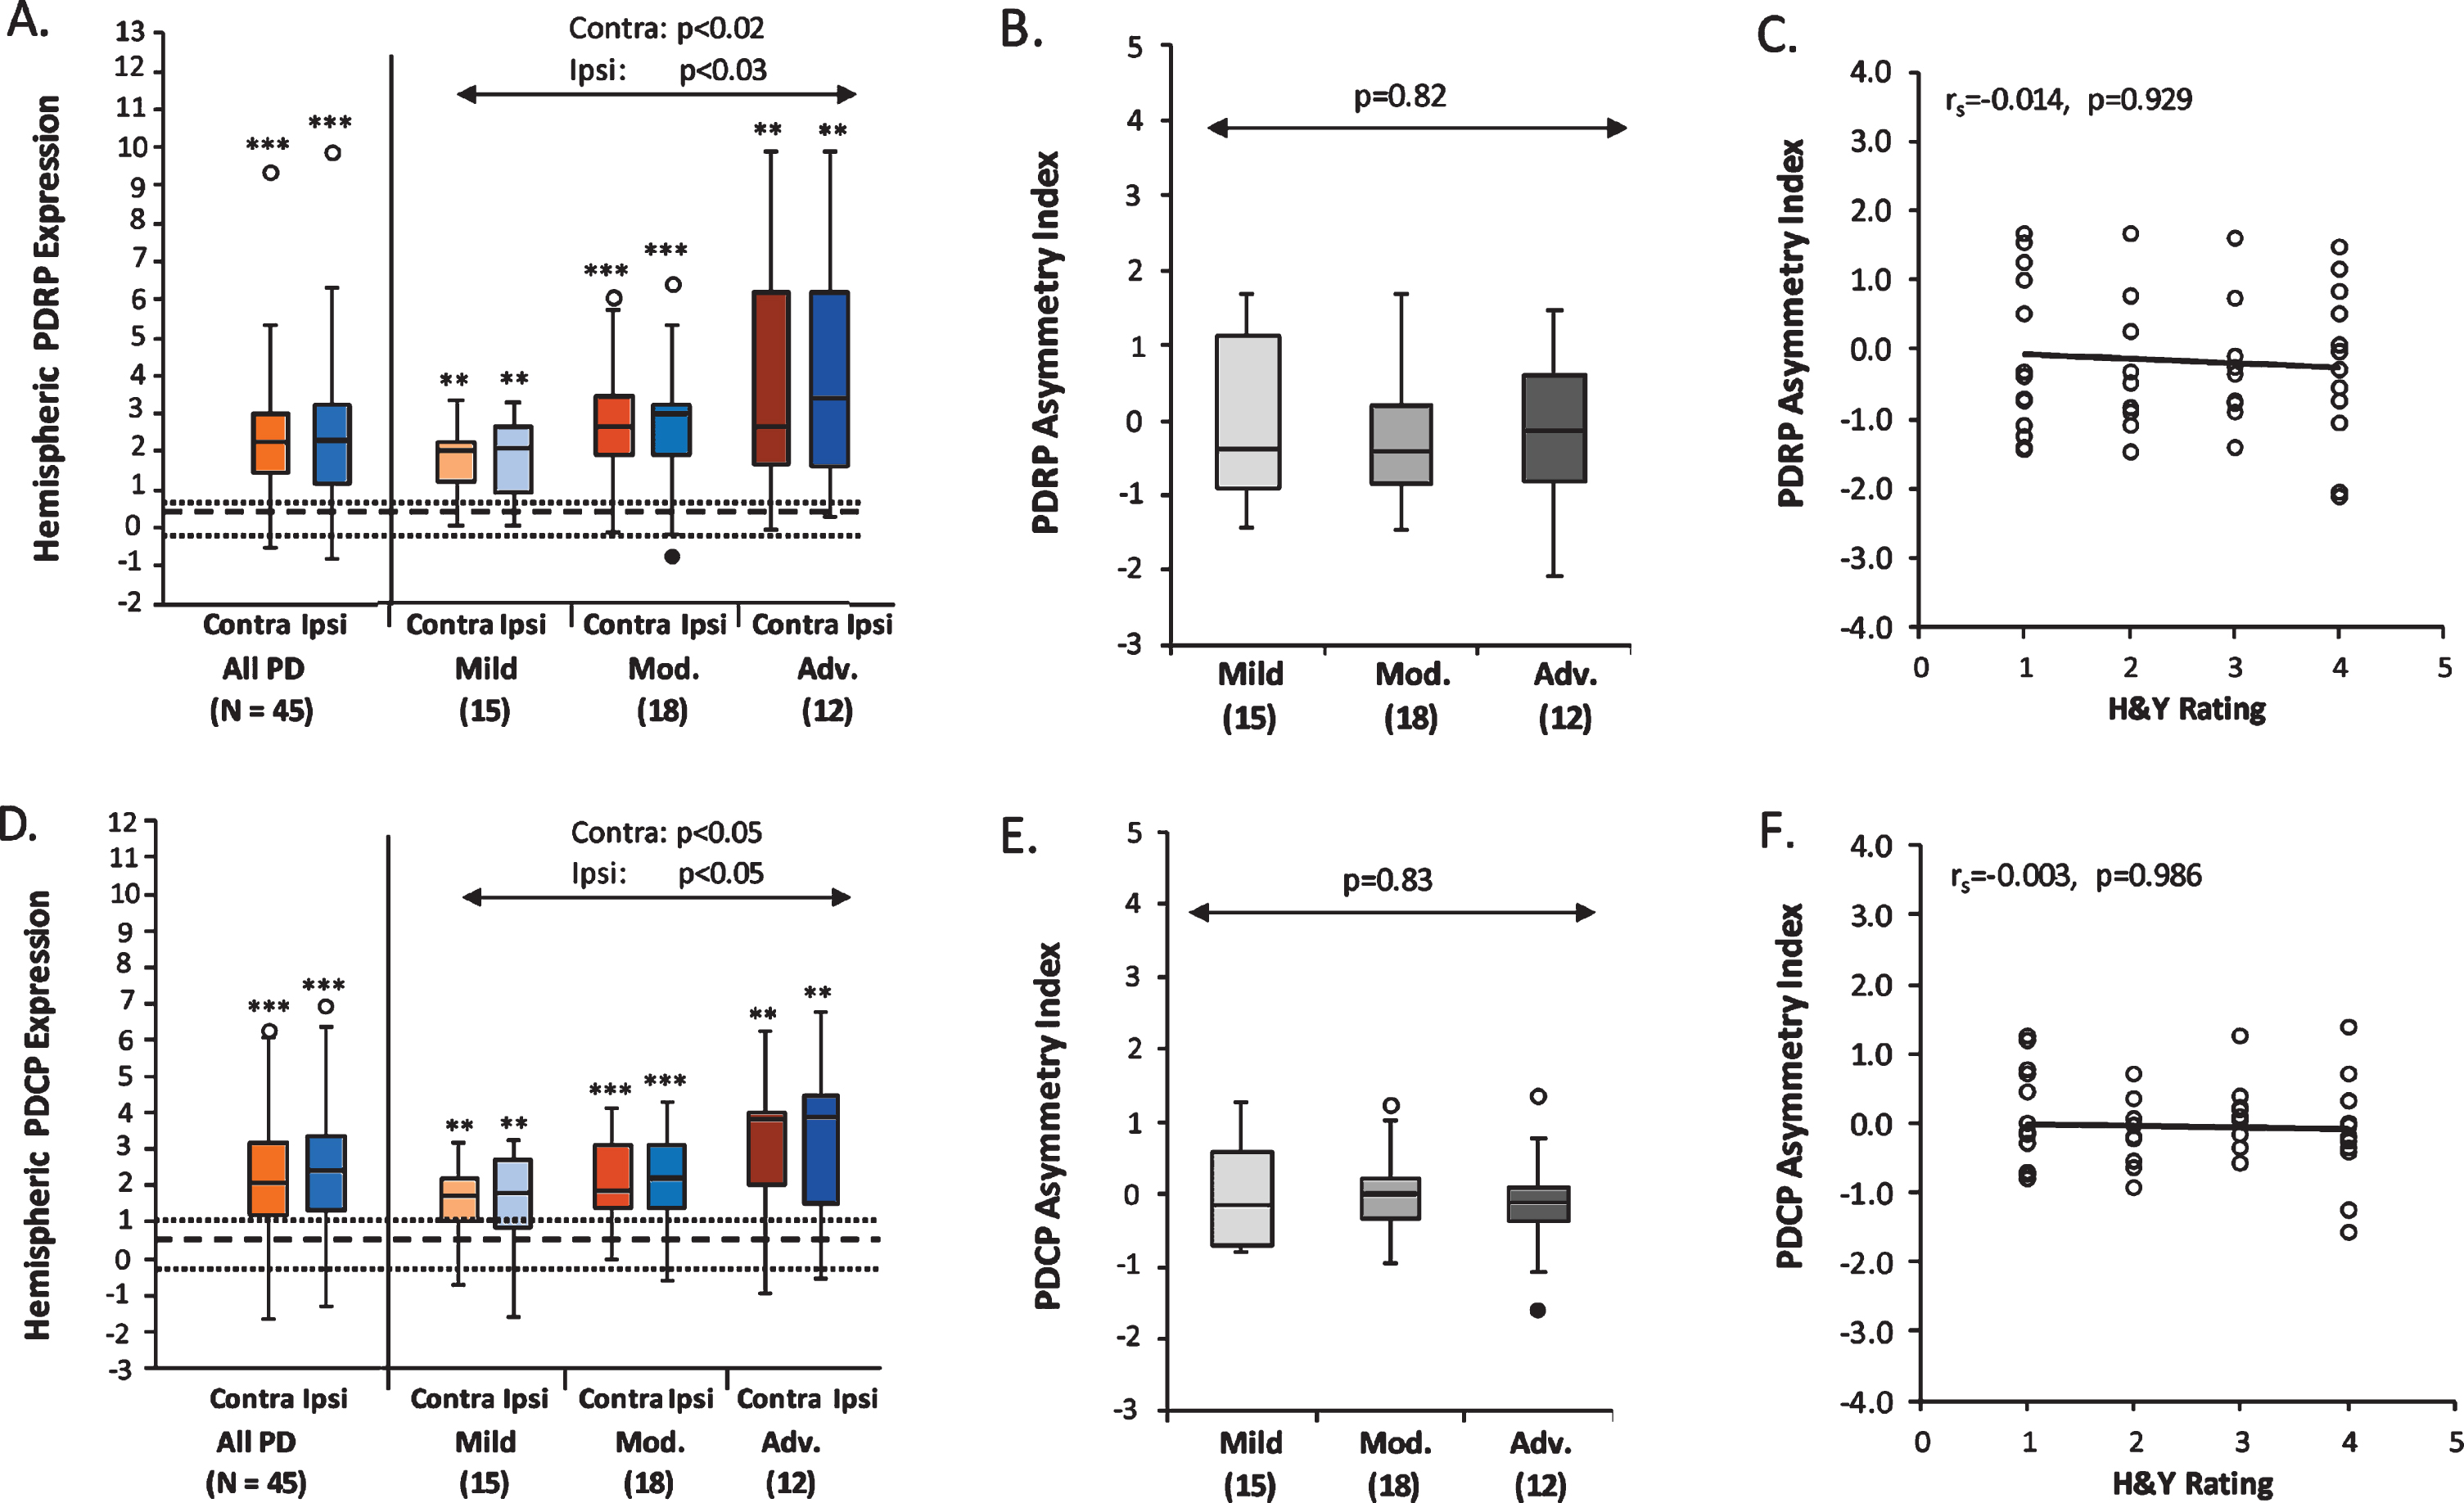
Hemispheric PDRP and PDCP Expression. PDRP (A) and PDCP (D) scores were elevated in both the contralateral and ipsilateral hemispheres relative to healthy controls (PDRP: p < 0.006; PDCP: p < 0.01), and were symmetrical between hemispheres in the whole PD group and the Mild, Moderate, and Advanced PD subgroups (PDRP: p > 0.22; PDCP: p > 0.38). The hemispheric PDRP (A) and PDCP (D) scores were significantly increased across the PD subgroups (PDRP: p < 0.03; PDCP: p < 0.05) at similar rates (PDRP: p = 0.82; PDCP: p = 0.19) in both hemispheres. PDRP and PDCP asymmetry index values remained unchanged across the three PD subgroups (B, PDRP: p = 0.82; E, PDCP: p = 0.83), and did not correlate with H&Y ratings in the PD subjects (C, PDRP: p = 0.93; F, PDCP: p = 0.99).
FDOPA uptake values in the putamen and caudate were both significantly lower in the contralateral and ipsilateral hemispheres of all 45 PD patients (Fig. 3A, D, left; p < 0.0001; Mann-Whitney U tests) and for each of the three PD subgroups (Fig. 3A, D, right; putamen: p < 0.0001; caudate: p < 0.002; Mann-Whitney U tests), compared to the corresponding values of 10 HC subjects. In comparing FDOPA uptake between hemispheres, the contralateral putamen FDOPA uptake was significantly lower than the ipsilateral uptake values in the whole PD group (p < 0.0001; Wilcoxon signed-rank test) and in each of the three PD subgroups (p < 0.0005; Wilcoxon signed-rank tests). Caudate FDOPA uptake in the contralateral hemisphere was significantly lower than for the ipsilateral side in the whole PD group (p < 0.0001; Wilcoxon signed-rank test), and in the Mild (p < 0.0003) and Moderate (p < 0.0006) subgroups, but not in the Advanced subgroup (p = 0.27). In both putamen and caudate (Fig. 3A, D, right), there was a significant Hemisphere×PD Subgroup interaction effect (putamen: F(2,42) = 9.05, p = 0.0005; caudate: F(2,42) = 5.89, p < 0.006; two-way RMANOVAs), suggesting that the rates of decrease in the hemispheric FDOPA uptake of both regions were different between the two hemispheres across the three PD subgroups. In the putamen, the contralateral FDOPA uptake was different across the PD subgroups (F(2,42) = 6.73, p < 0.003; one-way ANOVA), with significantly lower expression values in the Advanced patients than the Mild (p < 0.003; post hoc Bonferroni test) and Moderate (p < 0.04) patients, while no difference was present between the Mild and Moderate patients (p = 0.45). In the ipsilateral hemisphere, the putamen FDOPA uptake was also different across the three PD subgroups (F(2,42) = 13.30, p < 0.0001; one-way ANOVA); the Advanced patients had significantly lower uptake than both the Mild (p < 0.0001; post hoc Bonferroni test) and Moderate (p < 0.05) patients, and the Moderate patients also showed lower uptake than the Mild patients (p < 0.02). In the caudate, both the contralateral (F(2,42) = 12.91, p < 0.0001; one-way ANOVA) and ipsilateral (F(2,42) = 23.38, p < 0.0001; one-way ANOVA) FDOPA uptake was different across the three PD subgroups. In both hemispheres, the Advanced patients had significantly lower uptake than the Mild (p < 0.0001; post hoc Bonferroni tests) and Moderate (contralateral: p < 0.05; ipsilateral: p < 0.004) patients, and the Moderate patients also showed lower uptake than the Mild patients (contralateral: p < 0.02; ipsilateral: p < 0.002). Furthermore, the asymmetry index values of both the putamen and caudate FDOPA uptake differed significantly across the three PD subgroups (Fig. 3B, E; putamen: F(2,42) = 9.05, p < 0.0006; caudate: F(2,42) = 5.89, p < 0.006; one-way ANOVAs). The FDOPA uptake asymmetry in the putamen was significantly reduced in both the Moderate (p < 0.005; post hoc Bonferroni test) and Advanced patients (p < 0.002) relative to the Mild patients, while the asymmetry index of caudate FDOPA uptake was significantly reduced only in the Advanced patients relative to the Mild patients (p < 0.005; post hoc Bonferroni test).
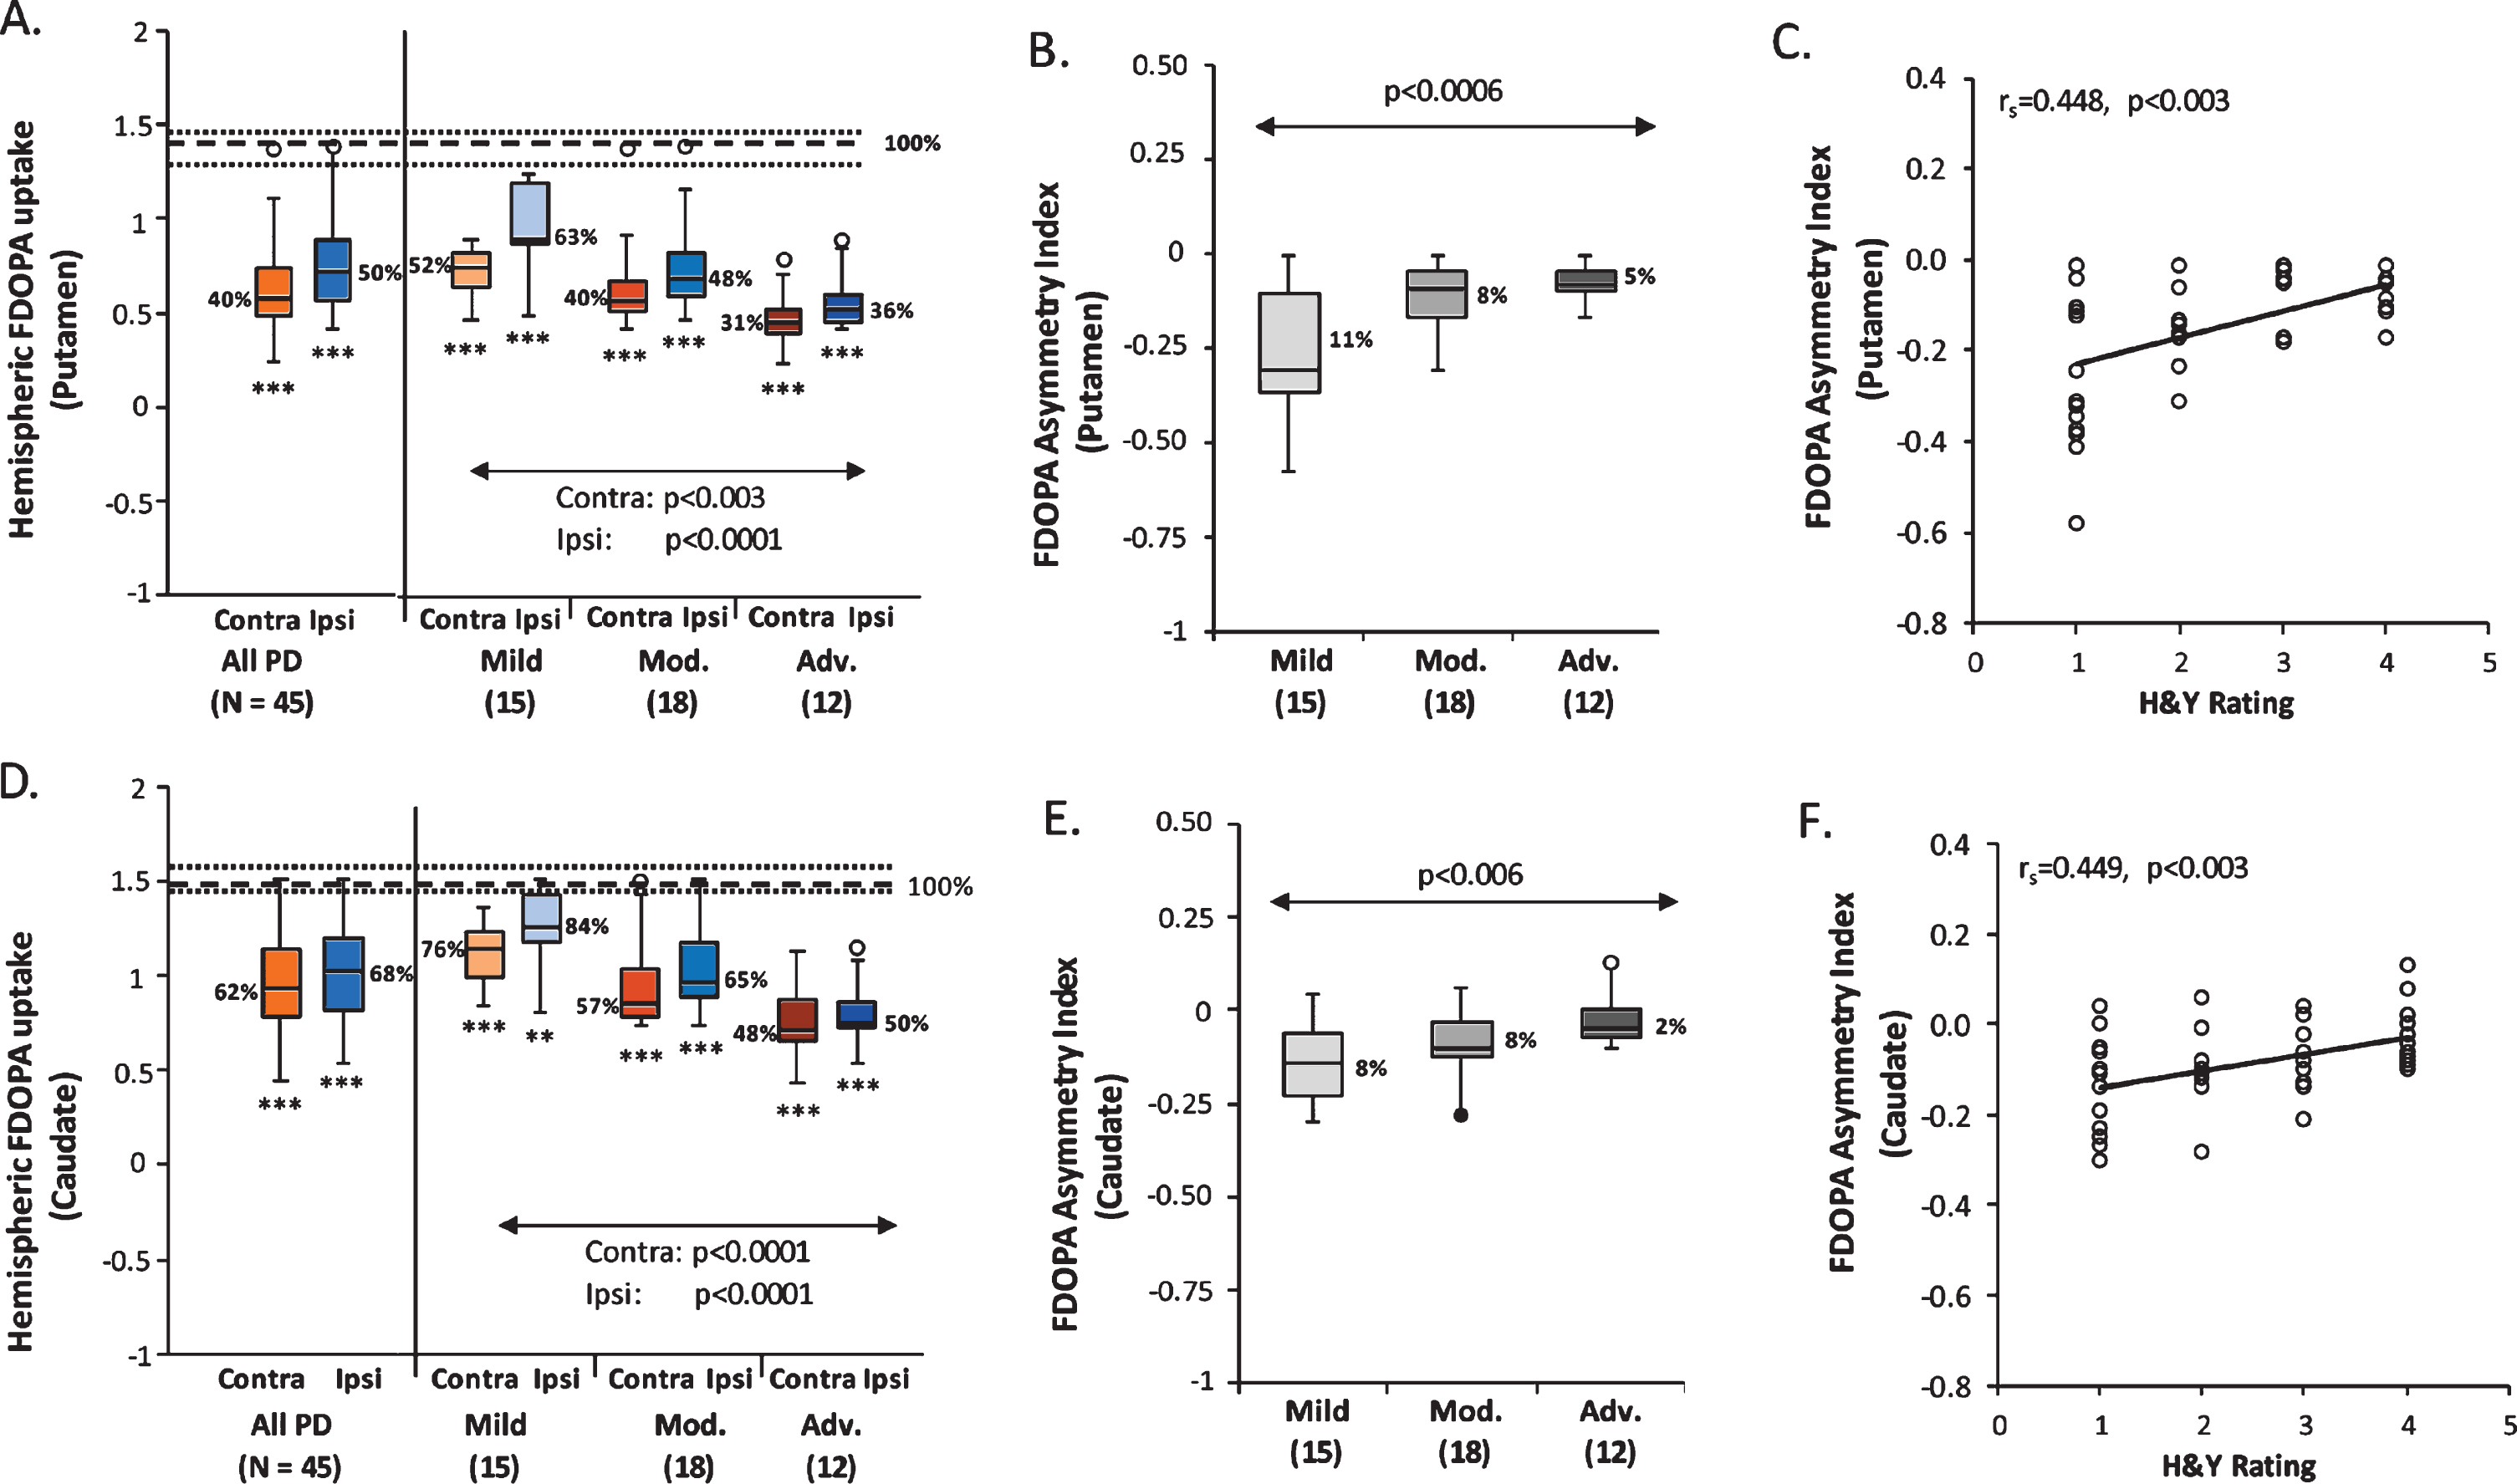
Hemispheric Putamen and Caudate FDOPA Uptake. Putamen (A) and caudate (D) FDOPA uptake was lower in both hemispheres relative to healthy controls in the whole PD group (PDRP and PDCP: p < 0.0001) and each PD subgroup (PDRP: p < 0.0001; PDCP: p < 0.002). Putamen FDOPA uptake (A) had significantly lower values in the contralateral hemisphere than for the ipsilateral side in the whole PD group (p < 0.0001) and each PD subgroup (p < 0.0005). Contralateral caudate FDOPA uptake (D) was significantly lower than the ipsilateral uptake in the whole PD group (p < 0.0001), and also in the Mild (p < 0.0003) and Moderate (p < 0.0006) subgroups, but not in the Advanced subgroup (p = 0.27). The hemispheric putamen and caudate FDOPA uptake was decreased in both hemispheres across the PD subgroups (PDRP: p < 0.003; PDCP: p < 0.0001), at a significantly faster rate (PDRP: p = 0.0005; PDCP: p < 0.006) in the ipsilateral hemisphere relative to the contralateral side. The asymmetry index values of both putamen (B) and caudate (E) FDOPA uptake diminished significantly across the PD subgroups (PDRP: p < 0.0006; PDCP: p < 0.006), and correlated significantly with H&Y ratings in the PD subjects (C, PDRP: p < 0.003; F, PDCP: p < 0.003). [In A and D, dotted lines represent 25% and 75% quartiles above and below the normal median (broken line) for each measure. Median hemispheric FDOPA uptake (A, D) and asymmetry index (B, E) in the putamen and caudate are shown as percent of the normal median (100%) in the PD group or subgroup. *p < 0.05, **p < 0.01, ***p < 0.001, Mann-Whitney U tests compared to healthy controls.]
For both networks, the contralateral and ipsilateral scores significantly correlated with each other (PDRP: rs = 0.76, p < 0.0001; PDCP: rs = 0.93, p < 0.0001) in the 45 PD patients. The contralateral and ipsilateral FDOPA uptake values also significantly correlated in the putamen (rs = 0.91, p < 0.0001) and caudate (rs = 0.92, p < 0.0001). Hemispheric PDRP and PDCP scores did not correlate with putamen or caudate FDOPA uptake in the ipsilateral (p > 0.06) or contralateral hemisphere (p > 0.19); these relationships remained non-significant (F (5,39) < 1.94, p > 0.11) even after adding PD Subgroup into the regression models. Moreover, the PDRP and PDCP asymmetry indices did not correlate with putamen (p > 0.09) and caudate (p > 0.84) FDOPA asymmetry measures in the PD sample. These relationships remained non-significant (F (5,39) < 2.05, p > 0.09) after adding PD Subgroups into corresponding regression models.
Asymmetry values for the PDRP (rs = – 0.014, p = 0.929; Fig. 2C) and PDCP (rs = – 0.003, p = 0.986; Fig. 2F) did not correlate with the H&Y ratings in the PD sample, consistent with the non-significant changes of these measures across the PD Subgroups (p > 0.82; one-way ANOVAs; Fig. 2B, E). By contrast, asymmetry values for the putamen (rs = 0.448, p < 0.003; Fig. 3C) and caudate (rs = 0.449, p < 0.003; Fig. 3F) correlated with the H&Y ratings, consistent with the differences seen for these measures across the PD Subgroups (p < 0.006; one-way ANOVAs; Fig. 3B, E). Of note, marginal (p = 0.07) or weakly significant (p < 0.05) correlations were found between whole-brain, contralateral, or ipsilateral PDRP/PDCP expression values and H&Y ratings in the PD sample, whereas highly significant correlations (p < 0.0001) were present between the average, contralateral, or ipsilateral putamen/caudate FDOPA uptake and H&Y ratings (Supplementary Table 1). These correlation results are also generally consistent with the increased PDRP/PDCP expression and the decreased putamen/caudate FDOPA uptake seen by comparisons of these measures across the PD subgroups.
DISCUSSION
In this study, we demonstrated that the expression of PD-related motor and cognitive metabolic networks was abnormally elevated in both brain hemispheres of early PD patients with hemiparkinsonism compared to healthy controls, particularly in the presymptomatic hemisphere ipsilateral to the body side showing initial symptoms. We further showed that the hemispheric expression of both networks remained symmetrical throughout the disease course: both hemispheres exhibited similar increases in expression in patients at mild, moderate, and more advanced clinical stages. By contrast, hemispheric striatal FDOPA uptake in the same patients was lower than normal in early PD, with further reductions at more advanced disease stages. Moreover, across PD groups of varying Hoehn and Yahr stage, the magnitude of hemispheric reduction in striatal FDOPA uptake was greater on the ipsilateral side. Thus, while metabolic network activity was symmetrical in all disease stages, striatal dopaminergic asymmetries became incrementally smaller with more severe motor disability. Our study provides new evidence that functional abnormality of PD is widespread symmetrically in the brain throughout the disease course and not restricted by local dopamine deficiency in the basal ganglia.
The presence of elevated network activity in the presymptomatic ipsilateral hemisphere of H&Y 1 PD patients supports our earlier hypothesis that metabolic network abnormality in hemi-PD patients may precede clinical onset on the opposite body side by approximately two years [5]. Furthermore, we have gained new insight into the moderate and more advanced patients whose ipsilateral expression of PDRP and PDCP increased incrementally with more severe clinical dysfunction. Likewise, network expression levels for both networks were increased to a similar degree in the contralateral hemispheres of the patients in each severity subgroup. While hemispheric network expression increased symmetrically with advancing symptoms, striatal FDOPA uptake exhibited asymmetrical reductions in the same individuals. Although caudate/putamen FDOPA uptake was consistently lower contralaterally, the magnitude of the reductions across the PD groups was greater ipsilaterally. For the ipsilateral putamen, FDOPA uptake averaged 63% of the normal value in the mild group and 36% in the advanced group, whereas uptake was 52% and 31% of normal, respectively, for the contralateral putamen. Although reductions in FDOPA uptake were overall smaller in the caudate, differences between mild and advanced disease were likewise more pronounced on the ipsilateral side. Despite the relatively higher (i.e., more intact) FDOPA uptake seen ipsilaterally in early disease, hemispheric differences become smaller at more advanced stages. Thus, for the putamen, the hemispheric FDOPA uptake asymmetry was 11% in mild patients and 5% in their advanced counterparts, and 8% and 2%, respectively, for the caudate (see Figs. 3B and 3E). Our data lend further support to the findings of an earlier longitudinal PET study that, despite different dopamine levels in anterior versus posterior striatal subregions at disease onset, the side-to-side asymmetry between these subregions became less prominent over the course of PD [22]. Interestingly, a prior longitudinal SPECT study demonstrated that dopamine asymmetry in the putamen had a greater decline over time in the PD patients with predominant dopamine deficiency in the right hemisphere than the more left-affected patients [23]. Together, these data suggest that asymmetrical loss of striatal dopamine is not at a constant rate for all PD patients, but can vary depending on different clinical factors, such as disease stages and the more deficient hemispheres.
It was hypothesized that the onset of motor symptoms in the limb is likely associated with a loss of nigrostriatal dopamine beyond a critical threshold of 50– 60% of the normal level in the posterior striatum [5, 25]. Along these lines, the current data show that dopamine levels in the contralateral putamen were lower than 52% at all clinical stages, with convergence to a “floor” value of approximately 30% of normal with advanced disease. In the ipsilateral putamen, by contrast, presynaptic nigrostriatal function was initially above threshold (63% of normal in H&Y 1 patients) in hemi-PD patients, perhaps reflecting a degree of dopadecarboxylase (DDC) upregulation on the presymptomatic side. Upregulation involves both hemispheres, and therefore is not expected to have a major influence on the striatal dopaminergic asymmetries seen in this study. Given that ipsilateral putamen FDOPA uptake decreased to subthreshold values in the moderate (40%) and advanced (31%) subgroups, it is likely that these differences represent disease progression effects in the nigrostriatal dopamine pathway, as suggested by longitudinal studies using FDOPA PET [26, 27].
Recently, an interesting alternative hypothesis has been proposed that relatively higher ipsilateral uptake could also reflect a compensatory dopamine mechanism on this side. Fox and colleagues showed that dopamine release can synchronize the two hemispheres via cross-hemispheric dopamine projections, a possible dopamine compensatory mechanism in PD [28]. FDOPA PET data from a hemiparkinsonian monkey model suggest that the onset of motor symptoms can be influenced by dopaminergic dysfunction in the less-affected striatum [29]. Subsequently, as motor symptoms develop on the opposite side, the greater reduction in FDOPA uptake seen in the ipsilateral putamen may reflect a failure of this mechanism over time. Our data support the recent hypothesis by Blesa and colleagues [30] that long-term compensation could have a detrimental effect on the remaining dopamine neurons, as they are prone to be overstressed and become more vulnerable to deteriorating disease [31].
Contrary to the local, asymmetrical dopamine depletion in the striatum, the PDRP/PDCP network abnormality represents the broader, symmetrical functional changes in the underlying pathophysiological pathways of PD. From a technical perspective, metabolic pattern scores are a composite sum of contributions from all network areas and any asymmetry in the components, such as the putamen and caudate, may be obscured in the overall multivariate measure. Indeed, the current data did not show significant correlations between hemispheric network expression and corresponding striatal uptake values, as compared to the modest correlations (R2 = 0.20– 0.30) seen previously for the whole brain in a larger population [7] and a small longitudinal sample [32]. Similar modest whole-brain correlations were found between network expression and dopaminergic imaging in patients with iRBD [16]. These results, along with the absence of a correlation between the respective asymmetry index values, offer further support for the complementarity of these different imaging biomarkers in PD [6].
The hemispheric network data in the current sample are consistent with observations from an earlier hemi-PD cohort in which symmetrical increases in PDRP expression were noted both ipsilateral and contralateral to the affected body side [5]. The prior longitudinal study and the current cross-sectional analysis suggest that the increases in network expression that occur with disease progression are inherently symmetrical without any indication of a ceiling effect [1]. Of note, the absence of discernable metabolic asymmetry at the network level in PD is likely to apply as well to disease-related subnetworks (nodules). Using graph theory, we have recently found that the PDRP and PDCP can each be partitioned into discrete core and periphery zones based on the relative valence of the component network nodes [32, 33]. Separate analysis of hemispheric activity in each subnetwork revealed no evidence of asymmetry for the core and periphery (or active and underactive subnetworks) of PDRP or PDCP (Supplementary Table 2). Moreover, subnetwork asymmetries for either pattern failed to correlate with corresponding caudate/putamen FDOPA asymmetries in the PD sample (Supplementary Table 3). In aggregate, the absence of asymmetry at the network and subnetwork levels points to the bilaterality of a functional pathology of PD at all disease stages. The asymmetrical dopaminergic changes, on the other hand, reflect lateralized differences in nigrostriatal function and limb involvement, which are most pronounced during the early clinical phases of the illness.
We acknowledge several limitations of the current study. Firstly, motor ratings and neuropsychological data were not available in this group of patients, and as a result, we were unable to explore the relationships of the hemispheric network and dopaminergic measurements to clinical disability. It was also a limitation to have separate healthy control groups for the FDG PET and FDOPA studies. We additionally note for the FDG PET studies that the healthy control subjects were younger than the PD patients. We, therefore, used an age correction as done in a previous whole-brain analysis conducted in this population [7]. This was accomplished by determining the linear relationships of the whole-brain and hemispheric network expression with age in the FDG PET data from a large, independent group of healthy control subjects. Nonetheless, we found that the results of significant differences between the PD and HC groups were not influenced by the age correction performed in this study. Finally, we note that the current analysis was cross-sectional, and a longitudinal approach analogous to our prior study may have provided additional data regarding disease progression. Even with these limitations, this study provides valuable information concerning the respective roles of these biomarkers in tracking the underlying disease process.
CONFLICT OF INTEREST
The authors have no conflict of interest to report.
Financial Disclosures
Dr. Eidelberg serves on the scientific advisory board and has received honoraria from The Michael J. Fox Foundation for Parkinson’s Research; serves on the scientific advisory board and receives personal fees from Ovid Therapeutics; has received consultant fees from MeiraGTx; is listed as co-inventor of patents re: Markers for use in screening patients for nervous system dysfunction and a method and apparatus for using same, without financial gain; and has received research support from the NIH (NINDS, NIDCD, NIAID) and the Dana Foundation.
Dr. Eggers received grant support paid to the institution from the German Research Foundation (DFG), the European Union (Horizon2020), the German Ministry of Science and Education (BMBF), the German Parkinson Association (DPV) and the Parkinson’s Foundation; personal compensation as a consultant/scientific advisory board member for AbbVie, Medtronic, Philyra; and honoraria for lectures/speaks from Abbvie, Bayer Vital, Bial, Daiichi Sankyo, UCB, Zambon.
Dr. Fink serves as an editorial board member of Cortex, Neurological Research and Practice, NeuroImage: Clinical, Zeitschrift für Neuropsychologie, and DGNeurologie; receives royalties from the publication of the books Funktionelle MRT in Psychiatrie und Neurologie, Neurologische Differentialdiagnose, and SOP Neurologie; received honoraria for speaking engagements from Bayer, Desitin, Ergo DKV, Forum für medizinische Fortbildung FomF GmbH, GSK, Medica Academy Messe Düsseldorf, Medicbrain Healthcare, Novartis, Pfizer, and Sportärztebund NRW.
Dr. Lars Timmermann received payments as a consultant for Boston Scientific and honoraria as a speaker on symposia sponsored by UCB, Desitin, Boston Scientific, and Abott in the past year until February 2020. The institution of L.T., not L.T. personally, received funding by the German Research Foundation, the German Ministry of Education and Research, and the Deutsche Parkinson Vereinigung. Neither L.T. nor any member of his family holds stocks, stock options, patents or financial interests in any of the above mentioned companies or their competitors.
Dr. Holtbernd has received research funding from the German Research foundation and the RWTH Aachen University (START). He has received travel fees from Boston Scientific and Abott.
Dr. Tang, Dr. Ma, Dr. Spetsieris, and Ms. Oh report no conflict of interests.
Footnotes
ACKNOWLEDGMENTS
This study was supported by the German Research Foundation (Ho 5034/1-1 to F.H. and via the Clinical Research Group 219 “Basal-Ganglia-Cortex-Loops: Mechanisms of pathological interactions and their therapeutic modulation” to L.T., G.R.F., and C.E.). This work was also supported by the U.S. National Institute of Neurological Disorders and Stroke (P50 NS 071675 [Morris K. Udall Centre of Excellence for Parkinson’s Disease Research at The Feinstein Institutes for Medical Research] to D.E.). The content is solely the responsibility of the authors and does not necessarily represent the official views of the National Institutes of Health or the National Institute of Neurological Disorders and Stroke. The authors thank Yoon Young Choi for her valuable editorial assistance preparing the manuscript.