
Abstract
Cognitive deficits in Parkinson's disease (PD) have been associated with a specific metabolic covariance pattern. Although the expression of this PD cognition-related pattern (PDCP) correlates with neuropsychological performance, it is not known whether the PDCP topography is reproducible across PD populations. We therefore sought to identify a PDCP topography in a new sample comprised of 19 Dutch PD subjects. Network analysis of metabolic scans from these individuals revealed a significant PDCP that resembled the original network topography. Expression values for the new PDCP correlated (P = 0.001) with executive dysfunction on the Frontal Assessment Battery (FAB). Subject scores for the new PDCP correlated (P < 0.001) with corresponding values for the original pattern, which also correlated (P < 0.005) with FAB scores in this patient group. For further validation, subject scores for the new PDCP were computed in an independent group of 86 American PD patients. In this cohort, subject scores for the new and original PDCP topographies were closely correlated (P < 0.001); significant correlations between pattern expression and cognitive performance (P < 0.05) were observed for both PDCP topographies. These findings suggest that the PDCP is a replicable imaging marker of PD cognitive dysfunction.
INTRODUCTION
Parkinson's disease (PD) is primarily a disorder of movement caused by dopaminergic attrition in the substantia nigra. Nonetheless, over the past decade, this disease has been associated with non-motor manifestations, represented most prominently by cognitive decline. 1 Indeed, with improved treatment of motor symptoms, cognitive difficulties are increasingly regarded as a major factor determining functional outcome and quality of life in PD patients.2–4 The earliest cognitive deficit observed in PD is the development of executive dysfunction before the onset of actual dementia. In fact, such changes have been documented in newly diagnosed patients with early motor symptoms. 5 Cognitive dysfunction in PD begins with mild cognitive impairment (MCI) affecting a single behavioral domain, followed by involvement of multiple domains, such as visuospatial and memory performance. These changes ultimately lead to dementia, which is 4–6 times more likely to occur in PD patients compared with the healthy aged population.6,7 The precise mechanisms underlying the development and progression of cognitive dysfunction in PD are largely unknown. Performance on standardized neuropsychological testing batteries is considered to be the ‘gold standard’ for the assessment of cognitive dysfunction in PD patients. Nonetheless, the assessment of changes in cognitive function over time remains challenging in PD, especially at the individual subject level. Additional quantitative descriptors of cognitive dysfunction in PD patients may be particularly relevant in clinical trials to evaluate new therapies for this debilitating symptom of the disease. Metabolic imaging with 18 F-fluorodeoxyglucose (FDG) positron emission tomography (PET) has been used to study the systems-level changes in brain function that underlie PD and related movement disorders.8–11 Spatial covariance mapping approaches8,12,13 have been applied to resting-state metabolic brain images to identify and validate characteristic disease-related regional patterns associated with PD. 14 The metabolic topography of the abnormal PD motor-related pattern, associated primarily with akinetic-rigid disease manifestations, 15 has been extensively replicated in FDG PET scans from multiple populations of patients and control subjects.9,16
Using a similar method, we have also identified a separate pattern associated with cognitive symptoms in non-demented PD patients. This PD cognition-related pattern (PDCP) 17 has been found to correlate with performance on neuropsychological tests of executive function in several independent patient samples.8,17–19 Importantly, PDCP subject scores, which denote the expression of the pattern in individual patients, exhibited excellent reproducibility on test–retest evaluation. 17 This justifies further exploration of the measure as a potential descriptor of the effects of disease progression and treatment on cognition-related metabolic pathways.18–20 That said, presently data do not exist concerning the replicability of the PDCP topography itself across derivation samples. In the current study, we identified a PDCP in FDG PET data from an independent PD derivation sample scanned in the Netherlands. The topography of this spatial covariance pattern was compared with that of the original PDCP, which was previously derived from FDG PET data of a PD cohort scanned in the United States. 17 We also compared correlations between expression values for the two PDCP topographies and cognitive performance in the present Dutch sample and in a large previously reported American testing set. 21
MATERIALS AND METHODS
SUBJECTS
We studied 19 early-stage PD patients (age 63.7 ± 7.7 years; disease duration 4.4 ± 3.2 years; motor Unified Parkinson's Disease Rating Scale 18.4 ± 7.4) and 17 age-matched healthy volunteer subjects (age 61.1 ± 7.4 years) (Table 1A), who underwent metabolic brain imaging in the resting state with FDG PET at the University Medical Center Groningen, the Netherlands. The details of the scanning procedures are provided elsewhere. 16 Executive function was assessed in the PD and healthy volunteer subjects using the Frontal Assessment Battery (FAB) 22 administered the same day as the PET study. All subjects were non-demented, as defined by a cutoff Mini Mental State Examination (MMSE) score of 24 (MMSE for PD subjects 28.5 ± 1.1, range 26–30; MMSE for control subjects 29.4 ± 0.9, range 27–30). Network analysis was applied using the imaging and cognitive test data from this cohort (see below) to identify a new PDCP topography (termed PDCP Groningen or PDCPGR).
Demographic data of the Groningen and North Shore PD cohorts
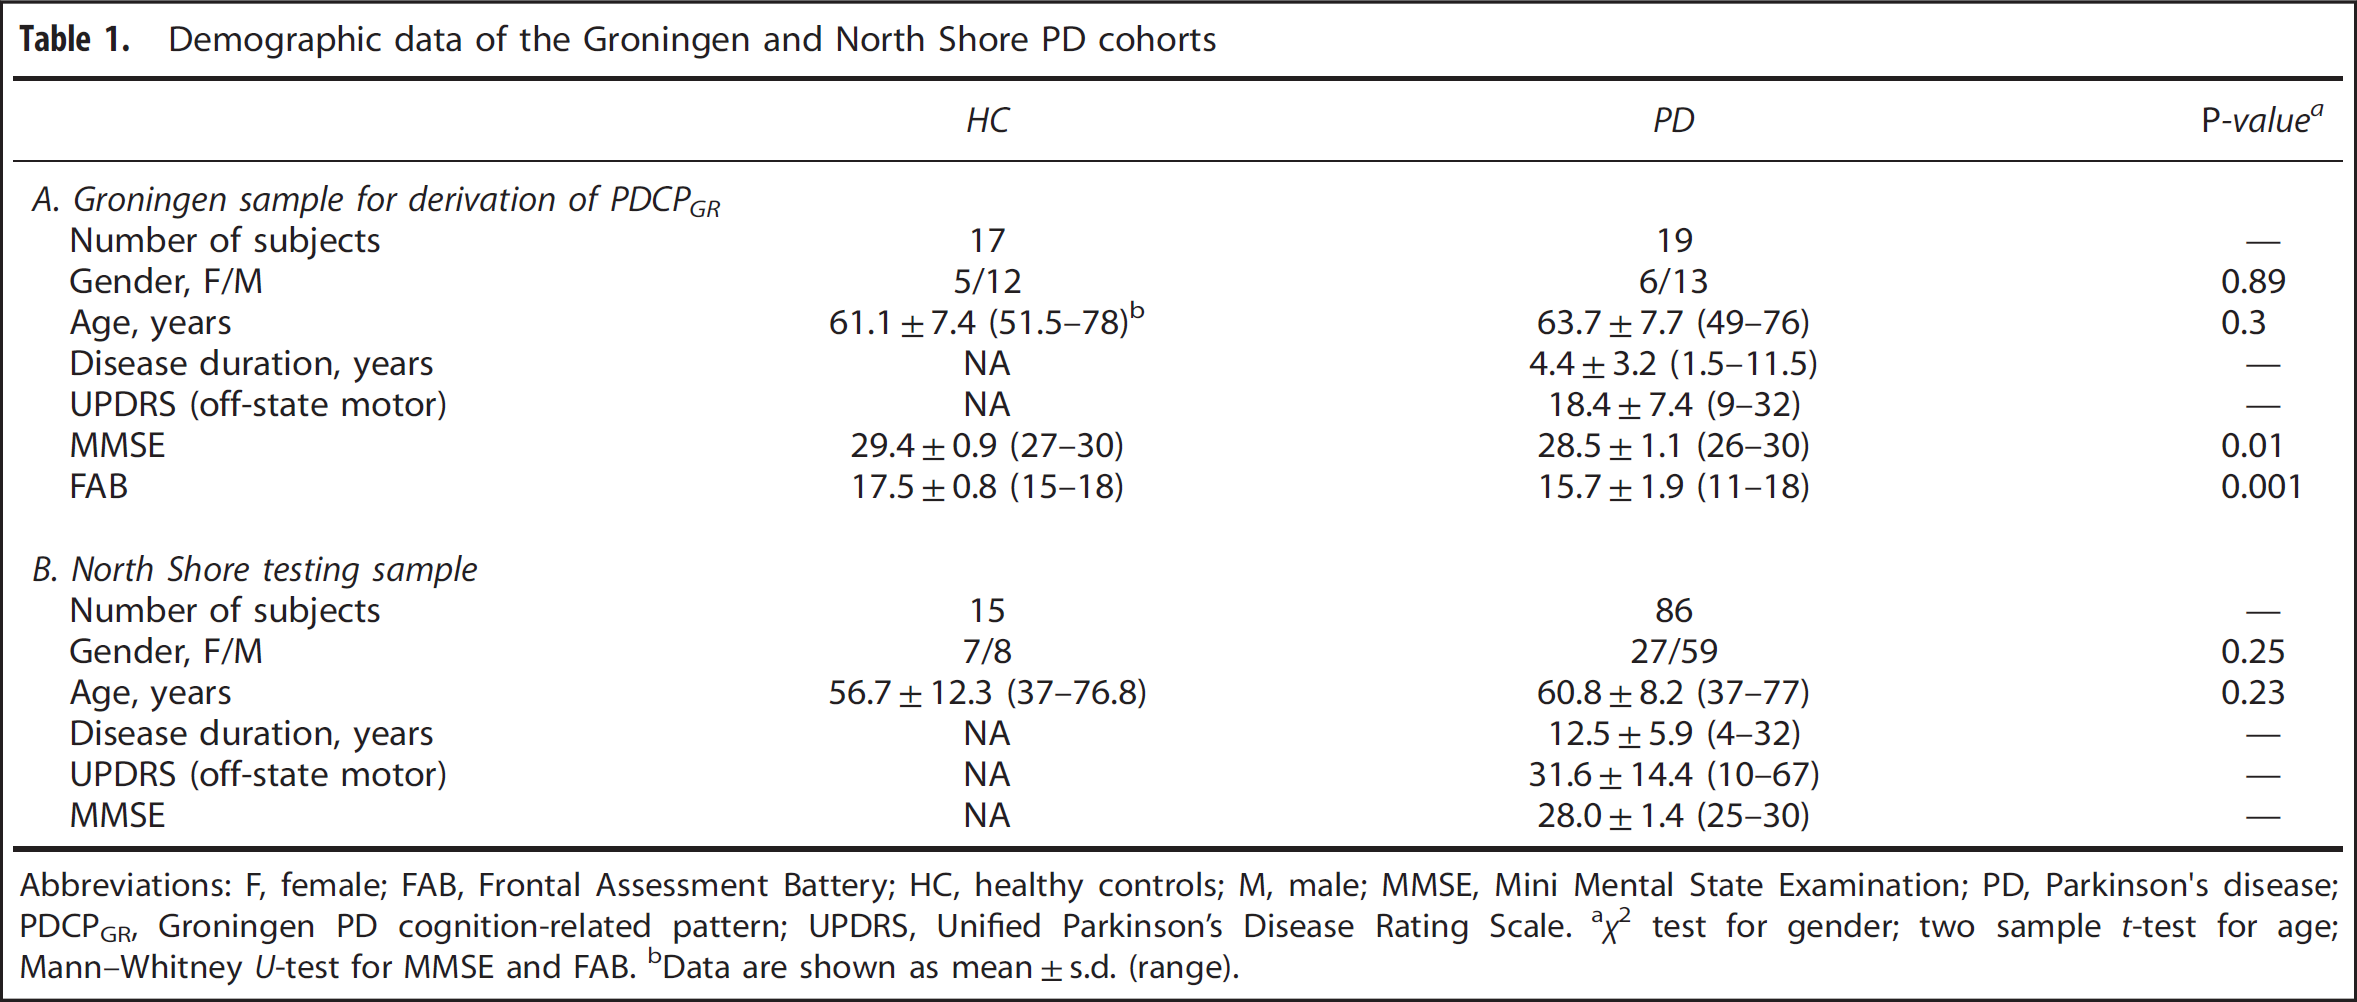
Abbreviations: F, female; FAB, Frontal Assessment Battery; HC, healthy controls; M, male; MMSE, Mini Mental State Examination; PD, Parkinson's disease; PDCPGR, Groningen PD cognition-related pattern; UPDRS, Unified Parkinson's Disease Rating Scale.
χ2 test for gender; two sample t-test for age; Mann–Whitney U-test for MMSE and FAB.
Data are shown as mean±s.d. (range).
For testing, we measured the expression of the new PDCPGR pattern in an independent group of 86 non-demented PD subjects (age 60.8 ± 8.2 years; disease duration 12.5 ± 5.9 years; motor Unified Parkinson's Disease Rating Scale 31.6 ± 14.4; MMSE 28.0 ± 1.4, range 25–30; Table 1B) who were scanned at North Shore University Hospital, Manhasset, NY, USA as described previously. 21 Subjects in this cohort were assessed according to a comprehensive neuropsychological testing battery23–28 as being cognitively unimpaired (MCI(-), n = 20) or as having either single- (MCI(s), n = 34) or multiple-domain (MCI(m), n = 32) MCI; 15 age-matched healthy volunteer subjects (age 56.7 ± 12.3 years) provided reference values for this cohort.
Image Acquisition and Preprocessing
All subjects were scanned with FDG PET under resting conditions. All antiparkinsonian medications were withheld at least 12 h before imaging. In the Groningen sample, PET imaging was performed using the Siemens Biograph mCT-64 scanner (Siemens Healthcare, Knoxville, TN, USA) (5 mm full width half maximum) at the University Medical Center Groningen. 16 In the North Shore sample, scanning was performed using the GE Advance tomograph (GE Healthcare, Milwaukee, WI, USA) (4.0 mm full width half maximum) at the North Shore University Hospital. 17 Scans from each subject were realigned and spatially normalized to a standard Talairach-based FDG PET template and smoothed with an isotropic Gaussian kernel (10 mm). All image processing was performed using Statistical Parametric Mapping (SPM5) software (Wellcome Department of Cognitive Neurology, London, UK) running in MATLAB 7.5 (MathWorks, Natick, MA, USA).
Ethical permission for the procedures was obtained from the ethics committee at the University Medical Center Groningen (Groningen, the Netherlands) and from the Institutional Review Board of the North Shore University Hospital (Manhasset, NY, USA). Written consent was obtained at each institution from all subjects following a detailed explanation of the testing procedures.
Network Analysis
Spatial covariance analysis was performed on scans from the Groningen PD subjects using an automated voxel-based algorithm (available at http://feinsteinneuroscience.org). The details of this approach are provided elsewhere.8,12,13 Before performing principal component (PC) analysis on the images, logarithmically transformed scan data from the subjects were orthogonalized to the PD motor-related topography that was previously identified in this population. 16 This procedure was used to minimize extraneous motor-related network effects in the PDCP derivation. 29 Spatial covariance analysis was applied to the residual data in the orthogonal ‘non-motor’ subspace to identify specific topographic patterns that, if present, correlated with quantitative indices of cognitive performance in these subjects. The details of the procedures used to identify PDCP topographies have appeared previously. 17 In the current study, the PDCP topography was sought among the PCs that accounted for the top 50% of the variance in the data. Subject scores for these PCs (denoting the expression of each linearly independent pattern in the individual subjects) were entered into a linear regression model to predict executive functioning as measured by FAB scores. A resulting pattern was considered cognition-related if the associated subject scores correlated significantly with FAB at P < 0.01. Voxel weights (loadings) on the pattern were thresholded at Z = 1.96, which corresponded to a significant regional contribution (P < 0.05) to overall network activity, and further tested for reliability using a bootstrap resampling procedure. 30 The significant clusters were reported in standard space; corresponding brain regions were localized according to the atlas of Talairach 31 and, for the cerebellum, the atlas of Schmahmann. 32
In addition to subject scores for the new PDCPGR pattern, we also measured the expression values for the PDCPNS topography that was identified in the original North Shore PD cohort. Both sets of PDCP subject scores were standardized by z-transformation with respect to corresponding values from normal subjects scanned at Groningen so that this control group had a mean expression of zero with an s.d. of one. 12 Subject scores for the two patterns were tested for intercorrelation in members of the Groningen PD derivation sample. Additionally, correlations with FAB scores were separately assessed for each set of PDCP subject scores obtained in this group. Correlations were considered significant for P < 0.05, Pearson product-moment correlation coefficient.
PDCP Expression Across PD Subgroups and Neuropsychological Correlations
PDCPGR subject scores were also computed on a prospective single case basis in members of the North Shore testing sample. PD patients in this cohort were divided into prespecified MCI(-), MCI(s) and MCI(m) categories based upon individual neuropsychological test performance (see above). Differences in pattern expression across these subgroups were assessed using one-way analysis of variance and post-hoc Tukey–Kramer Honest Significant Difference (HSD) tests.
In addition, we computed the original PDCPNS subject scores in the testing data and correlated the expression values of the two PDCP networks in this group. We also examined relationships between PDCPGR and PDCPNS subject scores and performance on the Symbol Digit Modalities Test (SDMT), Hooper Visual Organization Test (HVOT), California Verbal Learning Test and Trail Making Test A (TMT A) and B (TMT B) tests, consistently correlating with network expression in previous studies.17,19,21 Network–performance correlations were reported as Pearson product-moment coefficients with uncorrected P-values.
Statistical analyses were performed in SPSS 14.0 (SPSS Inc., Chicago, IL, USA) and were considered significant for P < 0.05.
RESULTS
Characterization of the PDCPGR Topography
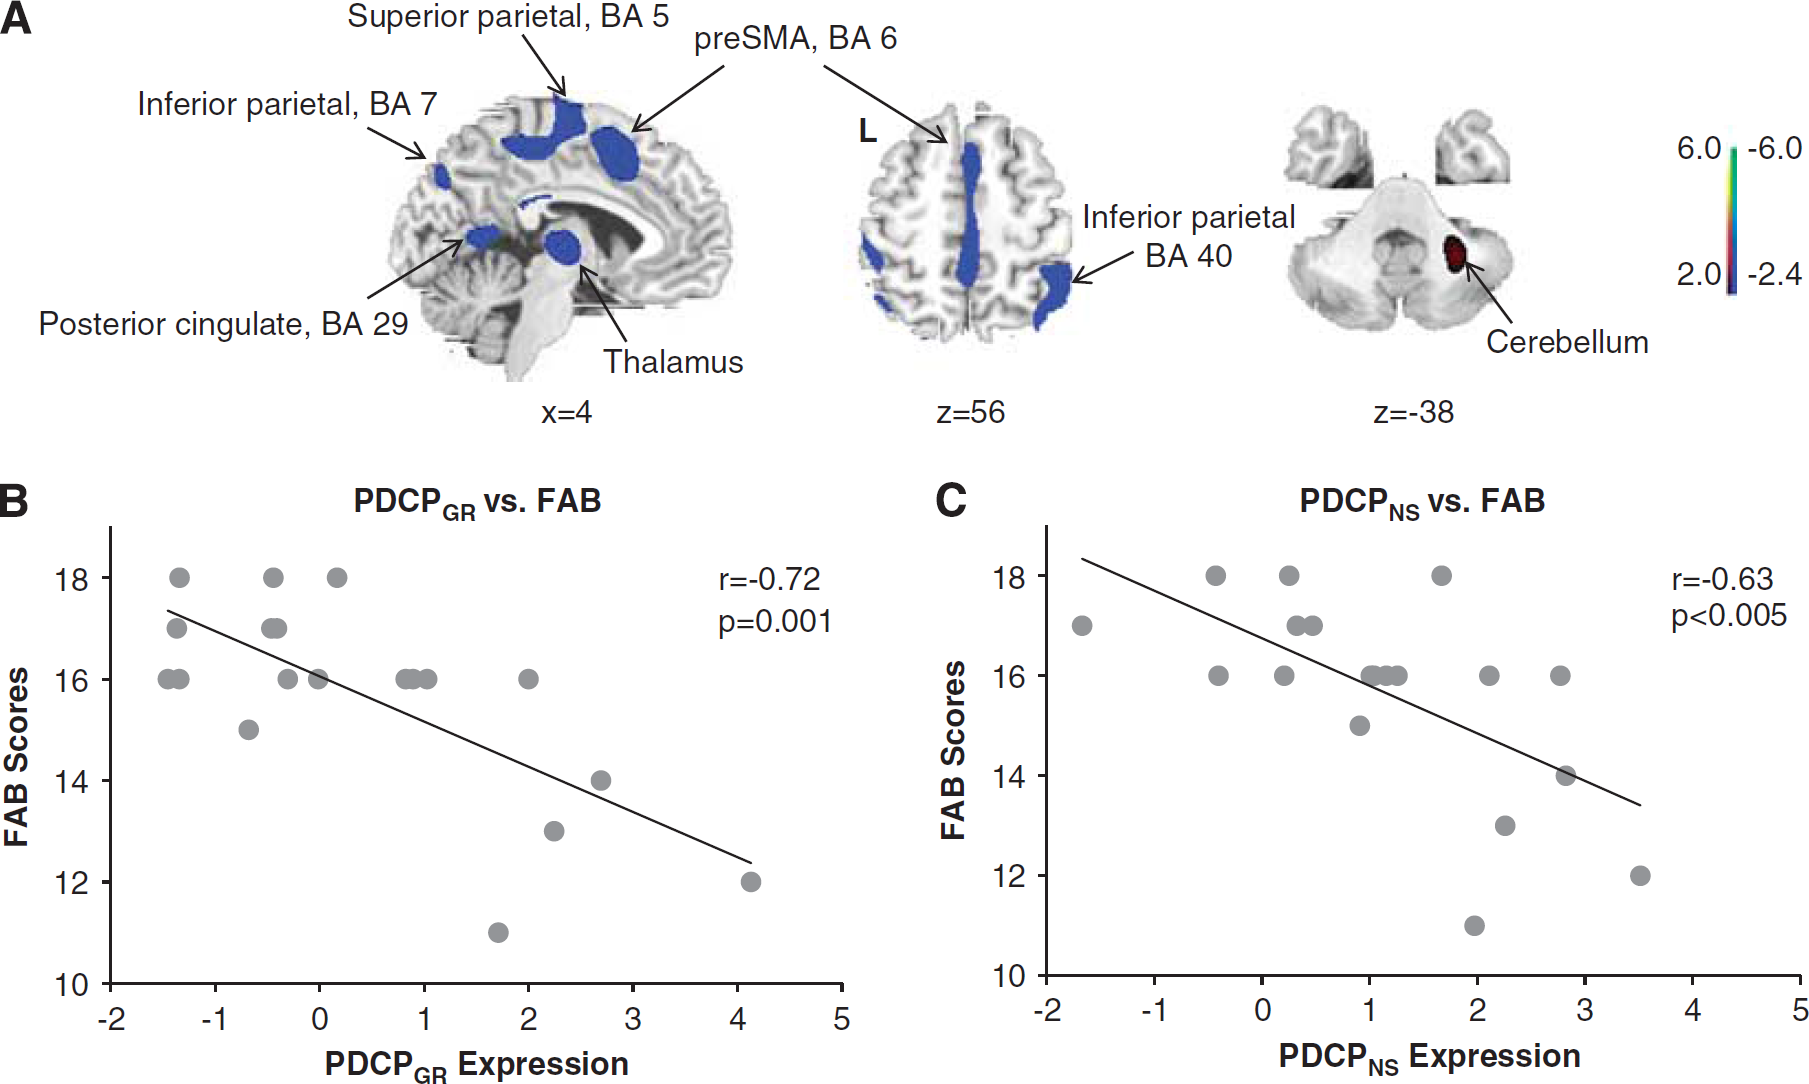
Spatial covariance analysis was performed on the scan data from the 19 PD subjects that comprised the Groningen derivation sample. This analysis yielded five linearly independent (orthogonal) PCs, which together accounted for 55% of the total subject × voxel variance. The first PC (Figure 1A), which accounted for 19.6% of the total variance, was the only one of the top five PCs that exhibited a significant correlation (r = −0.72, P = 0.001) between its expression (subject scores) in the individual members of the derivation sample and corresponding cognitive ratings (FAB scores) obtained in the same subjects at the time of imaging (Figure 1B). Indeed, FAB scores in the PD patients were lower (P = 0.001, Mann–Whitney U-test) than for the 17 healthy subjects in the same population; the correlation between the expression values for this PC and FAB scores was not significant (P = 0.75) in these normal subjects.
(
Based upon these findings, the metabolic topography identified in the Groningen derivation sample, that is, the first PC, was considered to be a cognition-related spatial covariance pattern and was accordingly termed PDCPGR. The PDCPGR topography (Table 2) was characterized by reduced metabolic activity in the caudate nucleus, mediodorsal thalamus and the presupplementary motor area (preSMA, Brodmann area (BA) 6), posterior cingulate cortex (BA 23, 29) and parietal regions (BA 5, 7, 40), with relatively increased activity in the cerebellum (lobule VI/Crus I) and anterior cingulate cortex (BA 32). Voxel weights on the pattern were stable on bootstrap resampling (1000 iterations; |ICV| = 2.75, P < 0.01).
Brain regions with significant contributions to the Parkinson's disease-related cognitive pattern derived from the Groningen data (PDCPGR)
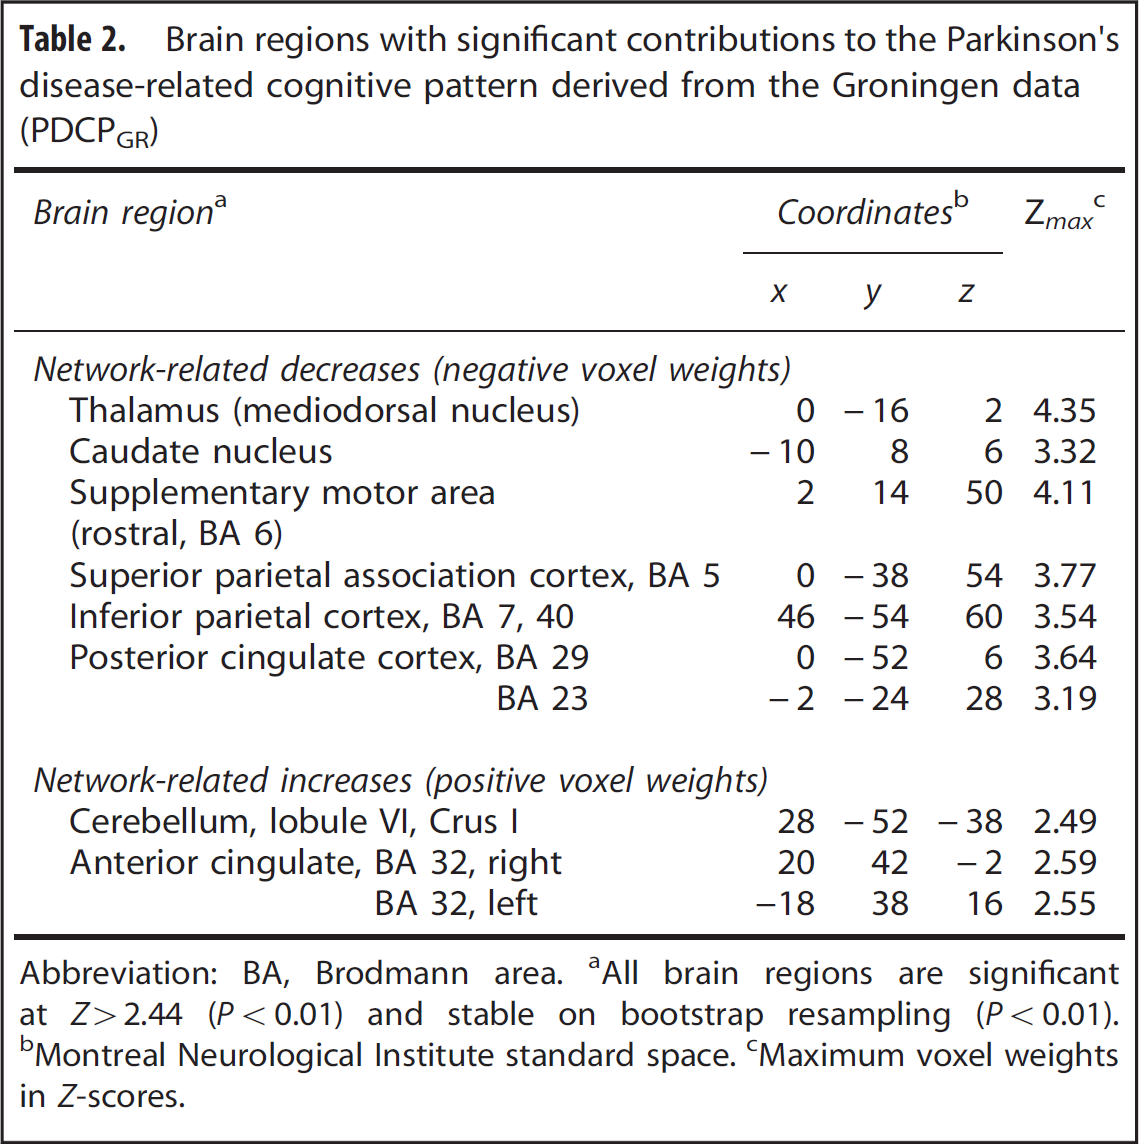
Abbreviation: BA, Brodmann area.
All brain regions are significant at Z>2.44 (P<0.01) and stable on bootstrap resampling (P<0.01).
Montreal Neurological Institute standard space.
Maximum voxel weights in Z-scores.
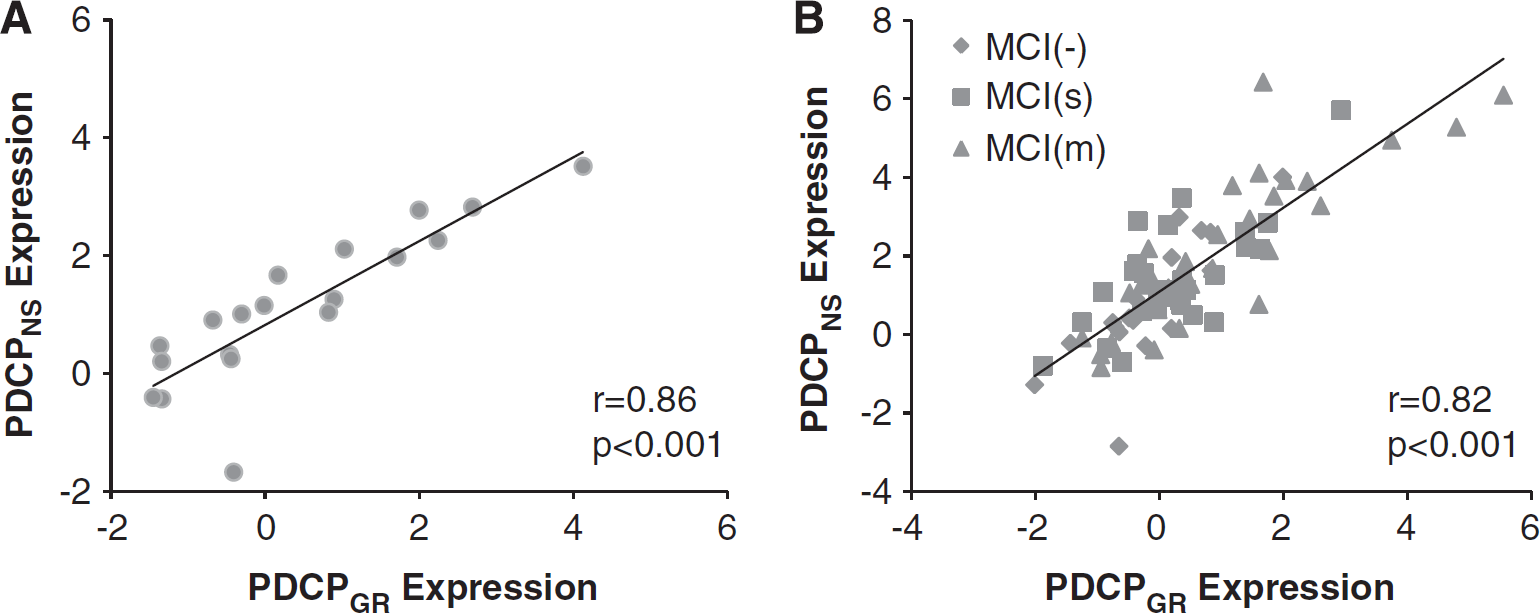
To compare the PDCPGR topography with that of the original North Shore PDCP (termed PDCPNS), we correlated region weights (loadings) on the two patterns using a voxel-based algorithm. Indeed, a significant voxel-wise correlation (r = 0.52, P < 0.001) was present between the two PDCP topographies. Moreover, a close relationship (Figure 2A; r = 0.86, P < 0.001) existed between the expression values for the two patterns measured in the Groningen PD subjects. As with PDCPGR expression, PDCPNS values computed in the same PD subjects (Figure 1C) correlated with corresponding FAB scores (r = −0.63, P < 0.005), while an analogous correlation was not present (P = 0.55) in the healthy control subjects.
(
Increased PDCPGR Expression is Associated with Greater Cognitive Impairment
For further validation, we computed PDCPGR expression in members of a large independent North American PD testing cohort (n = 86) on a prospective single case basis. This cohort was comprised of 20 cognitively intact patients (MCI(-)), 34 patients with single-domain (MCI(s)) and 32 patients with multiple-domain (MCI(m)) cognitive impairment. A significant stepwise increase in PDCPGR expression was evident (Figure 3) with advancing cognitive dysfunction across the three MCI subgroups (F(2, 83)= 3.95, P < 0.05; one-way analysis of variance), with higher values in MCI (m) relative to MCI(-) subjects (P < 0.05; post-hoc Tukey's HSD test).
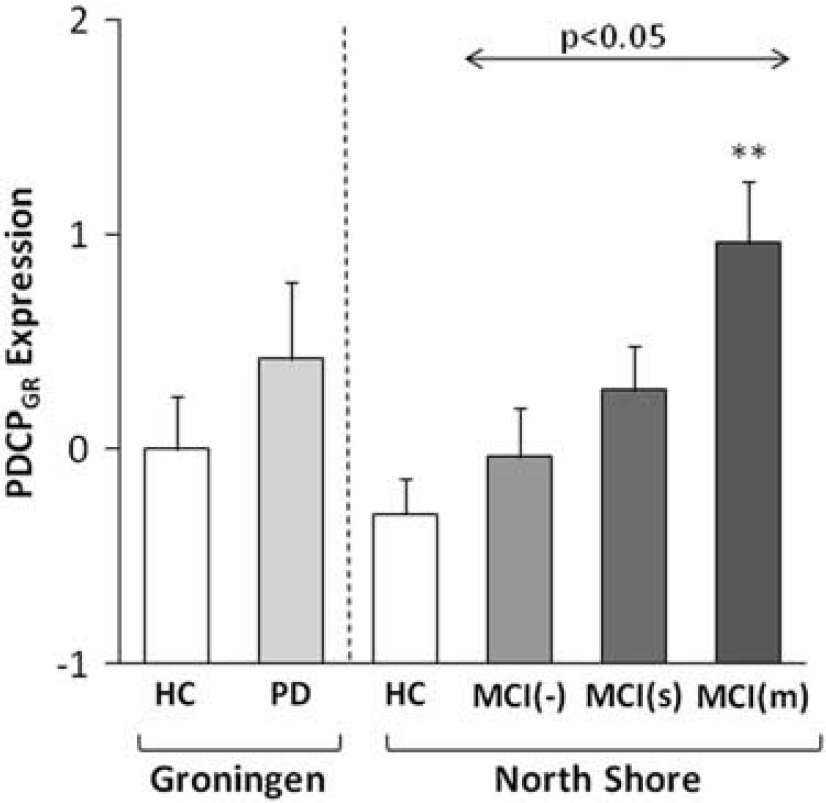
Mean Groningen Parkinson's disease (PD)-related cognitive pattern (PDCPGR) expression in the derivation cohort of Groningen PD and healthy controls (HC) groups (left), as well as in the prospective cohort of North Shore PD subgroups and the corresponding HC group (right). There was a significant increase in PDCPGR expression across the North Shore MCI(-), MCI(s) and MCI(m) PD groups (F(2, 83) = 3.95, P < 0.05; one-way analysis of variance), with higher values (P < 0.05; Tukey's HSD) in MCI(m) relative to MCI(-) subjects. **P < 0.01, Student's t-test relative to the North Shore HC group. MCI, mild cognitive impairment.
We also computed PDCPGR expression values in 15 age-matched healthy volunteer subjects scanned at the North Shore site. No significant difference was evident for PDCPGR values measured in healthy volunteer subjects at the two sites (North Shore: −0.29 ± 0.62; Groningen: 0.0 ± 1.0, P = 0.32; Student's t-test). In the North Shore subjects, PDCPGR expression in MCI(-) and MCI (s) PD subjects did not differ from healthy control values (P < 0.36; Student's t-tests). Network expression was, however, significantly elevated (P < 0.01) in the more cognitively impaired MCI(m) subjects.
Neuropsychological Correlates of PDCPGR Expression
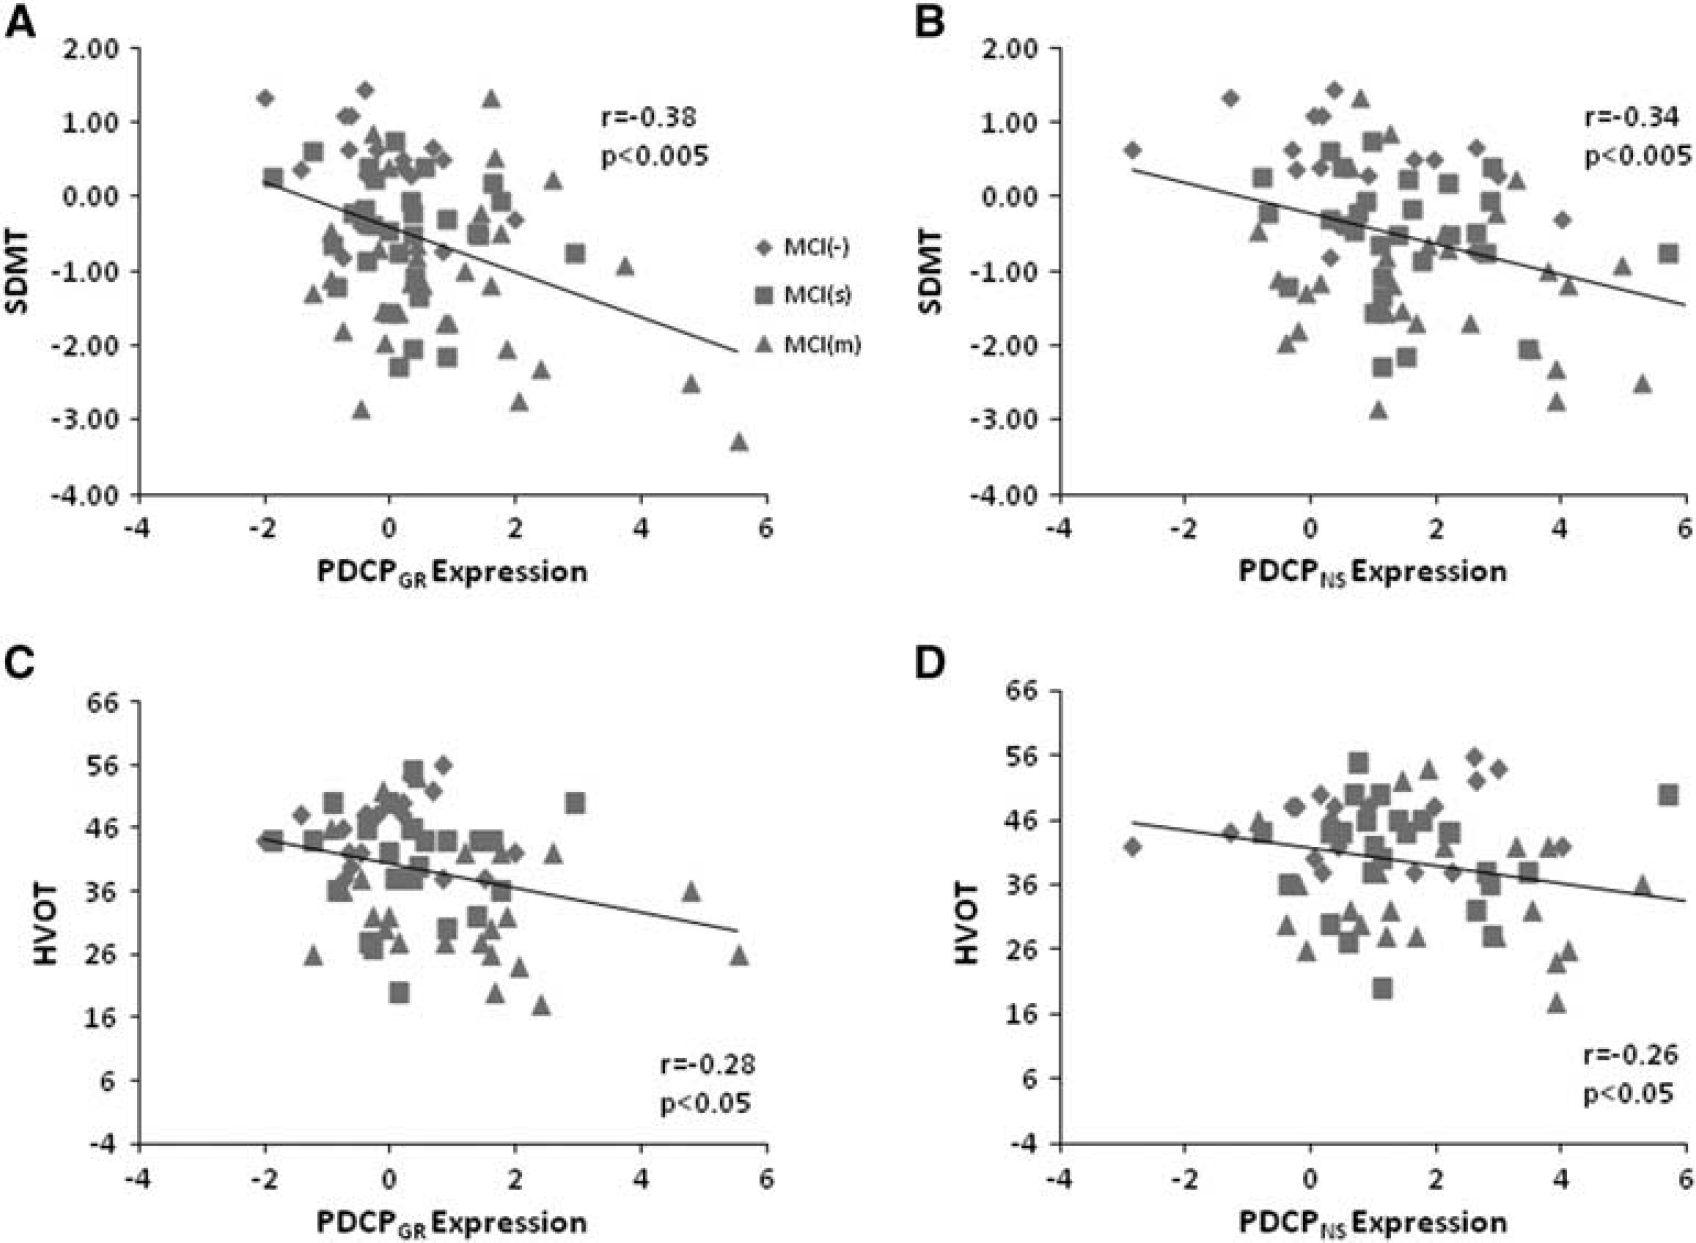
Finally, we examined the relationship between PDCPGR expression and measures of neuropsychological test performance in the testing data. Significant correlations were found between PDCPGR expression and performance on the SDMT (r = −0.38, P < 0.005; Figure 4A), HVOT (r = −0.28, P < 0.05; Figure 4C) and TMT A (r = 0.40, P < 0.05) and TMT B (r = 0.35, P < 0.05). Similar correlations with test performance were evident with the corresponding PDCPNS values: SDMT (r = −0.34, P < 0.005; Figure 4B), HVOT (r = −0.26, P < 0.05; Figure 4D) and TMT A: r = 0.31, P < 0.05). In addition, as in the Groningen sample, PDCPGR and PDCPNS expression values (Figure 2B) exhibited a close correlation (r = 0.82, P < 0.001) in individual subjects.
(
DISCUSSION
The findings suggest that the PDCP, a specific metabolic covariance pattern associated with cognitive dysfunction in PD subjects, is replicable across patient populations. We found that PDCPGR, the pattern identified in a new PD derivation cohort studied at Groningen, the Netherlands resembled the original PDCPNS topography identified in an independent patient sample studied at North Shore University Hospital in Manhasset, NY, USA. Indeed, a close correlation was found between the expression values for the two PDCP topographies in the Groningen sample and in a large independent PD testing cohort from North Shore. Moreover, the expression values for both PDCP patterns correlated similarly with neuropsychological measures of executive functioning in the two PD populations, confirming previous findings with the original PDCPNS topography.17,19,21 Finally, similar to the previously reported finding in PDCPNS expression, 21 stepwise increases in PDCPGR expression were seen in the testing sample comprised of non-demented PD patients categorized according to the degree of cognitive impairment that was present at the time of imaging. Thus, in aggregate, the data point to the potential utility of the PDCP as an objective, quantifiable biomarker of cognitive dysfunction in non-demented PD patients.
Cognitive decline in PD probably reflects several processes, including degeneration of ascending cholinergic and dopaminergic projections as well as intrinsic neocortical changes associated with localized formation of Lewy bodies and β-amyloid plaque formation. 33 Despite the heterogeneity of cognitive impairment in PD, the underlying metabolic topography was similar for the two cognition-related PD networks. Indeed, salient reductions in medial frontal and parietal metabolic activity, covarying with relative increases in the cerebellum, were defining features of both PDCP topographies. That said, PDCPGR was distinguished by contributions from several regions not represented in the PDCPNS topography, including metabolic reductions in the caudate nucleus and medial thalamus and relative increases in the anterior cingulate cortex. By contrast, the metabolic reductions seen as part of PDCPGR were localized to relatively posterior premotor regions, whereas in PDCPNS these changes extended anteriorly into the medial prefrontal cortex. Moreover, the spatial extent of the medial parietal node was greater in the original PDCPNS network.
The differences in topography may be explained by differences in the derivation of PDCPNS and PDCPGR. To identify a cognition-related metabolic pattern in the Groningen sample, we used a single test, the FAB, to evaluate executive functioning. By contrast, multiple neuropsychological tests assessing memory as well as executive function were used in the derivation of the original PDCP topography. Despite differences in the behavioral covariates used for PDCP derivation, subject scores for the two topographies were highly intercorrelated (r > 0.80) when computed in members of each PD sample on a prospective single case basis. Moreover, irrespective of topography, these values exhibited similar correlations with the corresponding cognitive performance indices: scores on the FAB in the Groningen sample, and on SDMT, HVOT and TMT A in the North Shore validation sample. We further note that different PET instruments were used at the two imaging sites. Even so, differences in scanning platforms likely do not account for the variation in PDCP topography that was observed across tomographs, reconstruction algorithms and spatial normalization techniques. 34
Although the FAB is primarily designed to capture frontal executive dysfunction, it may also be sensitive to cognitive impairment in the domains of memory and attention. 35 This may explain why the PDCPGR network involves interactions between frontal and non-frontal regions as mediators of executive function. 36 Furthermore, consistent with the cognition-related metabolic reductions found in PD using mass-univariate regional analysis,37,38 we identified the caudate and the posterior cingulate cortex as key PDCPGR nodes using an alternative multivariate network-level approach. That said, given that PDCPGR was identified using a different cognitive testing battery than PDCPNS, it is perhaps not surprising to encounter some variation in the two network topographies. One such example is the visual association cortex, which has been noted to undergo progressive metabolic decline in PD patients progressing to dementia over 2 years of follow-up. 37 Members of the current Dutch PD cohort were cognitively normal at the time of scanning. Apart from two patients who have experienced cognitive decline (Scales for Outcomes in Parkinson's Disease—Cognition score of 26 and 24 in 2014; cutoff for dementia < 22), these subjects did not report cognitive issues during the follow-up period (3.6 ± 1.1 years; range 1.3–4.9 years). This may explain why the PDCPGR does not involve metabolic loss in the visual association cortex—a region closely associated with incident dementia in PD patients.37,39
Another explanation for the topographical differences between PDCPGR and PDCPNS may be variation in symptom duration at the time of imaging in the two cohorts used for pattern identification. PD subjects in the current study had mild motor symptoms and were scanned relatively early in the disease process (duration: 4.4 ± 3.2 years; range: 1.5–11.5 years). By contrast, the PD subjects used to identify the original PDCPNS pattern covered a broad range of disease duration and severity ratings (duration: 11.0 ± 4.6 years; range: 4–17 years). Thus, PDCPGR may capture the metabolic correlates of the specific cognitive changes that occur early in the disease process. These changes are probably because of early presynaptic dopaminergic deficits and associated changes in functional connectivity involving mainly the ventral striatum and the medial prefrontal and anterior cingulate regions. This is highlighted by attrition of nigral dopaminergic afferents to the caudate, which has been found in prior studies to correlate with cognitive functioning in early-stage PD subjects.38,40 By contrast, the PDCPNS may be more general given that data from PD patients with a wider range of cognitive dysfunction were used in its derivation. Regional changes resembling the PDCPNS topography were seen in a recent univariate comparison of FDG PET scans from cognitively unimpaired (MCI(-)) and affected (MCI(+)) PD subjects. 39 In comparison to PDCPGR, the PDCPNS emphasized additional changes in posterior cortical function that occur later in the disease process. Indeed, in previous longitudinal data, we found declining metabolic activity in the prefrontal and inferior parietal lobule with advancing disease.18,20 Although increases in PDCPNS expression have been associated with reduced dopaminergic input to the caudate nucleus, 41 network activity may also be influenced by the loss of posterior cortical cholinergic terminals, resulting in impaired performance on tests of memory, visuospatial and executive functioning.42,43 Indeed, the risk of future dementia appears to be higher in patients with cognitive deficits with posterior cortical substrates. 44 In addition, we have previously noted that the cognitive response to levodopa is associated with baseline PDCPNS expression levels. 19 Whether analogous network topographies such as PDCPGR exhibit similar properties is a topic of future study.
CONCLUSION
These data add further support for the use of the PDCP as an objective biomarker of cognitive change in non-demented PD subjects. In previous studies, we have found that the PDCP possesses attributes, such as excellent test–retest reproducibility 17 and lack of a discernible placebo effect, 19 which make it potentially useful as an imaging biomarker in clinical trials directed at the cognitive manifestations of the disease. The current study provides further support for this idea by demonstrating the stability of the PDCP topography as well as the consistency of its relationship to cognitive dysfunction across patient populations.
AUTHOR CONTRIBUTIONS
SKM conceived and designed the study, analyzed and interpreted the data and drafted and revised the manuscript; CCT analyzed and interpreted the data and revised the manuscript; LKT acquired the data and revised the manuscript; RAD acquired the data and revised the manuscript; VD acquired the data and revised the manuscript; PJM acquired the data and revised the manuscript; KLL conceived and designed the study, acquired the data and revised the manuscript; and DE conceived and designed the study, interpreted the data and revised the manuscript.
DISCLOSURE/CONFLICT OF INTEREST
DE serves on the scientific advisory board and has received honoraria from the Michael J Fox Foundation for Parkinson's Research; is listed as coinventor of patents re: Markers for use in screening patients for nervous system dysfunction and a method and apparatus for using same, without financial gain; has received research support from the NIH (NINDS, NIDCD, NIAID) and the Dana Foundation; and has served as a consultant for Pfizer. All other authors declare no competing financial interests.
Footnotes
ACKNOWLEDGMENTS
The authors thank Ms Patricia J Allen and Ms Ivana De Lucia for assistance in data analysis.