
Abstract
Background/Objective:
To synchronize data collection, the National Institute of Neurological Disorders and Stroke (NINDS) recommended Common Data Elements (CDEs) for use in Parkinson’s disease (PD) research. This study delineated the progression patterns of these CDEs in a cohort of PD patients.
Methods:
One hundred-twenty-five PD patients participated in the PD Biomarker Program (PDBP) at Penn State. CDEs, including MDS-Unified PD Rating Scale (UPDRS)-total, questionnaire-based non-motor (-I) and motor (-II), and rater-based motor (-III) subscales; Montreal Cognitive Assessment (MoCA); Hamilton Depression Rating Scale (HDRS); University of Pennsylvania Smell Identification Test (UPSIT); and PD Questionnaire (PDQ-39) were obtained at baseline and three annual follow-ups. Annual change was delineated for PD or subgroups [early = PDE, disease duration (DD) <1 y; middle = PDM, DD = 1–5 y; and late = PDL, DD > 5 y] using mixed effects model analyses.
Results:
UPDRS-total, -II, and PDQ-39 scores increased significantly, and UPSIT decreased, whereas UPDRS-I, -III, MoCA, and HDRS did not change, over 36 months in the overall PD cohort. In the PDE subgroup, UPDRS-II increased and UPSIT decreased significantly, whereas MoCA and UPSIT decreased significantly in the PDM subgroup. In the PDL subgroup, UPDRS-II and PDQ-39 increased significantly. Other metrics within each individual subgroup did not change. Sensitivity analyses using subjects with complete data confirmed these findings.
Conclusion:
Among CDEs, UPDRS-total, -II, PDQ-39, and UPSIT all are sensitive metrics to track PD progression. Subgroup analyses revealed that these CDEs have distinct stage-dependent sensitivities, with UPSIT for DD < 5 y, PDQ-39 for DD > 5 y, UPDRS-II for early (DD < 1) or later stages (DD > 5).
INTRODUCTION
Parkinson’s disease (PD) is a neurodegenerative disorder characterized clinically by tremor, rigidity, and bradykinesia, and pathologically by dopaminergic neuron loss and Lewy body inclusions in the substantia nigra pars compacta [1]. There is a growing realization that PD may involve regions outside the basal ganglia [2, 3] and have many non-motor symptoms such as cognitive decline, depression, and olfactory change [3]. Despite effective symptomatic treatment, patients continue to experience progressive disability.
Developing novel and/or disease-modifying therapies for PD is an urgent unmet need that has been a primary focus of research over the past several decades [4]. Unfortunately, all clinical trials testing neuroprotective agents have been unsuccessful in the past 30 years from selegiline [5] to uric acid (https://www.ninds.nih.gov/Disorders/Clinical-Trials/Study-Urate-Elevation-Parkinsons-Disease-Phase-3-SURE-PD3). Although the failures may be due to inadequate scientific premises, drug targets, and/or pharmaceutical properties of test agents, it also is possible how the clinical trials were conducted may have contributed. First, neuroprotective clinical trials frequently require multisite, cross-institution, and national/international collaborative efforts [5–7]. Second, there is a lack of biomarkers to gauge disease progression and clinical trials often rely on clinical metrics that are subjective and/or rater dependent.
In an effort to “increase the efficiency and effectiveness of clinical research studies and clinical treatment, increase data quality, ... [and] facilitate data sharing,” the National Institute of Neurological Disorders and Stroke (NINDS), and other federal and international organizations sponsored subject-specific working groups to develop topic-driven data elements. The first set of Common Data Elements (CDEs) for PD was developed in 2010 (https://www.commondataelements.ninds.nih.gov/Parkinson% 27s% 20Disease). In 2012, NINDS commissioned the PD Biomarker Program (PDBP) to discover biofluid biomarkers. The program mandated the use of CDEs to collect clinical, motor, and non-motor data annually for all PDBP-funded projects. To date, data have been collected on ∼1500 subjects (https://pdbp.ninds.nih.gov/parkinsons-data). Penn State Hershey was one of the sites selected and in the current report, we tested several hypotheses based on data at our site: 1) select CDE metrics would capture PD progression and 2) different CDE measures may have disparate sensitivities in capturing PD progression at distinct disease durations or stages. These data may inform the outcome metric selection of future biomarker research and clinical trial endpoints.
MATERIALS AND METHODS
Subjects
The study included 125 PD patients participating in the NINDS-funded PDBP study (NS082151, with baseline enrollment from 2012-2015). PD subjects were recruited from a tertiary movement disorders clinic (see Table 1 for demographic information). All subjects gave written informed consent, consistent with the Declaration of Helsinki. The protocol was reviewed and approved by the Penn State Hershey Institutional Review Board.
Baseline demographic and clinical data for PD and PD subgroup subjects
Date represent means with standard deviations in parentheses unless otherwise indicated. F, female; HDRS, Hamilton Depression Rating Scale; LEDD, levodopa equivalent daily dosage; M, male; MoCA, Montreal Cognitive Assessment; PDE, Parkinson’s disease early stage; PDM, Parkinson’s disease middle stage; PDL, Parkinson’s disease late stage; PDQ-39, 39 Item Parkinson’s Disease Questionnaire; UPDRS, Unified Parkinson’s Disease Rating Scale, I, non-motor experiences of daily living; II, motor experiences of daily living; III, motor examination; IV, motor dysfunction; total, sum of UPDRS I–IV; UPSIT, University of Pennsylvania Smell Identification Test; y, year.
PD diagnosis was confirmed by a movement disorder specialist according to UK brain bank criteria [8]. The enrollment criteria for PD subjects included history of adequate response to dopaminergic therapy, history of asymmetric onset, and lack of neurological disorders other than PD. PD duration was defined as the date since first PD diagnosis by a physician. PD subgroups [early stage PD (PDE), <1 year, reflecting newly diagnosed patients; middle stage PD (PDM), <5 years, representative of those in the ‘honeymoon’ period; and later stage PD (PDL), >5 years, reflecting later stage patients progressing out of the “honeymoon” period] were created based on time after first documented diagnosis as done previously by our group [9].
Standardized data collection instruments
Subjects completed a baseline visit and then three annual visits thereafter. As mandated by the NINDS PDBP, subjects also completed visits at 6, 18, and 30 months. Demographic data was collected at baseline including age, gender, race, ethnicity, education level, employment status, handedness, and marital status. For the purposes of this analysis, only age, gender, and education level were included. Medical history and current medication information were obtained from all subjects, and updated at each visit. Vitals and routine bloodwork also were done at each visit in order to confirm that subjects did not have major or unstable medical conditions. Levodopa equivalent daily dosage (LEDD) was calculated for PD subjects according to published criteria [10]. Motor and non-motor data were collected only on an annual basis, except for the MDS-UPDRS-III that was obtained at each visit. As such, we analyzed clinical data only from the annual visits.
MDS-Unified PD rating scale (MDS-UPDRS)
The MDS-UPDRS (heretofore referred to as UPDRS) has four subscales that evaluate non-motor aspects of daily living (UPDRS-I), motor aspects of daily living reported by the subjects (UPDRS-II), motor symptoms assessed by a trained examiner (UPDRS-III), and motor complications (UPDRS-IV). UPDRS-III scores were obtained while PD patients were on their regular medications (in the “on” state) except for one subject at baseline who did not take his/her morning medication. UPDRS-I and –II scores were obtained by the study coordinators, whereas UPDRS-III and –IV scores were obtained by personnel who were trained using the MDS-UPDRS website modules.
Because of the longitudinal nature of the study, the expected turnover in staff, and to guard against potential rater variability, all UPDRS-III exams were videotaped and stored on our local secure server. Before data analysis, we conducted a systematic analysis of the UPDRS-III by randomly selecting 20 videos from each rater and rescoring them (except rigidity) by a well-trained and experienced rater (gold standard). Agreement statistics between the initial and gold standard rater for overall UPDRS-III scores were generated using intraclass correlation coefficients (ICC). All raters had good-excellent ICCs according to Cicchetti ([11]; <0.4 poor, 0.4–0.59 fair; 0.6–0.74 good; 0.75–1 excellent). For raters with ICC < 0.8, UPDRS-III exams were rescored (except rigidity) by two gold standard raters (with ICC > 0.94). Using this criterion, 311 of the 1264 total UPDRS-III exams (25%) were rescored by the gold standard raters. The rescored data was used for the final analyses.
Other CDEs
Cognition was assessed using the Montreal Cognition Assessment (MoCA [12]) and depression by the Hamilton Depression Rating Scale (HDRS [13]). The University of Pennsylvania Smell Identification Test (UPSIT [14]) assessed olfactory function, whereas the PD Questionnaire–39 (PDQ-39 [15]) evaluated quality of life. For the UPSIT analysis, some subjects claimed anosmia and declined completing the UPSIT test at some follow-up visits. Under this circumstance, we imputed a score using the subject’s lowest score from previous visits.
Statistical analyses
We compared demographics and baseline measures between subjects who remained in the study vs. those who withdrew, died, or were lost to follow-up. Linear mixed-effects repeated measures ANOVA models that included age, gender, and education as co-variates were used to assess annual rates of change in clinical measures over time in PD subjects. In addition, we repeated the same analysis on the subset of subjects who had complete data for the respective clinical measure (i.e., measurements at baseline and each of the annual visits). Differences among PD subgroups also were assessed using linear mixed-effects repeated measures ANOVA models covaried by age, gender, and education. All statistical analyses were performed using SAS (Cary, NC) version 9.4.
RESULTS
Baseline
Demographic and clinical data for PD subjects at baseline are summarized in Table 1. The proportion of males and females in the overall PD group favored males (69 vs. 56) and the mean±SD age was 67.7±9.3. Education level was 14.6±2.8. Median disease duration (25th, 75th percentile) for PD subjects was 3.8 (1.1, 9.6) y and the mean LEDD was 644.1±470 mg.
Demographic and clinical characteristics of the PD subgroups at baseline were not compared statistically. Descriptively, there were more subjects in the PDL (n = 55) than the PDE and PDM subgroups (n = 31 and 39, respectively), and more males. Age increased across the subgroups, whereas education years were highest in PDM and similar in PDE and PDL. As expected, disease duration, LEDD, and UPDRS-III increased and UPSIT decreased with increasing disease duration. PDE and PDM had similar HY, UPDRS-I, -II, -IV, and –total scores that then increased in PDL subjects. MoCA, HDRS, and PDQ-39 scores were slightly better in PDM than PDE and PDL subjects at baseline.
Annual visit returns
As shown in Fig. 1, 101 of the 125 PD subjects who completed the baseline visit remained enrolled at the first annual visit (81%). Three PD subjects, however, missed this visit. At the second annual visit, 90/101 PD subjects returned (89%). At this visit, three PD subjects again missed the visit. Eighty of the 90 PD subjects from the second visit returned for the third annual visit (89%). The reasons for not returning included subject withdrawal, loss to follow up, or death.
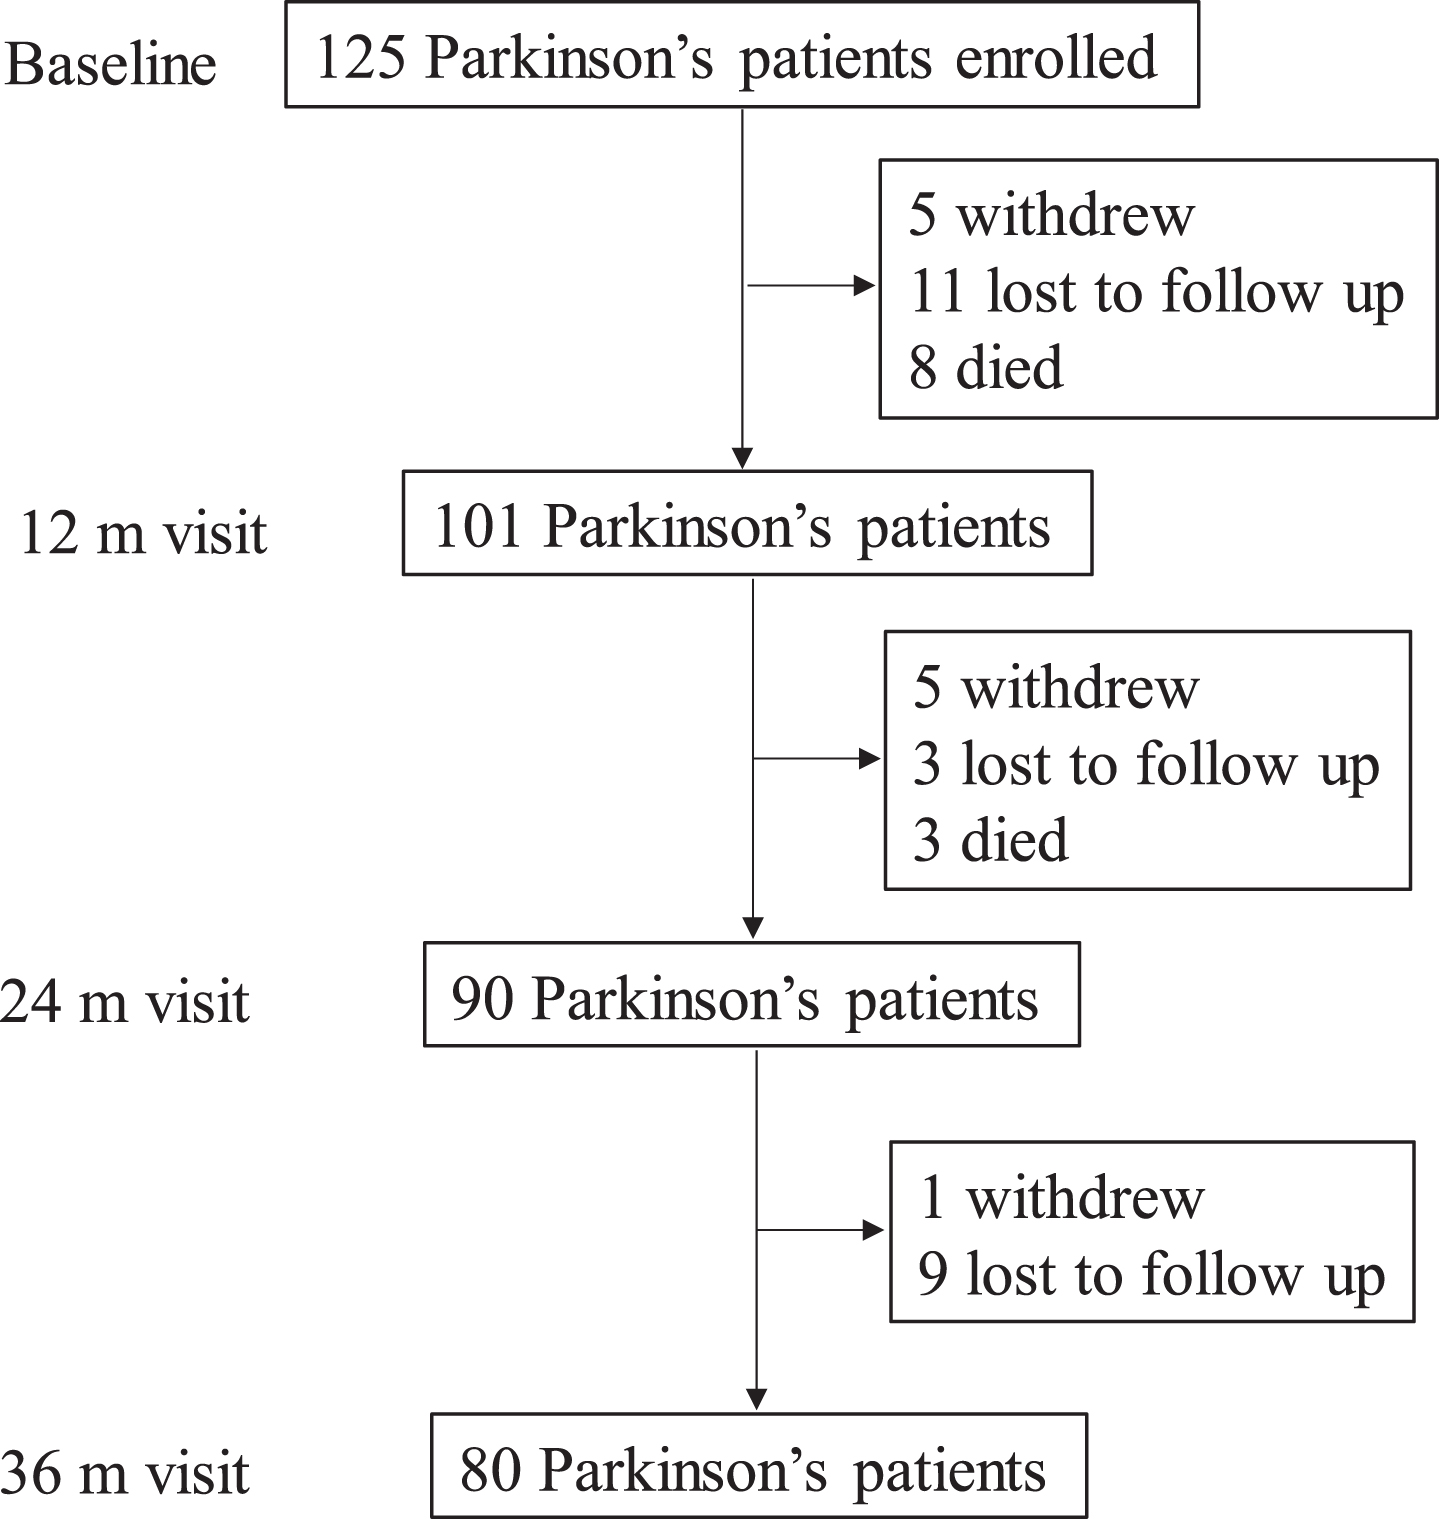
Schematic of the study design, number of dropouts, and reason for dropout for PD subjects.
We compared the baseline demographic data between subjects who remained in the study versus those who did not for the PD group (Supplementary Table 1). Within both PD groups, gender distribution and educational levels were similar, but those who did not remain in the study were older (PD p = 0.007). PD subjects who did not remain in the study had higher UPDRS-I (p = 0.002), -II (p = 0.004), –III (p < 0.001), -total (p < 0.001), HDRS (p = 0.020), and PDQ-39 (p = 0.020) scores, and lower MoCA scores (p < 0.001).
Annual longitudinal clinical change in PD subjects
The annual rates of change for the clinical measures in PD subjects are listed in Table 2 and depicted in Supplementary Figure 1. UPDRS-total (β= 1.47, p = 0.038), UPDRS–II (β= 1.00, p = 0.0001), -total (β= 1.47, p = 0.038), and PDQ-39 (β= 0.94, p = 0.004) scores increased significantly in PD subjects, whereas UPSIT scores decreased (β= –0.93, p < 0.0001). Annual rates of change in UPDRS-I, -III, MoCA, and HDRS scores were not significant within PD subjects (ps > 0.057).
Estimated annual changes of common data elements for PD and PD subgroups using a mixed effects model
Data represent the estimates for the annual rate of change for PD and PD subgroups using linear mixed effects repeated measures ANOVA models. 95% confidence intervals are in parentheses and the p value for each estimate is given. Significant changes are indicated by bold text. CI, confidence interval; HDRS, Hamilton Depression Rating Scale; LEDD, levodopa equivalent daily dosage; MoCA, Montreal Cognitive Assessment; PD, Parkinson’s disease; PDQ-39, Parkinson’s Disease Questionnaire; UPDRS, Unified Parkinson’s Disease Rating Scale; I, non-motor experiences of daily living; II, motor experiences of daily living; III, motor examination; UPSIT, University of Pennsylvania Smell Identification Test.
Sensitivity analysis of PD subjects with complete data
In PD subjects with complete data, UPDRS-I (β= 0.43, p = 0.041), -II (β= 0.96, p = 0.0001), -total (β= 1.57, p = 0.040), and PDQ-39 (β= 0.98, p = 0.002) scores increased significantly, whereas MoCA (β= –0.25, p = 0.027) and UPSIT (β= –0.81, p < 0.0001) scores decreased significantly (Supplementary Table 2). Similar to the analysis of all PD subjects, there was no significant difference for those with complete data in UPDRS-III or HDRS scores over time.
Annual longitudinal clinical change in PD subgroups
Annual rates of change in clinical measures for the PD subgroups are listed in Table 2 and depicted in Supplementary Figure 2. Within PDE subjects, UPDRS-II (β= 1.37, p = 0.014) scores increased significantly, whereas UPSIT scores decreased (β= –1.37, p = 0.0001). PDM subjects had significantly decreased MoCA (β= –0.51, p = 0.005) and UPSIT (β= –1.13, p < 0.0001) scores. Within PDL subjects, UPDRS-II (β= 1.04, p = 0.007) and PDQ-39 (β= 1.05, p = 0.037) scores increased significantly, whereas UPSIT (β= –0.48, p = 0.051) scores showed a trend decrease.
Sensitivity analysis of PD subgroups with complete data
Within PDE subjects with compete data, UPDRS-II (β= 1.01, p = 0.048) scores increased significantly and UPSIT (β= –1.43, p = 0.0002) scores decreased (Supplementary Table 2). For PDM subjects with complete data, MoCA (β= –0.45, p = 0.018) and UPSIT (β= –0.91, p = 0.002) scores decreased significantly. Within PDL subjects, UPDRS-II (β= 1.32, p = 0.001) and PDQ-39 (β= 1.20, p = 0.016) scores increased significantly.
DISCUSSION
In the current study, we investigated the baseline and annual rates of change in CDEs from our NINDS PDBP cohort that was observational in nature while a movement disorder specialist optimized patient treatment dynamically during the course of the study. We found that UPDRS-total, -II, UPSIT, and PDQ-39 scores all were able to detect longitudinal PD progression overall. These CDEs, however, had sensitivities at different PD stages. Namely, the UPSIT was sensitive for tracking earlier (DD < 5 y), the PDQ-39 for later (DD > 5 y), the MoCA for those with DD 1–5 y, and the UPDRS-II for initial (DD < 1 y) and later (DD > 5 y) stages of PD. This information shall inform PD progression and outcome metric selection for future biomarker research and clinical trials.
The cohort represents an observational, real life clinical scenario
The cohort assembled at the Penn State site captures PD progression as it evolves in real-time in a tertiary movement disorders referring center. We enrolled PD subjects ranging from newly diagnosed to those at end-stage disease. In contrast to the current cohort, many recent biomarker building studies including the Parkinson’s Progression Marker Initiative (PPMI), De Novo PD (DeNoPa), Norwegian ParkWest, the Harvard Biomarker Study (HBS), Parkinson’s Associated Risk Studies (PARS), and prodromal PPMI (P-PPMI) PD-at-risk studies are focused on early-stage PD and PD at-risk subjects [16]. Current analysis of data from our cohort has generated important new insights into PD progression from early to later stages. Future studies and follow-up of existing cohorts can build upon this foundation and compare our results while other cohorts age.
Rater-based UPDRS-III is not ideal to capture longitudinal motor progression
Although NINDS established CDEs for PD in 2010 and commissioned the PDBP in 2012 to collect clinical, motor, and non-motor data, we believe this is the first report on how these CDEs progress. The UPDRS-III, a rater based exam that is used widely to reflect PD motor disability and is a main component for the outcomes in many symptomatic trials [17–22], did not gauge progression. This is disappointing because many neuroprotective trials have used this metric as a main constituent of outcome metrics ([23–26], https://www.ninds.nih.gov/Disorders/Clinical-Trials/Study-Urate-Elevation-Parkinsons-Disease-Phase-3-SURE-PD3). There is substantial multicenter data suggesting UPDRS-III scores change over time [27, 28]; however, the current result is not totally unexpected. First, it is possible subjects were medically optimized dynamically throughout the study duration, and clinically declining UPDRS scores may have been part of the decision for physician interventions [29]. Second, it is known that patients who participate in clinical studies are more motivated, have a positive attitude, and decline less within a clinical trial setting [30]. Lastly, as a brief (5–10 minutes) assessment of motor functions, UPDRS-III exam can be influenced by factors intrinsic to patients (e.g., circadian, diurnal and daily fluctuations, food, stress, and an eagerness to impress their raters/physicians), raters (rater-rater reliability), and/or subject-rater interaction (“white coat” effect). Whereas it may be useful for monitoring the immediate response in a short-term, symptomatic drug trial, it is limited when used in gauging disease progression over the long-term. Moreover, clinically important differences in UPDRS-III scores have been estimated to range from 2.5 (minimal) to 10.8 (large) [31]. Although many factors may contribute to the failures of neuroprotective trials over the past 30 years, the use of the UPDRS-III as the primary outcome measure [23, 33] may not have been ideal in hindsight. Moreover, this previous focus on motor function missed non-motor functions that increasingly are recognized as the major source of disability for PD patients, including impaired cognition, mood changes, and autonomic function [34]. Thus, improved metrics are needed to better reflect the totality of PD progression.
Questionnaire-based scales capture longitudinal PD progression
Promisingly, several questionnaire-based measures, such as the UPDRS-I, -II, and PDQ-39, were able to capture PD progression in the current study. UPDRS-I assesses non-motor, whereas UPDRS-II evaluates motor, aspects of daily living based on patient perception encompassing the past week [35]. Thus, these measures not only yield information relevant to patients and their families, but also may be more reliable for overall non-motor and motor progression due to their goal of assessing these metrics more comprehensively and over a longer duration of time. Moreover, the UPDRS-I, UPDRS-II, and PDQ-39 scales lack the inherent confounds associated with the rater-dependent UPDRS-III, which may be subjective and vulnerable to unconscious bias within the examiner and a “placebo” effect within the PD subject ([36], https://www.worldpdcongress.org/home/2018/5/14/h9kmk04picf604vzz21j6va7x3tm6o). Indeed, the current results are consistent with previous studies reporting increased UPDRS-I, –II, [37, 38] and PDQ-39 [39] scores in PD over time. Some of limitations of using UPDRS-I, –II, and PDQ-39 however, are their retrospective and subjective nature. Growing usage of electronic devices, coupled with the growth of “big data” management, may enable us to address these weakness by investigating the usage of electronic evaluation [40] and/or a diary [41] in the home setting.
UPSIT emerges as a strong clinical metric for PD progression
Another promising new finding from our data is that UPSIT scores also were reliable in assessing PD progression. Olfactory dysfunction is common in PD, with approximately 90% of patients showing some type of olfactory loss [42]. Interestingly, olfactory dysfunction is present in idiopathic REM behavioral disorder (RBD) [43], but not in leucine rich repeat kinase 2 (LRRK2) G2019S carriers [44], although both are thought to be prodromal for PD. Unfortunately, the sample size (n = 3) for LRRK-positive subjects was too small for us to explore olfactory changes in the current analyses. Whereas initial studies suggested olfactory dysfunction was stable over time [45–47], several indicated that decreased olfaction is associated with increased disease severity [48, 49]. In a recent longitudinal study of 25 PD and 23 control subjects, however, olfactory function decreased similarly in PD and controls over four years, although the absolute magnitude was greater in PD than controls (2 vs. 1.3 points) [50]. In our own control group, we detected similar UPSIT declines but our PD cohort declined faster compared to controls (data available upon request). Prodromal PD populations also show non-significant changes over time [43, 44]. Clearly, additional longitudinal studies are warranted but the current findings of decreased UPSIT scores in PD subjects over time provide confirmation of these previous cross-sectional results [48, 49] and rationale for the inclusion of UPSIT testing in future studies related to PD progression.
CDEs have distinct sensitivities at different PD stages
It is known that PD clinical progression is not linear. The subgroups analyses in the current study intended to gain insight into this pattern and yield the clinical metrics to track PD progression at each stage. Based on our clinical knowledge, we expected dynamic changes in symptoms after the initial diagnosis prior to optimized drug treatments by a research movement disorders specialist (simulated by our PDE group), relatively stable clinical symptoms during the “honeymoon” period that generally lasts ∼5 years (simulated by our PDM group), and worsening again despite best treatments (simulated by our PDL group). Our findings of significant UPDRS-II progression in PDE and PDL confirmed this clinical scenario and is consistent with past studies showing UPDRS-II scores increased over time in early PD subjects [37, 38]. but were relatively stable over five years in a community PD cohort [51].
Our findings of worsening UPSIT and MoCA in PDM subjects provided sensitive clinical metrics for PD progression. Interestingly, these measures changed while motor symptoms (UPDRS-III) were relatively stable. These data suggest a cautionary note for clinicians in that even during the “honeymoon” period, PD patients continue to progress and they should watch closely for cognitive changes during this stage. This may allow for proactive treatment of cognitive symptoms that are debilitating for patients and result in increased disease burden [34].
PDQ-39 scores increased significantly within PDL subjects with complete data compared to controls. The PDQ-39 is another questionnaire-based instrument (similar to UPDRS-I and II) that assesses quality of life from the patient’s perspective [15], lending further support to the notion that these rather than clinician-rated scales may be more reliable in capturing PD-related progression metrics. The lack of significant PDQ-39 progression in earlier PD subgroups is consistent with previous reports indicating the PDQ-39 may be less suitable in early-stage patients due to large ceiling effects in mildly-perceived PD and bias toward more severe health indices [52] or their still being within the ‘honeymoon” period.
Limitations
We conducted longitudinal analyses of CDE clinical measures in a local PD cohort that was part of the NINDS PDBP consortium and yielded important insight about both PD progression and outcome metric selection for future biomarker research and clinical trials. There are, however, several limitations. Although our sample size was relatively large (125 PD at baseline), it still is relatively small for assessing clinical change over time and thus studies in larger cohorts are needed to verify these results. We also chose to report on our local cohort because we have intimate and first-hand knowledge about the cohort and study team. Thus, our results may not generalize to studies at other PDBP sites or other cohorts. Future studies are needed to investigate CDE progression in PD using the entire PDBP and other cohorts that may yield insight on factors influencing CDE changes. We assessed changes in the overall PDQ-39 but previous studies have shown minimally important differences vary across the different subscales [53]. Analyses of these subscales over time may provide important insight into patient quality of life. We also did not include all other factors related to prognostic factors such as REM sleep behavior disorder, orthostatic hypotension, genetics (such as LRRK2 status), or other comorbidities. Although including later-stage PD subjects yielded insight about later-stage PD progression, these patients also are likely to drop out of the study, which may bias our final analyses. Future studies are needed that include home monitoring and evaluations that would allow us to follow this group of patients longer. Nonetheless, the current study yielded novel information that shall be integrated into consideration in planning and designing future clinical trials, and potentially may guide current clinical practice (such as following cognitive status even during the “honeymoon” period).
Conclusion
Among CDEs, UPDRS-total, –II, PDQ-39, and UPSIT all are sensitive metrics to track PD progression. Subgroup analyses revealed that these CDEs have distinct stage-dependent sensitivities, with UPSIT for DD < 5 y, MoCA for DD 1–5 y, PDQ-39 for DD > 5 y, and UPDRS-II for early (DD < 1 y) and later stage (DD > 5 y) of PD. The data may inform outcome metric selection for future biomarker research and clinical trials.
CONFLICT OF INTEREST/FINANCIAL DISCLOSURES
The authors report no conflicts of interest.
Mechelle Lewis: Received funding from the National Institute of Neurological Disorders and Stroke (NINDS), the National Institute of Environmental Health Sciences (NIEHS), the Michael J. Fox Foundation for Parkinson’s Research, the Alzheimer’s Association, Alzheimer’s Research UK, the Weston Brain Institute, Bristol Myers Squibb, Pfizer, and the Department of Defense.
Elias Harkins: Nothing to report.
Eun-Young Lee: Received funding from the Korean National Research Foundation.
Christy Stetter: Received funding from NINDS, the Michael J. Fox Foundation for Parkinson’s Research, the National Center for Advancing Translational Research (NCATS), the National Center for Complementary and Integrative Health, and NIH.
Bethany Snyder: Received funding from NINDS, Bristol Myers Squibb, and Pfizer.
Tyler Corson: Received funding from NINDS, NIEHS, Bristol Myers Squibb, and Pfizer.
Guangwei Du: Received funding from the NINDS, NIEHS, the Michael J. Fox Foundation for Parkinson’s Research, the Alzheimer’s Association, Alzheimer’s Research UK, the Weston Brain Institute, and the Department of Defense.
Lan Kong: Received funding from NINDS, NIEHS, NCATS, the Patient-Centered Outcomes Research Institute (PCORI), the National Institute on Disability, Independent Living, and Rehabilitation Research (NIDILRR), the National Institute of Aging (NIA), and Pfizer.
Xuemei Huang: Received funding from the NINDS, the NIEHS, the National Science Foundation, the Michael J. Fox Foundation for Parkinson’s Research, the Alzheimer’s Association, Alzheimer’s Research UK, the Weston Brain Institute, Bristol Myers Squibb, Pfizer, and the Department of Defense. Has received consultant fees from NIEHS.
Footnotes
ACKNOWLEDGMENTS
We express gratitude to all of the participants who volunteered for this study and study personnel who contributed to its success. All analyses, interpretations, and conclusions are those of the authors and not the research sponsors. This work was supported in part by the National Institute of Neurological Disorders and Stroke Parkinson’s Disease Biomarker Program (NS082151 and NS112008 to XH), the Hershey Medical Center General Clinical Research Center (National Center for Research Resources, Grant UL1 RR033184 that is now at the National Center for Advancing Translational Sciences, Grant UL1 TR000127), the PA Department of Health Tobacco CURE Funds, and the Penn State Translational Brain Research Center.