
Abstract
Background:
A specific T1-weighted magnetic resonance imaging (MRI) sequence has been shown to detect substantia nigra (SN) neuromelanin (NM) signal changes that accurately discriminate Parkinson’s disease (PD) patients from controls, even in early disease stages. However, it is unclear what happens to these SN changes in later disease stages and if they can be a marker of disease progression.
Objective:
to investigate the pattern of SN-NM area loss and contrast ratio (CR) intensity changes in late-stage PD (LSPD) compared to earlier disease stages.
Methods:
A comparative cross-sectional study was performed, analyzing SN-NM MRI signal in LSPD (Schwab and England Activities of Daily Living Scale score <50 or Hoehn Yahr Stage [HY] >3), comparing this group with de novo, 2–5 year PD and controls. SN-NM signal area and CR values for the internal and lateral SN regions were obtained with semi-automated methods.
Results:
13 LSPD, 12 de novo patients with PD, 10 PD patients with a 2–5 year disease duration, and 10 controls were included. NM signal area was significantly decreased in LSPD compared to de novo PD (P-value = 0.005; sensitivity: 75%; specificity 92% and AUC: 0.86). In the lateral SN region, a decrease in the CR was detected in all PD groups compared to controls; despite not reaching statistical significance, a slight increment was observed comparing LSPD to 2–5 year PD. NM signal area significantly correlated with HY (R = –0.37; P < 0.05) and Movement disorder Society Unified Parkinson’s Disease Rating Scale part II (MDS-UPDRS) (R = –0.4; P < 0.05) while a weak correlation was found with MDS-UPDRS part III (R = –0.26; P: 0.1).
Conclusion:
SN area evaluated by NM-sensitive MRI may be a promising biomarker of nigral degeneration and disease progression in PD patients.
INTRODUCTION
Parkinson’s disease (PD) is a neurodegenerative disorder characterized by a selective loss of pigmented neurons in the substantia nigra (SN) pars compacta (SNc) and locus coeruleus (LC) and by the appearance of Lewy bodies [1, 2]. Approximately 60–70% of dopaminergic neurons of the SNc are lost before the onset of clinical PD symptoms and their degeneration progresses throughout the disease [3].
The degree of neuronal loss in the SNc is correlated to PD severity, which confirms the potential of SNc imaging for tracking disease progression [4].
The pronounced depigmentation of SNc neurons is related to the loss of neuromelanin (NM), which, in PD patients, occurs in the whole pars compacta region though preferentially affecting the ventrolateral part [5]. Over the last 10 years, new T1-weighted magnetic resonance imaging (MRI) sequences have been shown to detect a significant reduction in the SN-NM signal in PD compared to healthy subjects; these sequences also enable the differential diagnosis with essential tremor [6]. Furthermore, a reduction of SN and LC contrast ratios (CR) has been reported in PD patients distinct from atypical parkinsonian syndromes [6–11]. These NM changes have a high diagnostic sensitivity and specificity for PD diagnosis, even in early clinical stages [8, 12–14].
However, the relative ability of NM-sensitive MRI to mark disease progression and to detect potential differences in pathophysiological processes still remains unclear. Currently, very few studies have looked at longitudinal changes in the SN NM with MRI; inconsistent results have been reported, that could be related to differences in MR acquisition parameters and data analysis [12, 15–17]. Likewise, only a few studies have suggested a potential correlation of NM SNpc signal intensity loss (or CR) or NM-volume loss with disease severity, i.e. Hoehn and Yahr rating scale (HY) or Unified Parkinson’s Disease Rating Scale (UPDRS) scores [8, 16].
The purpose of this study was to investigate the pattern of SN-NM area loss and CR intensity changes in late-stage PD (LSPD) patients, compared to de novo PD patients and PD patients with a 2–5 year disease duration, and thereby evaluate NM changes throughout disease progression.
PATIENTS AND METHODS
Patients
We performed a comparative cross-sectional study that included 45 subjects: 13 LSPD, 12 de novo PD patients, 10 PD patients with a 2–5 year disease duration, and 10 healthy subjects.
Inclusion criteria for healthy subjects, de novo PD patients and patients with a 2–5 year disease duration has already been reported in a previous paper [12]. Patients were recruited from the Movement Disorders Unit of the University Hospital of Santa Maria, Lisbon. PD was defined according to the UK Brain Bank criteria [18] and diagnosis was made by a movement disorders specialist. LSPD was defined as PD patients with either a Schwab and England score (S&E) < 50 (MED ON) or a Hoehn &Yahr stage (HY) >3 (MED ON) [19, 20].
PD patients were rated using the UPDRS, except for the LSPD group who were evaluated by means of the Movement Disorder Society (MDS) UPDRS [21], while MED ON. Conversion from the UPDRS-part II and UPDRS-part III to the MDS-UPDRS part II and MDS-UPDRS part III respectively, was performed adopting the algorithm proposed by Goetz and colleagues [22]. De novo PD patients were not on antiparkinsonian medication and they were all <6 months since the beginning of clinical symptoms. L-dopa equivalent daily dose (LEDD) was calculated according to recognized standard conversions [23]. The Local Ethical Committee approved the study and all patients provided informed consent.
Imaging protocol
A 3.0 T Phillips scanner (Phillips Achieva; Phillips Medical Systems, Best, Netherlands) was used to acquire all data. A T1 -weighted fast spin echo NM-sensitive pulse sequence was used as previously described by Sasaki and colleagues, [24] with a repetition time/effective echo time of 633/10 ms, echo train length of 3, 20 slices with 2.5 mm of thickness and intersection gaps of 0 mm, field of view of 220 mm, matrix size of 548×474 (pixel size of 0.40×0.40 mm2) and an acquisition time of 8 min. Slices were set in an oblique axial plane perpendicular to the fourth ventricle floor and covering from the posterior commissure to the inferior border of the pons. Magnetization Prepared Rapid Acquisition Gradient Echo (MPRAGE) images were also acquired for volumetric analysis, with 0.74×0.74×1.0 mm3 resolution, TR/TE of 9.6/4.6 ms. In case of motion artefact, the sequence was repeated adjusting the slice positioning and reiterating to the patient on the importance of remaining still.
Image analysis
The software OsiriX (OsiriX Lite version 8.0, Pixmeo, Geneva, Switzerland) was used to perform image analysis. A Gaussian filter (full width at half maximum of 0.8 mm) was applied to reduce image noise, prior to performing image segmentation using the confidence region growing algorithm. As the high signal intensity SN was always visible in three slices, the middle slice, corresponding to the greatest SN volume was selected for segmentation.
Two symmetrical seed points were manually defined on the most medial part of the high intensity area in the SN, and as close as possible to an imaginary straight line passing through the bottom of the interpeduncular cistern. The SN CR were assessed by positioning circular regions of interest (ROI), covering approximately 26 pixels, in the internal and lateral parts of both sides of the SN and in the lateral part of the crus cerebri, taken as a reference. The CR were calculated using the following equations:
Where CRiR,iL,lR,iL correspond to the CR of the internal right (iR), internal left (iL), lateral right (lR) and lateral left (lL) regions of the SN, respectively. SNiR,iL,lR,lL are the average values of the signal intensities within the ROIs positioned on the described regions of the SN, and CC R , L the average values of the signal intensities within the ROIs positioned on the right and left region of the crus cerebri, respectively (Fig. 1).
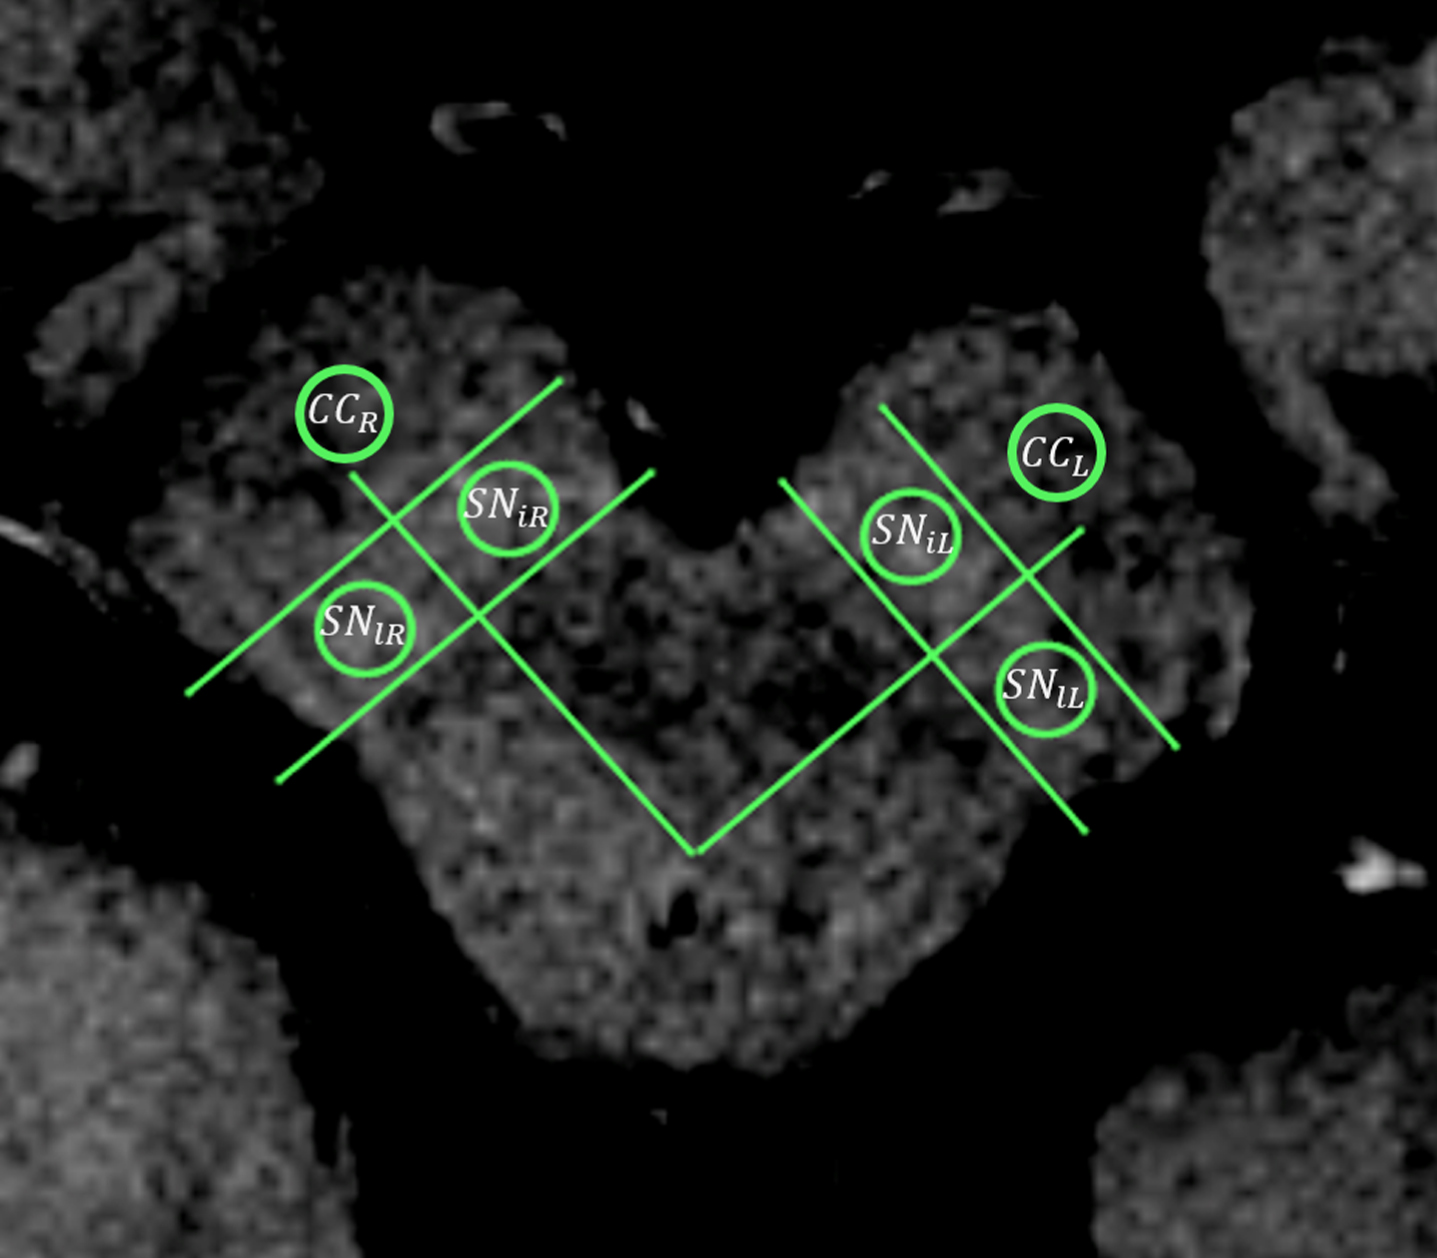
Representative CR assessment by means of circular regions of interest on an NM-sensitive T1-weighted MRI. CC r : crus cerebri right; CC L : crus cerebri left; SN iL : substantia nigra, left internal region; SN lL : substantia nigra, left lateral region; SN iR : substantia nigra, right internal region; SN lR : substantia nigra, right lateral region.
The midbrain and brainstem volumes were estimated using Freesurfer® for the automatic segmentation of the MPRAGE images. To account for inter-subject variability, the fraction of midbrain to brainstem volume (MBF) was calculated.
Statistical analysis
The Wilcoxon Ranked Test was used to test statistical differences between right and left NM area among subjects of each group. Kruskal-Wallis tests were employed with P-values corrected for multiple comparisons using the Bonferroni method. Potential differences in the SN areas and in the clinical characteristics among the different groups were evaluated. The Wilcoxon signed-ranked test was performed to evaluate differences between the area and CR of both sides of the SN of each subject.
Receiver operating characteristic curve (ROC) analyses were performed to determine the sensitivity, specificity, cut-off optimal values and the area under the curve (AUC) for distinguishing between the different PD groups. The Pearson product-moment correlation coefficient was used to evaluate the dependence between the MDS-UPDRS Part III score, MDS-UPDRS part II, LEDD, HY stage, age and the mean area of the SN and CRl/CRi results. Also, the dependence between the MBF and the SN areas was evaluated.
Differences in the clinical characteristics were also assessed. The chi-squared test was performed to evaluate differences in the sex distribution among groups. For comparison of the age between groups as well as for the MDS-UPDRS total score and MDS-UPDRS Part III, the Kruskal-Wallis test was used. A P value of 0.05 was considered significant.
All analyses were performed with the R software (Version 3.3.1, The R Foundation for Statistical Computing, Vienna, Austria).
RESULTS
MRI was performed on all subjects, and the image quality allowed a clear identification of the high signal area in the SN region as well as a semi-automatic analysis of all NM-MRI images.
The demographic and clinical characteristics of all subjects are detailed in Table 1. LSPD patients had a median disease duration of 14 years [IQR: 9–17]. They were significantly older compared to controls and de novo PD patients and had a worse HY stage and MDS-UPDRS part II compared to the de novo and 2–5 year PD groups. MDS-UPDRS part III scores of LSPD patients were worse compared to the de novo and 2–5 year PD groups, but the difference was statistically significant only for 2–5 year PD patients (Table 1).
Demographic, clinical and neuromelanin assessment data of patients and controls. Values are presented as median [IQR: 25th–75th percentile] if not otherwise specified. NA, not available; LEDD, levodopa equivalent daily dose; CR, contrast ration; HY, Hoehn and Yahr rating scale; MDS-UPDRS, Movement disorders society Unified Parkinson’s disease Rating Scale Comparisons: a) controls versus de novo PD; b) controls versus 2–5 years PD; c) controls versus LSPD; d) de novo PD versus LSPD; e) 2–5 years versus LSPD; f: de novo PD versus 2–5 years PD. Statistical significant results are in bold characters
We found no difference between the left and right NM areas (0.31 < P <0.79) and so the mean right/left area value was used in all subsequent analysis.
The median SN-NM area obtained for de novo PD patients, 2–5 year PD, LSPD groups and healthy subjects is detailed in Table 1.
The median SN-NM area was markedly decreased in PD groups compared to controls (Fig. 2) with a P value of 0.002 for de novo PD patients and a P value <0.001 for 2–5 year PD and LSPD groups (Table 1). The NM area of the LSPD group was significantly smaller when compared with the de novo group (P = 0.005) but not when compared to the 2–5 year PD group (Table 1 and Fig. 3).
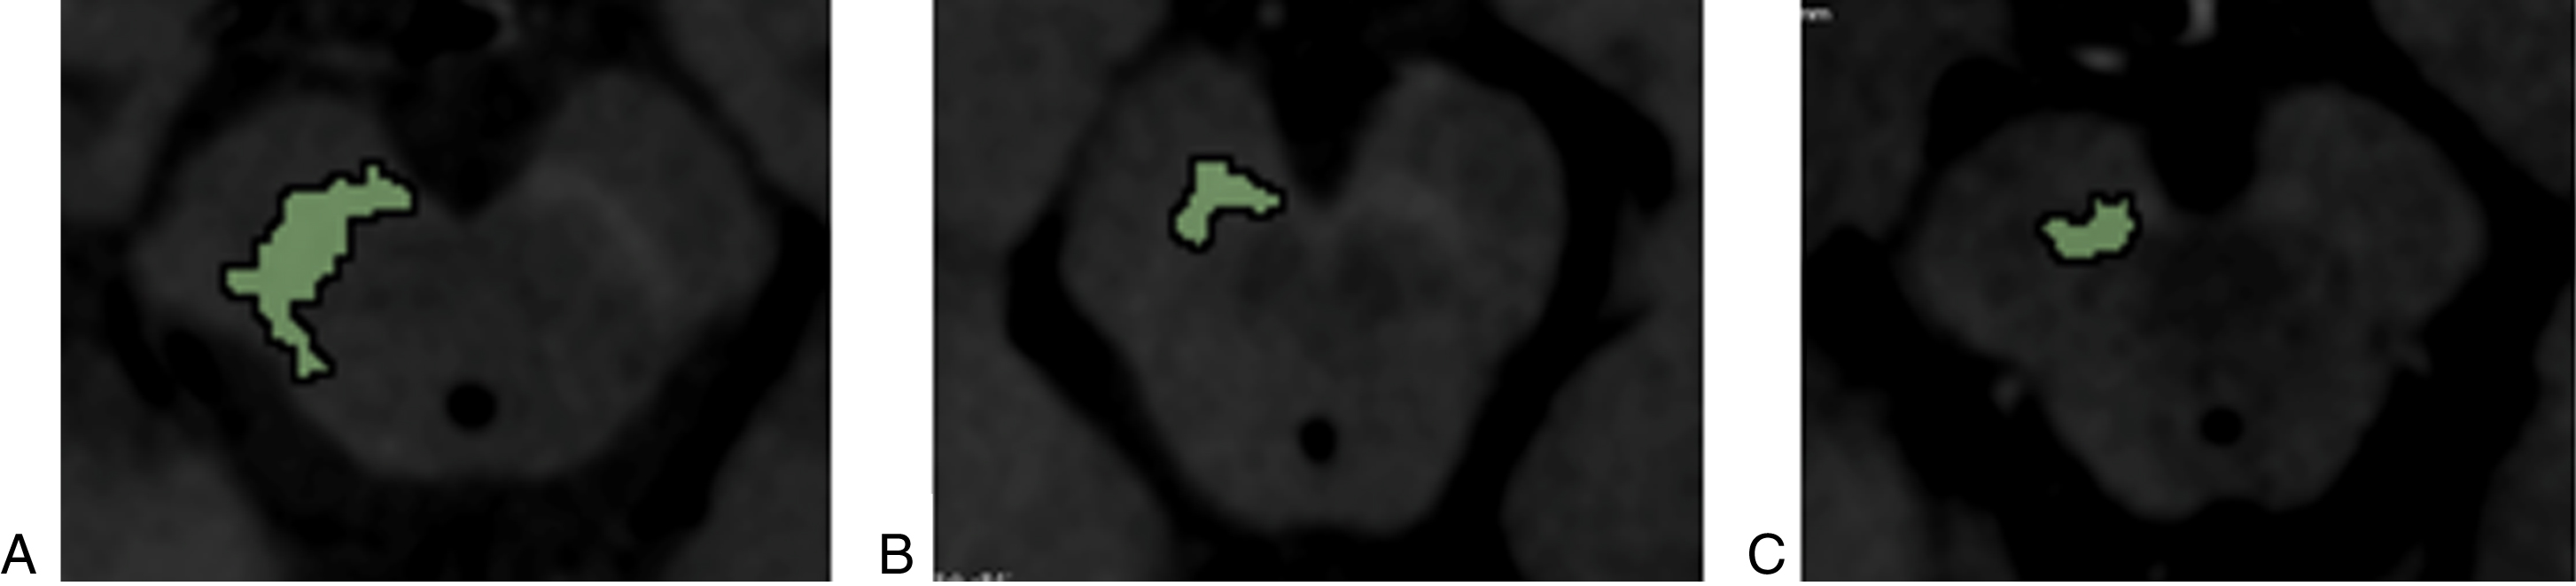
Neuromelanin (NM) area selection on NM-sensitive MRI of the SN of a healthy control (A), a de novo PD patient (B) and a LSPD (C) patient.
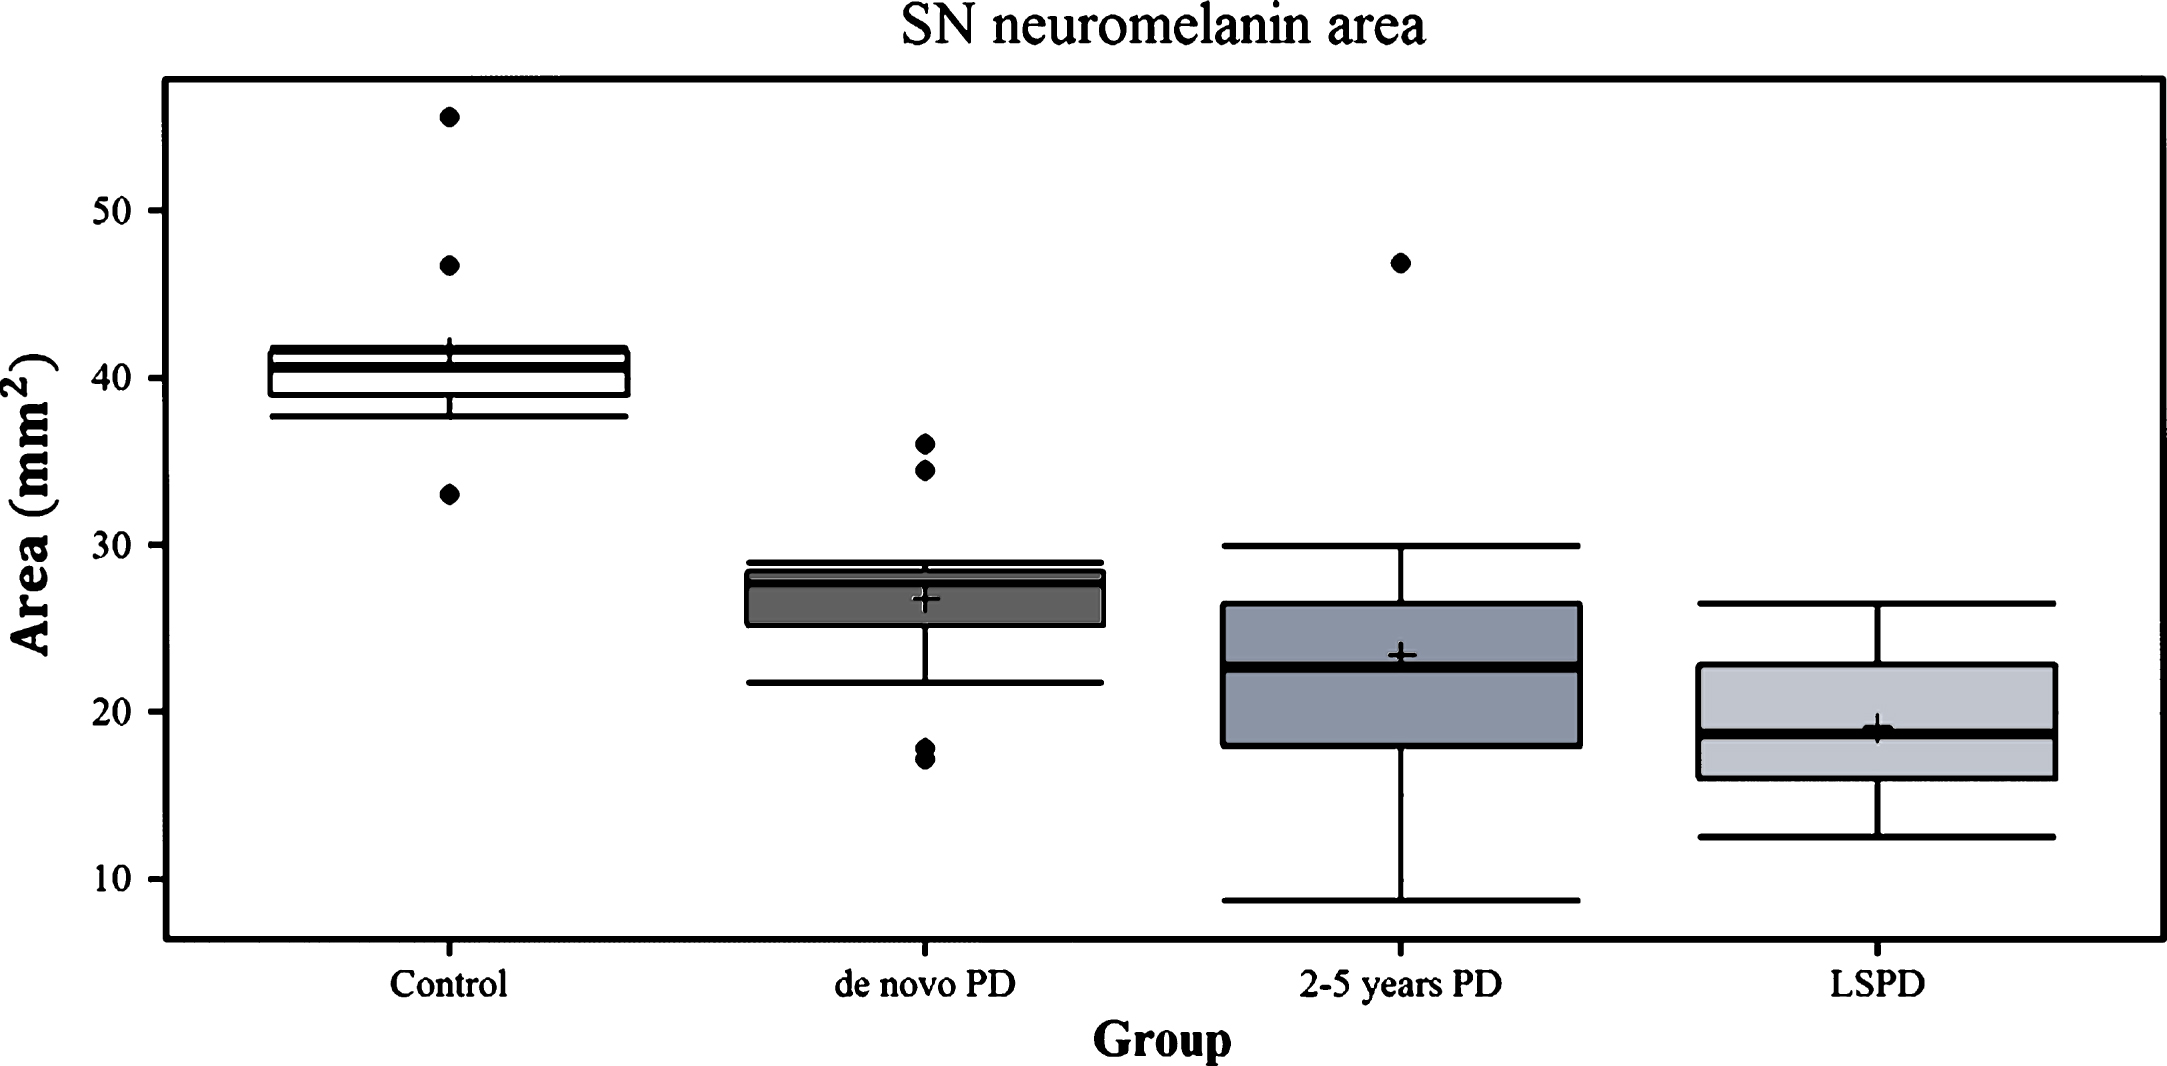
Median area values of the SN high intensity region on NM-sensitive MRI in de novo PD patients, 2–5 year PD patients, LSPD patients and controls.
On ROC analyses, the sensitivity and specificity of the SN high signal area for discriminating the LSPD group from earlier PD groups were: a) 75% and 92%, respectively, with a cut-off value for the area set at 26.31 mm2 and an AUC of 0.86 if compared to de novo PD (Fig. 3, Panel B); b) 70% and 62%, respectively, with a cut-off value for the area set at 19.29 mm2 and an AUC of 0.65 if compared to 2–5 year PD; (Fig. 4, Panel C). The sensitivity and specificity for discriminating the 2–5 year PD group from the de novo group were 67% and 80%, respectively, with an area cut-off value of 27.16 mm2 and an AUC of 0.69 (Fig. 3, Panel A). Finally the sensitivity and specificity for discriminating all PD patients from controls were 100% and 91%, respectively, with an area cut-off value of 33.02 mm2 and an AUC of 0.969 (Fig. 4, Panel A).
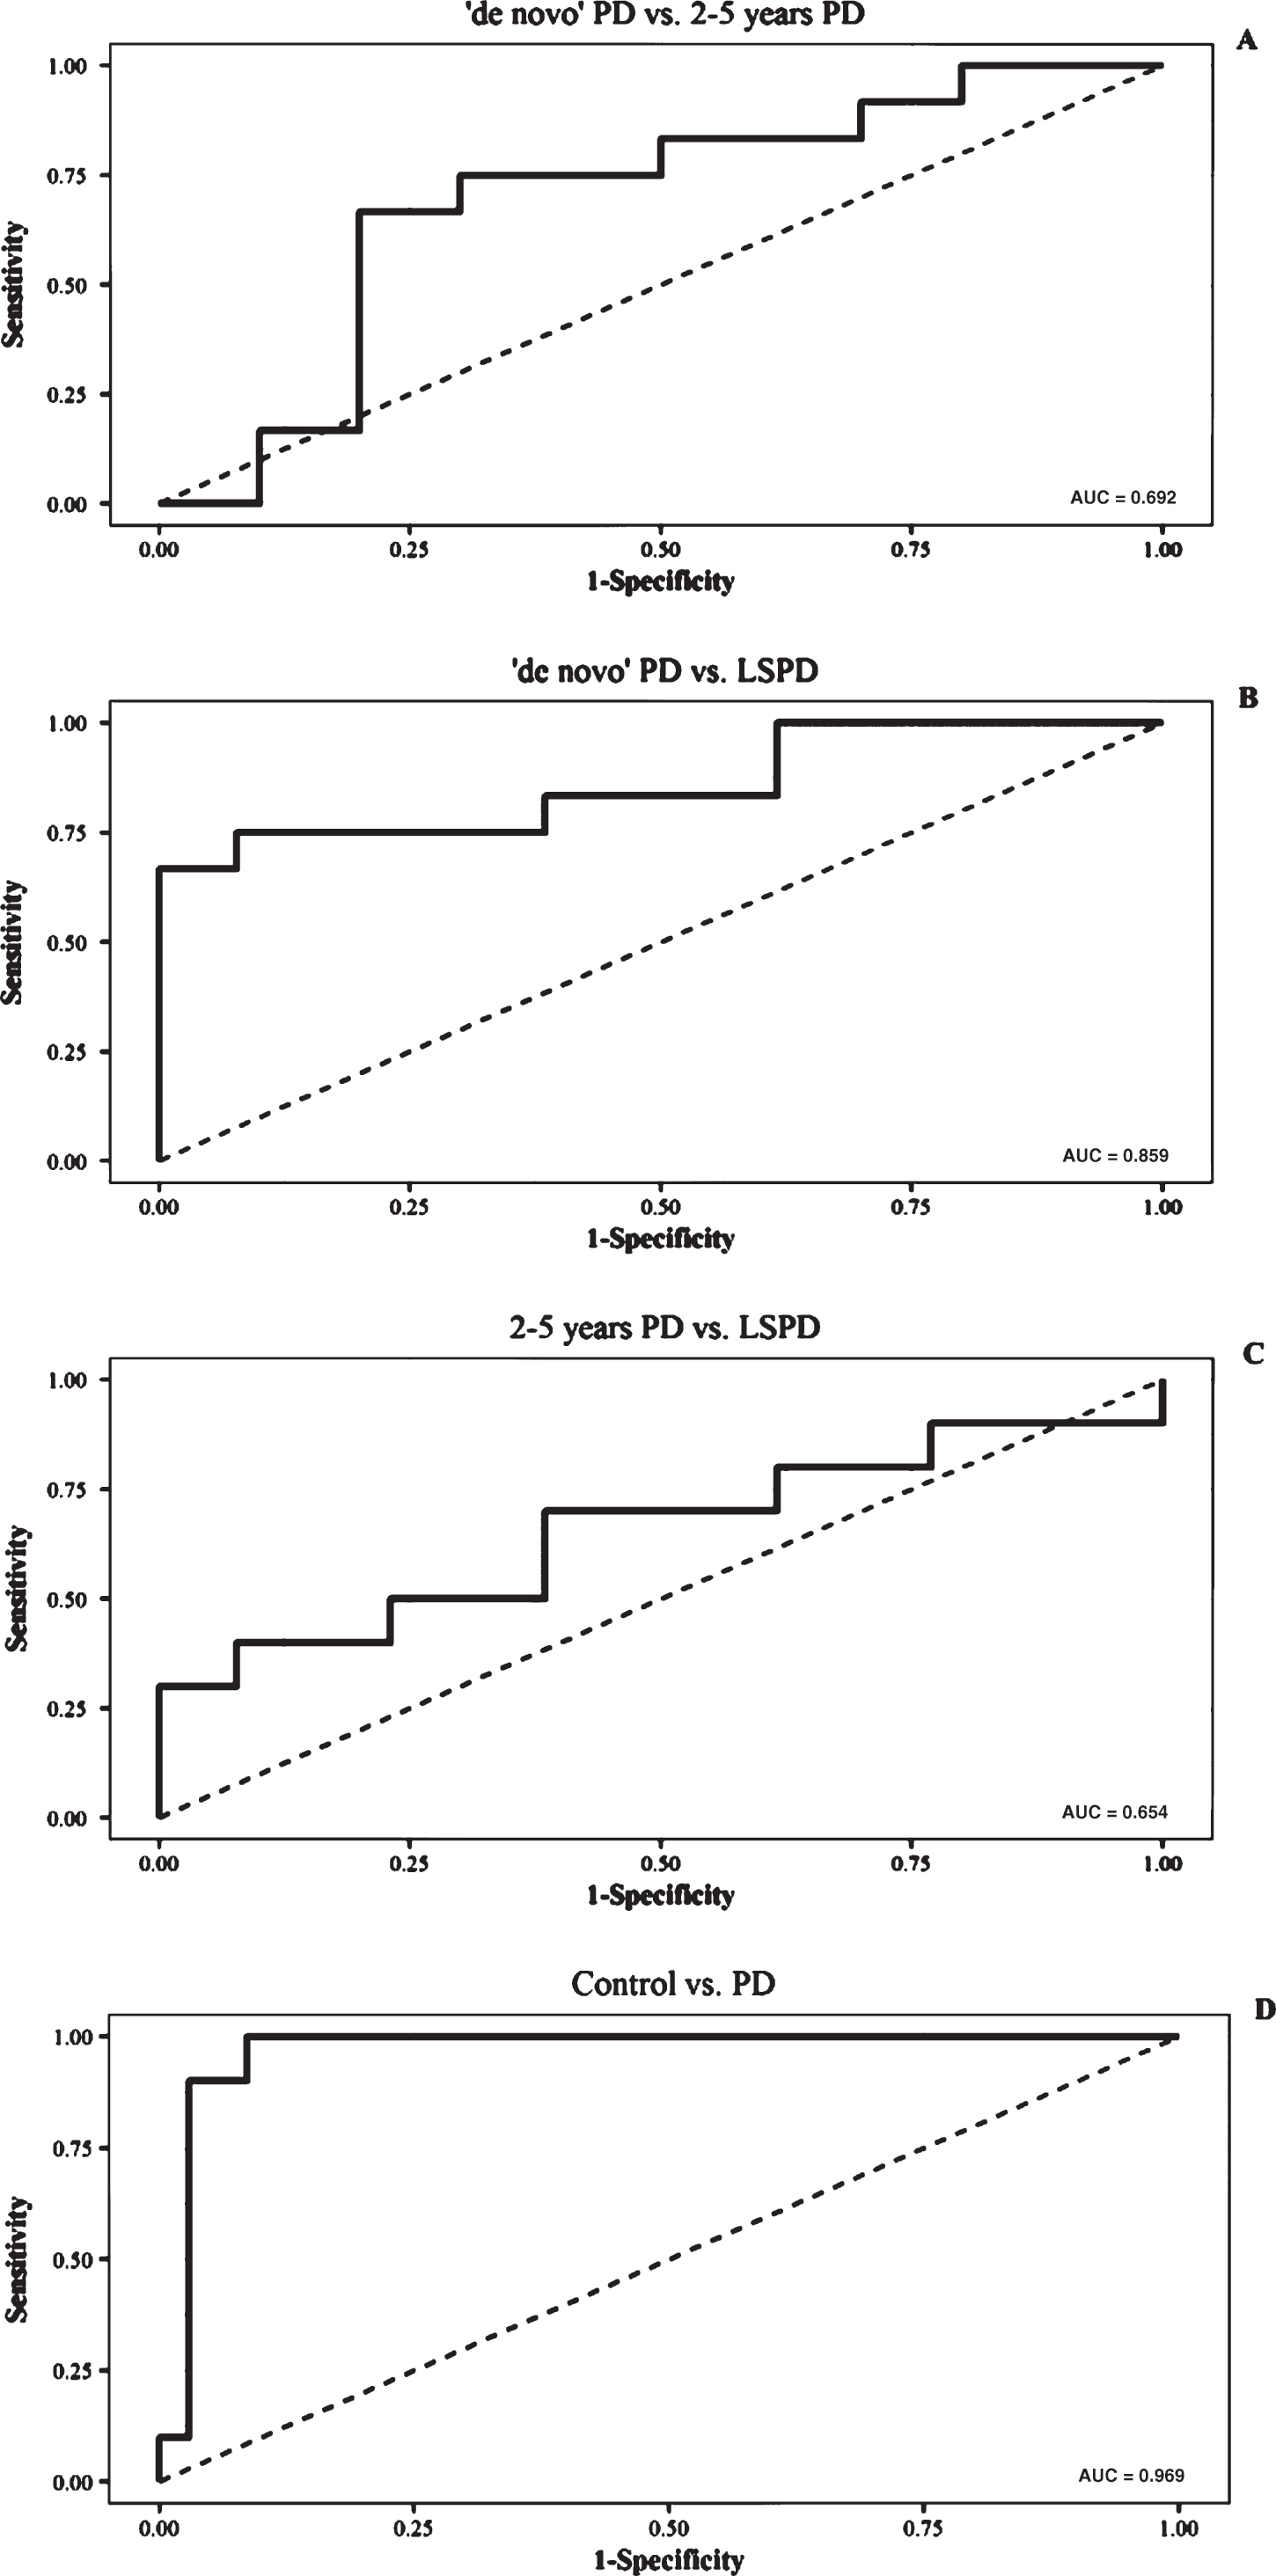
Receiver Operator Characteristics (ROC) curves of the NM area for: a) differentiating between de novo PD versus 2–5 year PD patients (A); b) de novo PD versus LSPD patients (B); c) 2–5 year PD versus LSPD patients (C); d) PD versus controls.
No differences were found among right versus left CR in both medial and lateral SN across all groups, except for the LSPD group (P < 0.05). Thus, CR analysis was performed independently for left and right values. CR analysis for both right and left sides of the internal SN region showed no differences across all PD groups and controls. Concerning the lateral SN region, CR analysis showed a significant difference only for the left side between 2–5 year PD patients and controls (P < 0.05).
The median left and right CR results obtained for the internal and lateral SN region are detailed in Table 1. Across all groups no differences were found for the internal SN region (P = 0.06), while CR in the lateral region was significantly different between controls and 2–5 year PD patients (P = 0.008) (Fig. 5). Although no other statistically significant differences were found, a tendency for CR decrease was observed with disease progression for early-intermediate stage groups (Fig. 5). Contrary to this trend, an increment in CR was observed for the LSPD group if compared to the 2–5 year PD group (Fig. 4).
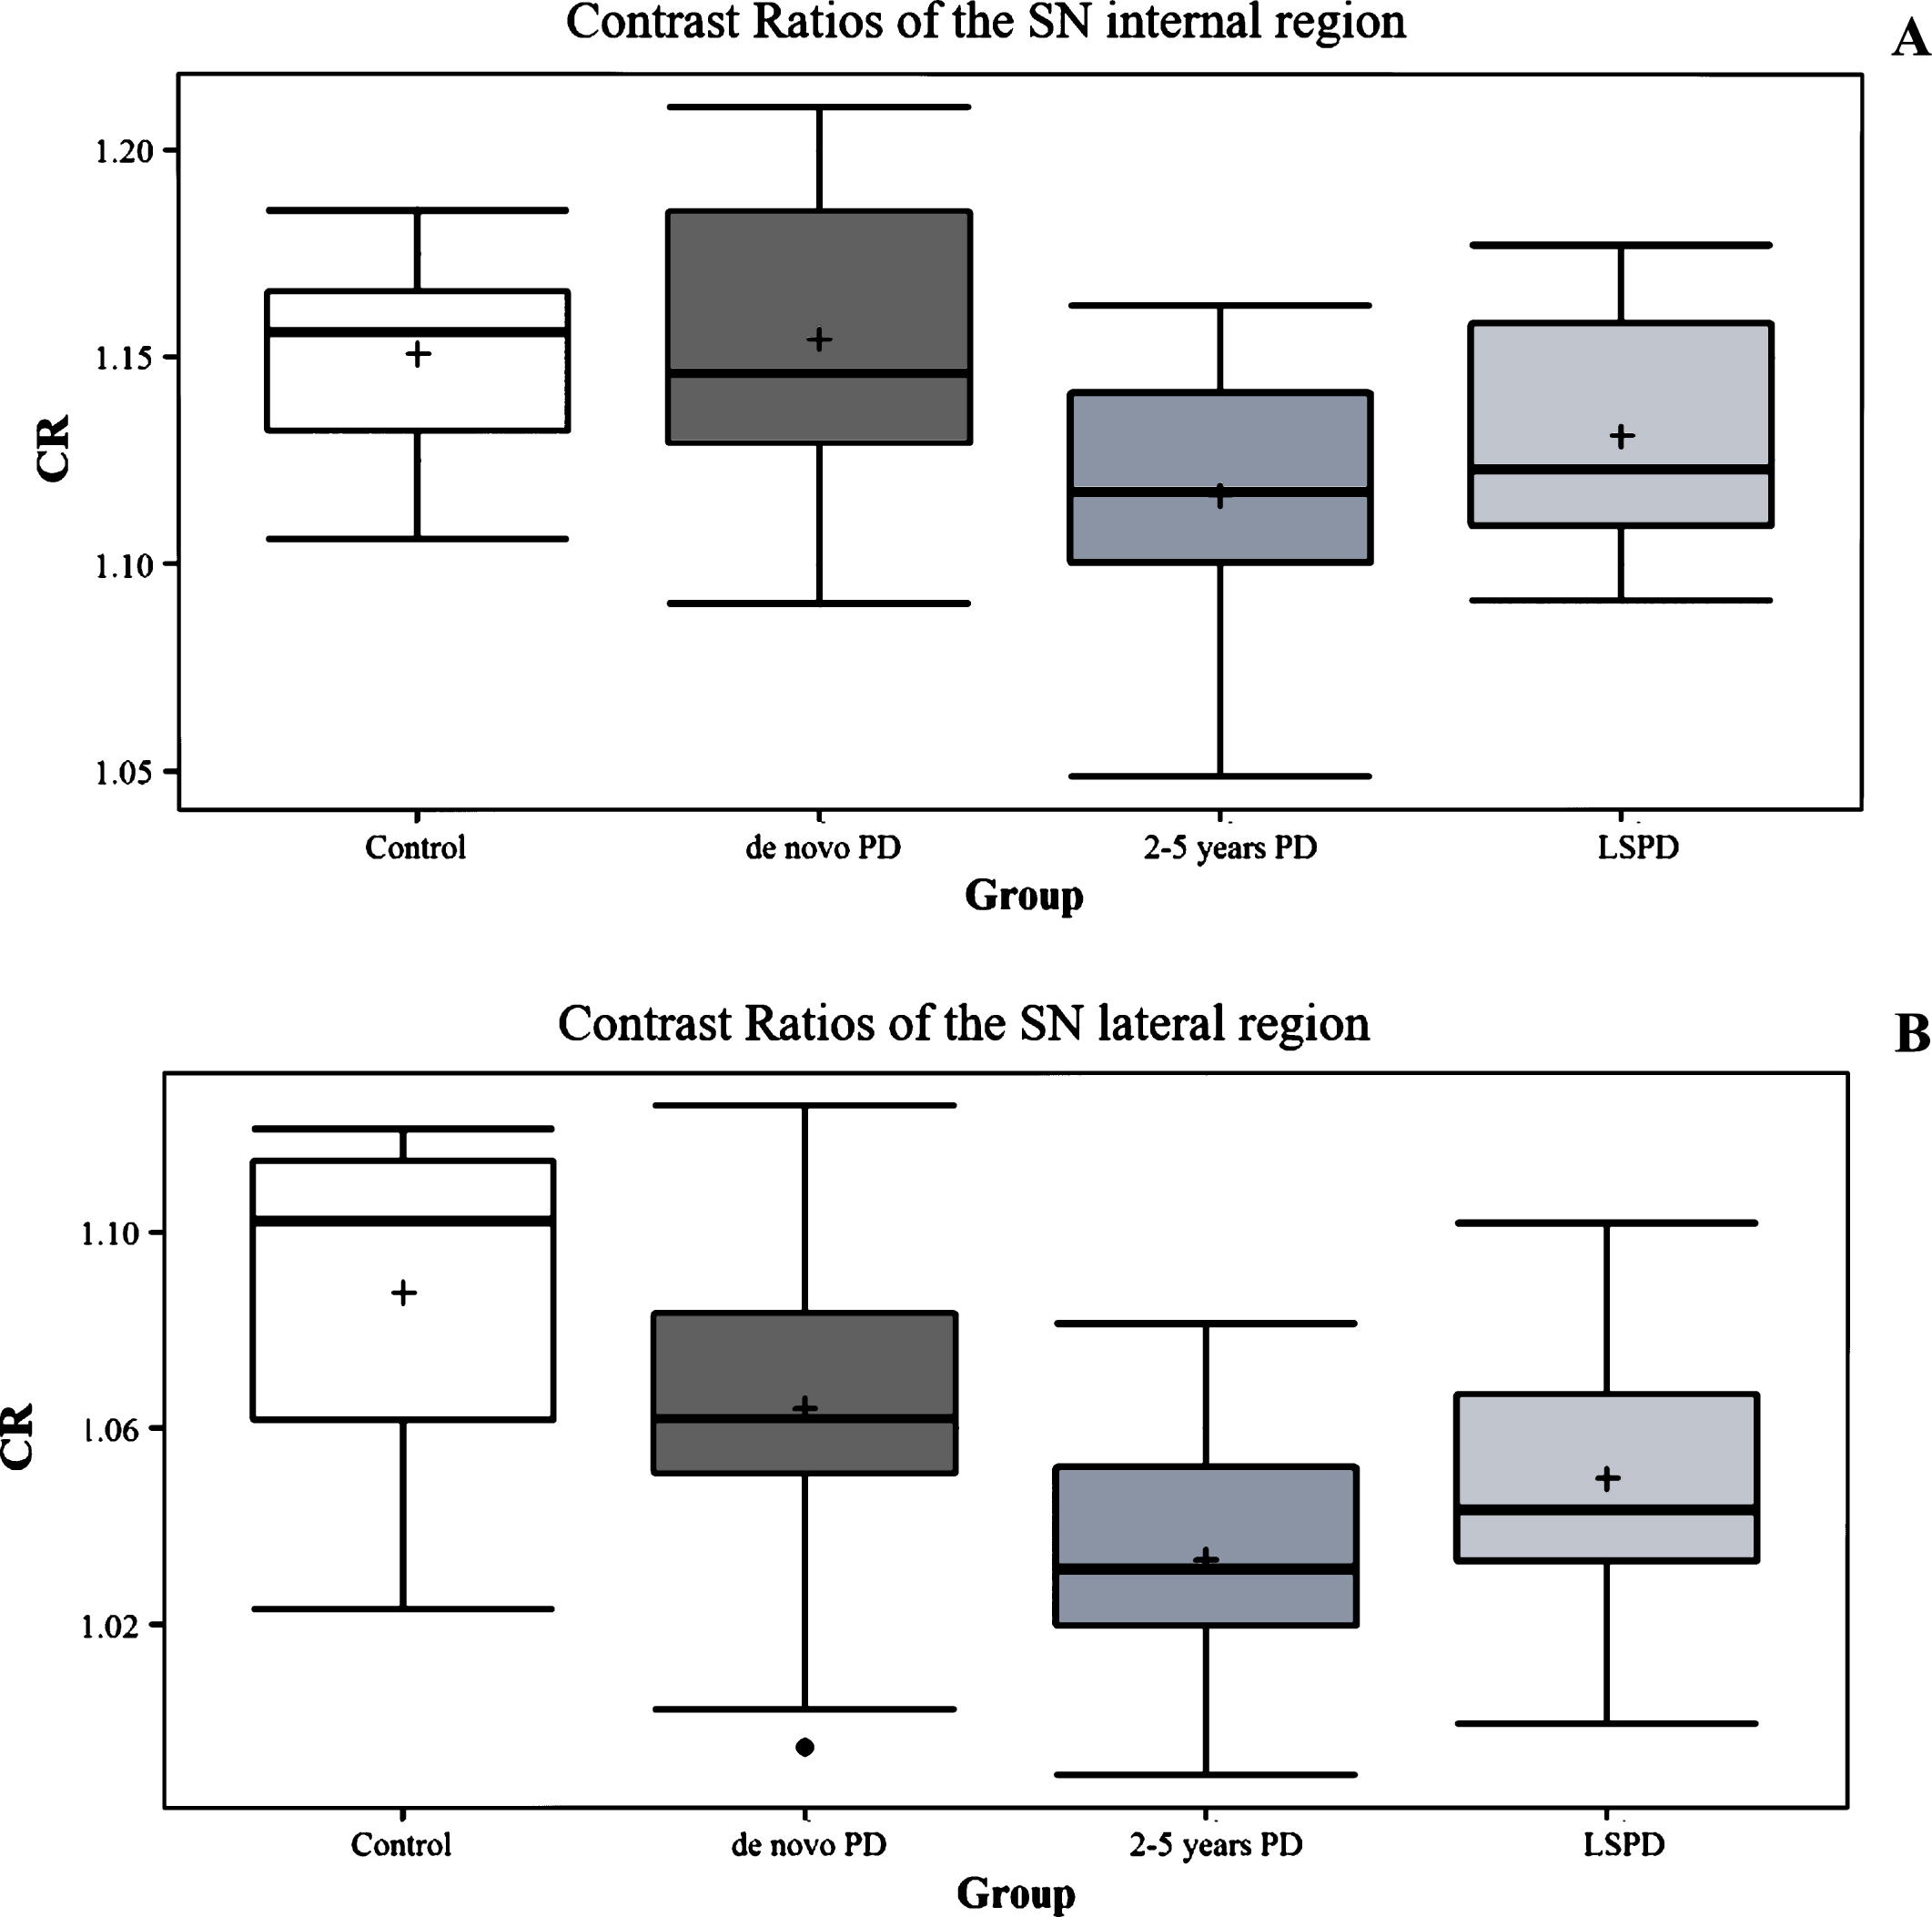
CR values in in de novo PD patients, 2–5 year PD patients, LSPD patients and controls for the SN internal region (A) and lateral region (B).
No statistically significant differences were found for the MBF across all groups (global P: 0.2) and no correlation was found between MBF and SN-NM area (R = 0.14; P = 0.37).
No significant correlation was detected between SN-MN mean area and CR of the internal region (CRi) (R = 0.33; P = 0.054) and the CR of the lateral region (CRl) (R = 0.3; P = 0.08).
Considering all PD groups, MDS-UPDRS part III showed no correlation with SN-NM area (R = –0.26; P: 0.1). Negative moderate correlations were found between the SN-NM area and the MDS-UPDRS part II (R = –0.4; P < 0.05), LEDD (R = –0.45; P < 0.05) and HY (R = –0.37; P < 0.05). No correlation was found between age and NM area values.
A moderate correlation was found between age and CRl (R = –0.42; P < 0.05) and CRi (R = –0.36; P < 0.05). No correlations were found between HY, MDS-UPDRS part II, MDS-UPDRS part III, LEDD and CRl or CRi.
DISCUSSION
In the present study, we were able to identify a significant reduction in the NM-SN area compared to controls among several groups of PD patients belonging to different disease stages, i.e. from a very early stage up to LSPD. This is consistent with a tendency for NM depletion with disease progression.
Our results also confirm the ability of NM-MRI related measures for differentiating PD patients from healthy controls with high accuracy, even in the early disease stages, as reported in previous studies [8, 17].
The main objective of our study was to investigate NM-MRI alterations in an LSPD sample, to see the NM changes with disease progression and its potential as a biomarker of disease progression in PD. The NM-SN area presented a tendency to decrease with progressive disease stages, with statistical differences between de novo PD and LSPD patients. Furthermore, setting a cut-off value at 26.31 mm2, we found excellent sensitivity, specificity, and AUC values for differentiating de novo PD and LSPD patients (75%, 92% and 0.86, respectively). There are very few studies that have explored NM-area modifications in PD evaluating early, intermediate and advanced PD stages (from HY stage 1 to 4) and all included small sample sizes. These studies reported conflicting results, although the use of different imaging and analysis protocols may partly account for these differences [12, 25]. Indeed, in a previous report we found no differences in SN area or length when comparing de novo PD with 2–5 year PD patients [12]. A few other reports suggest a tendency for SN-NM area reduction with disease progression: Schwarz and colleagues observed a tendency for a decrease in NM area when comparing six PD patients with HY stages 1–1.5 with four PD patients with HY stages 2-3 [15]. While Aquino and colleagues observed differences in NM area between twenty-two 3–5 year PD and twenty 6–10 year PD patients (HY stage <3) [25]. Finally, a recent study by Matsuura and colleagues reported longitudinal changes in NM-SN area in a group of fourteen PD patients, suggesting a decline of approximately 17.5%, after one year follow-up, concomitant with an aggravation of HY stage (from a range of 1–3 to 2–4) [16]. However, to the best of our knowledge, this is the first study in which SN-NM area is specifically examined in a population of LSPD patients. Our findings are in agreement with the report of apparent disease stage- and duration-dependent volume loss of the SN-NM-sensitive region as reported in a manual NM volume analysis, performed on PD patients presenting HY stages 1 to 5 [8]. An age-related bias on NM area reduction among our sample of LSPD patients cannot be excluded, as those patients were statistically older when compared to de novo PD ones. However, a correlation with age was found only for CR values and not for NM area values. In the current literature there is no consensus on the loss of pigmented neurons during normal aging [26–28]. Nevertheless, throughout a sensitive and specific biochemical quantification of NM, we know that in the SNc this pigment linearly increases with age from the 10th year up to the ninth decade of life. [26, 29]. Moreover in normal ageing the fallout of pigmented neurons has a very low rate, i.e. 4.7% per decade [3]. Taken as a whole, our findings on NM area reduction among LSPD patients do not seem to be significantly influenced by age and are more likely accounted for by a stage-dependent modification as opposed to an age-dependentfactor.
Though the MDS-UPDRS part III score showed no significant correlation with SN area depletion, we found a negative significant correlation of SN area with other indicators of disease severity, i.e. MDS-UPDRS part II and HY. Such a correlation is in agreement with our finding of NM area stage-dependent depletion, as suggested in a few other studies [14, 17]. The absence of a significant correlation between MDS-UPDRS part III and SN area depletion can be accounted for by the relatively high MDS-UPDRS-III scores of our de novo PD sample, probably linked to the medication-free condition of those patients and with the high frequency of tremor dominant type (11 over 12) [6]. Moreover, as showed in previous studies, the activities of daily life subscore, i.e. the MDS-UPDRS part II, may be a better biomarker of disease progression than other MDS-UPDRS sections [30–32].
To evaluate the possible impact of a midbrain volume reduction in PD patients which could have influenced NM measurements, the MBF was calculated for each group. As expected, the midbrain volume was similar between the groups and the calculated MBF showed no correlation with NM area depletion, confirming that individual midbrain volume does not explain the reduction of NM in PD [12].
Concerning the CR assessment, although a statistically significant difference was observed when comparing PD patients to controls, and a there was a tendency for CR decrease with disease progression, a small and non-statistically significant increment in CR was observed for the LSPD group compared to the 2–5 year PD group. Even if LSPD patients had a clearly worse clinical condition and longer disease duration when compared to 2–5 year PD patients, they were taking a significantly higher levodopa dose. Dopamine and dopamine agonists in standard dosages do not markedly affect DaT binding. A recent study found a correlation of the CR of the SNc and LC with DAT binding values [33]. Interaction between NM-SN signal and dopaminergic therapy is currently unknown but its influence cannot be excluded.
The pattern of pigmented neuron loss of the SN follows an opposite trend comparing PD patients with normal ageing to that observed for CR, with a greatest neuronal loss in PD (45% loss in the first decade), principally affecting the ventro-lateral part of the SN which is relatively spared in controls [3]. Accordingly, comparing healthy subjects with PD patients, we found a significant reduction of CR only in the lateral SN part. Those data suggest that CRl could be more appropriate than CRi in differentiating PD patients from healthy subjects. A few other studies on NM-CR in PD patients have reported heterogeneous results. Indeed, Ohtsuka and colleagues reported a NM-CR diminishing in the lateral-central part of SNc and LC in early (HY stage 1-2) and advanced (HY stage 3–5, during MED OFF) PD patients, compared to controls, but equally observed no difference between early and advanced patients, which is consistent to results from Schwartz and colleagues [15], however, no LEDDs were reported in either paper [17]. Conversely, Matsuura and colleagues reported a CR reduction during one-year follow-up observation with a correlation between CR values and disease duration, in spite of a LEDD increasing from about 380 mg to 630 mg [16]. Moreover, CR values did not show a significant correlation with indicators of disease severity (HY), further confirming that its alterations are not clearly coupled with disease progression [16] thereby suggesting that other confounding factors should be identified. Myoshi and colleagues found a stage-dependent CR reduction in the medial part of SNc, comparing 1-2 HY PD patients with 3–5 HY ones [34]. Taken as a whole, even if CR of SNc should give a measure of the density of melanized neurons, its relationship with disease progression in PD remains to be clarified. Finally a greater signal attenuation on NM imaging has been found in the LC when compared to SNc among PD patients [7, 17], though no difference between early and advanced PD patients were found even in the CR of the LC [7, 17].
A potential source of signal variability is the inhomogeneity in the B1 field, particularly relevant at 3.0T, which is known to affect image contrast. This effect should be accounted for in future studies, performing bias field correction prior to CR evaluation [35]. Future work should include assessing the variability in measured signal intensity and estimated NM-area associated to the acquisition and segmentation procedures. To assess the former, the acquisition procedure should be repeated after patient repositioning.
Several neuroimaging techniques, such as [18F]fluorodopapositron emission tomography (PET), [11C]dihydrotetrabenazinePET, [123I]beta-carbomethoxy-3beta-(4-iodophenyl) tropane single photon emission CT (DAT-SPECT), and [18F]fluorodeoxyglucose PET, have been proposed as markers for nigral abnormalities, disease progression or clinical characteristics for PD [36, 37]. For instance, longitudinal studies have shown an annual rate of reduction in striatal DAT uptake of 6–13% in PD patients [38, 39]. However, these examinations are invasive, expensive, and there is still uncertainty on whether there is an interaction between results and therapeutic intervention outcomes. For this reason, these neuroimaging techniques are not commonly used for routine diagnosis or follow-up of PD patients. Moreover, a very recent study has shown a correlation between striatal DAT density, as measured by DAT-SPECT, and SN-NM volume loss [33]. On the other hand, transcranial ultrasound has also been shown to detect increased echogenicity in the SN in PD as an indirect measure of neuronal loss [40], but this technique is limited by the requirements of a good temporal bone window and its ability in tracking disease progression is still unclear. Recently the loss of the “swallow tail” in the dorsolateral SN as observed at high resolution 3T –SWI MRI has been proposed as an in vivo diagnostic biomarker for nigral degeneration in PD [14]. However even if such a radiological assessment yielded a high diagnostic accuracy (sensitivity 100%, specificity 95%), no longitudinal studies have investigated its modification with disease progression.
Our study has several limitations namely the small number of patients in each group and the cross-sectional nature with no longitudinal follow-up. On the other hand, our results clearly show a significant NM signal area reduction in PD patients compared to controls and a tendency for an NM area decrease along with disease progression. These findings are consistent with previous reports and validate the consistency of our results. Due to the small number of patients we were not able to investigate the age-related effect on NM area reduction throughout other statistical techniques (stratification nor regression model). However, no correlation was found between age and area, suggesting a more probable role of disease stage on NM area reduction. NM-MRI has also several technical characteristics that have to be considered when evaluating the feasibility of performing related imaging studies. It requires a long acquisition time, and the images suffer from relatively low spatial resolution, in-plane signal inhomogeneity and not all image analysis processes are completely automated, although few operator-dependent steps are required. Moreover, motion artifacts during image acquisition and partial volume effects may deteriorate the quantitative nature of the analyses. Nevertheless, we succeeded in performing MRI on all subjects without problems, obtaining good quality images and semi-automated analysis was possible for all patients. Finally there have been, so far, no reproducibility studies of NM-sensitive MRI. However, there have been up to now several studies using this specific sequence with different equipment and the obtained results are similar in terms of the identification of SN changes in PD patients [15, 25], which is strongly supporting sequence reliability.
Conclusions
In the present study, with semi-automated MRI measures, we detected a stage-dependent progressive decrease in the SN-NM area of PD patients. A marked SN-NM area decrease occurred in parallel with other markers of disease severity. Our findings suggest that NM-sensitive MRI could be used as a potential biomarker for nigral degeneration and disease progression in PD patients. Furthermore, to the best of our knowledge, this is the first study that observed SN-NM area modifications in a sample of LSPD patients, allowing an assessment of the modifications of NM signal in very late disease stage. CR values, although showing a tendency for a decrease with disease progression, presented a slight, albeit not significant, increase in the LSPD group; its interaction with therapeutic intervention and its modifications with disease progression needs further investigation.
Further longitudinal studies on a larger population and the use of consensus acquisition and analysis protocols are warranted in order to replicate our results, verifying if SN-NM area can measure PD patients’ progression and if it could be considered as a disease progression imaging biomarker in clinical trials.
CONFLICTS OF INTEREST
The authors declare that there are no conflicts of interest relevant to this work.
FINANCIAL DISCLOSURES FOR PREVIOUS 12 MONTHS
Dr. Margherita Fabbri reports no additional disclosures.
Prof. Sofia Reimão reports no additional disclosures.
Miguel Carvalho reports no additional disclosures.
Prof. Rita G Nunes was funded by the Portuguese Foundation for Science and Technology (IF/00364/2013).
Daisy Abreu reports no additional disclosures.
Leonor Correia Guedes reports no additional disclosures.
Raquel Bouça reports no additional disclosures.
Patricia P Lobo reports no additional disclosures.
Prof. Miguel Coelho reports no additional disclosures.
Catarina Godinho reports no additional disclosures.
Prof. Angelo Antonini: no conflict of interest to report. Stock Ownership in medically-related fields: none; Consultancies: AbbVie, UCB, Zambon, Angelini Advisory Boards: AbbVie, Acadia; Partnerships: none; Honoraria: Lundbeck, Mundipharma, GE, UCB, Zambon, Medtronic; Grants: Neureca Foundation, Mundipharma, Horizon 2020 Project No 643706; Intellectual Property Rights: none; Expert Testimony for Boheringer Ingelheim in pathological gambling cases; Employment: none; Contracts none
Royalties none; Other: Patent WO2015110261-A1 An in vitro method of diagnosing Parkinson’s disease;
Prof. Joaquim J. Ferreira: no conflict of interest to report. Stock Ownership in medically-related fields: none; Consultancies: Ipsen, GlaxoSmithKline, Novartis, Teva, Lundbeck, Solvay, Abbott, BIAL, Merck-Serono and Merz; Advisory Boards: none; Partnership: none; Honoraria to speak: none; Grants: GlaxoSmithKline, Grunenthal, Teva and Fundação MSD; Intellectual Property Rights: none; Expert Testimony: none; Employment: Laboratory of Clinical Pharmacology and Therapeutics of Lisbon; Contracts: none; Royalties: none; Other: none.
Footnotes
ACKNOWLEDGMENTS
The authors thank Anne-Marie Williams for editorial assistance (English language editing and referencing).