
Abstract
Background:
Although there is evidence of shared dysregulated pathways between diabetes and Parkinson’s disease, epidemiologic research on an association between the two diseases has produced inconsistent results.
Objective:
We aimed to assess whether known metabolomic markers of insulin resistance and diabetes are also associated with Parkinson’s disease development.
Methods:
We conducted a nested case-control study among Nurses’ Health Study and Health Professionals Follow-up Study participants who had provided blood samples up to twenty years prior to Parkinson’s diagnosis. Cases were matched to risk-set sampled controls by age, sex, fasting status, and time of blood collection. Participants provided covariate information via regularly collected cohort questionnaires. We used conditional logistic regression models to assess whether plasma levels of branched chain amino acids, acylcarnitines, glutamate, or glutamine were associated with incident development of Parkinson’s disease.
Results:
A total of 349 case-control pairs were included in this analysis. In the primary analyses, none of the metabolites of interest were associated with Parkinson’s disease development. In investigations of the association between each metabolite and Parkinson’s disease at different time intervals prior to diagnosis, some metabolites showed marginally significant association but, after correction for multiple testing, only C18 : 2 acylcarnitine was significantly associated with Parkinson’s disease among subjects for whom blood was collected less than 60 months prior to case diagnosis.
Conclusions:
Plasma levels of diabetes-related metabolites did not contribute to predict risk of Parkinson’s disease. Further investigation of the relationship between pre-diagnostic levels of diabetes-related metabolites and Parkinson’s disease in other populations is needed to confirm these findings.
INTRODUCTION
A link between Parkinson’s disease (PD) and diabetes was originally suggested by the observation that individuals with PD frequently have impaired glucose tolerance [1], and was later supported by the discovery that dysregulated pathways related to mitochondrial biogenesis and respiration may play a role in the pathophysiology of both diseases [2]. The results of epidemiological studies, however, have been inconsistent. A significant increase in PD risk among individuals with type 2 diabetes has been reported in a cohort in Finland [3], in registry-based studies in Denmark [4] and Taiwan [5], a record-linkage study in the UK [6], and in two cohorts in the U.S. [7, 8], but not in other large longitudinal studies [9, 10]. Although the reason for these inconsistent results is unclear, it is possible that the relationship between diabetes and PD is modified by other factors, such plasma uric acid [11].
Metabolomics studies suggest that altered plasma levels of some metabolites may be associated with insulin resistance and diabetes. For example, in a nested case-control study in the Framingham Offspring Study, elevated plasma levels of branched chain amino acids (BCAAs), including isoleucine, leucine, and valine, were be associated with incident diabetes up to 12 years prior to diagnosis [12]; these findings were replicated in subsequent analyses in the Framingham Heart Study and the Malmö Diet and Cancer Study [13]. Altered, often elevated, levels of a variety of plasma acylcarnitines, including short-, medium-, and long-chain acylcarnitines, have been linked in various investigations with both prevalent [14–16] and incident diabetes [17]. Similarly, plasma glutamate and glutamine levels have been linked with diabetes: high plasma glutamate, low plasma glutamine, and a low ratio of glutamine to glutamate have each been linked with insulin resistance and diabetes in the Framingham Heart Study and Malmö Diet and Cancer Study [13] as well as in the PREDIMED trial [18].
Aside from their associations with diabetes and insulin resistance, each of these metabolites could also affect nervous system functioning. Branched chain amino acids, for example, have been linked with other neurodegenerative diseases, including amyotrophic lateral sclerosis [19] and Huntington’s disease [20, 21]. Acylcarnitines, which are related to mitochondrial function and beta-oxidation of fatty acids, are involved in a number of functions in the brain, including not only mitochondrial function, but also lipid synthesis, altering and stabilizing membrane composition, and increasing antioxidant activity [22]. Plasma levels of glutamate are associated with smoking [23], a strong risk factor of PD [24], and plasma levels of glutamate were found to be decreased in PD cases relative to health controls in a small cross-sectional study [25]. Given the relationships between these metabolites and diabetes, the biological and epidemiological links between diabetes and PD, and the potential for each of these metabolites to influence nervous system functioning, it is plausible that these metabolites might also play a role in PD pathophysiology. To investigate this possibility, we report here a nested case-control study of the association between plasma BCAA, glutamate, glutamine, and acylcarnitine levels with incident PD.
METHODS
Study population
This investigation uses data and blood samples from participants in the Nurse’s Health Study (NHS) and the Health Professional’s Follow-up Study (HPFS). The NHS consists of 121,700 female registered nurses who were aged 30–55 and residing in one of eleven states at the time of enrollment in 1976. The HPFS consists of 51,529 male health professionals who were aged 40–75 and completed a baseline questionnaire in 1986. Participants in both cohorts complete biennial follow-up questionnaires, which include questions regarding lifestyle practices, diet, and medical history. Between May 1989 and September 1990, blood samples were collected using heparin tubes and processed for 32,825 NHS members [26]. Blood samples were similarly collected from 18,018 HPFS participants between April 1993 and August 1995 using liquid EDTA tubes [27]. The study protocol was approved by the Institutional Review Boards of the Brigham and Women’s Hospital and the Harvard T.H. Chan School of Public Health.
Case ascertainment and control selection
Incident PD cases are identified through the cohorts’ self-report questionnaires. Following a participant’s first report of PD, we request permission to contact their neurologist and/or obtain copies of their medical records. Prior to 2003, cases were confirmed if the treating medical professional considered the diagnosis definite or probable, or the medical record indicated at least two of the cardinal signs of PD (resting tremor, rigidity, bradykinesia). Since 2003, the case ascertainment procedure has been modified such that medical records are requested from all cases and these records are reviewed by a movement disorders specialist. This investigation includes 349 incident cases of confirmed PD with PD diagnosis occurring after (n = 328 cases) or shortly before (n = 21 cases) blood collection. Each case was matched to a risk set sampled control based on cohort, age (within one year), and month and time of blood collection (within one month), fasting status at blood collection (fasted: 8≤hours since last meal), and race (white versus non-white).
Metabolite profiling
Participants’ blood samples were collected as described previously [28]. Briefly, participants arranged to have their blood collected and shipped the samples with an icepack in a Styrofoam container overnight to our laboratory. In both cohorts, over 95% of samples arrived within 26 hours of blood draw [29, 30]. Upon arrival at our lab, samples were centrifuged and divided into aliquots of plasma, white blood cell, and red blood cell components and then stored in the vapor phase of liquid nitrogen freezers at less than – 130°C. Following selection into this study, plasma samples were randomly ordered and shipped on dry ice to the Broad Institute for metabolomics profiling. Plasma samples from each matched pair were handled identically and assayed in the same batch. Within matched pair, samples were randomly ordered to ensure that all assays were conducted without knowledge of case-control status. Although there is debate about the influence of different collection tubes in metabolomics investigations, with some indicating that anticoagulant type may or may not have an effect [31–35], a reproducibility study in our cohorts [28] suggested little difference for most metabolites, particularly lipid and lipid-related metabolites. Because cases and controls were matched within cohort such that there can be no systematic differences in tube type between cases and controls in our investigation, we do not anticipate that use of heparin tubes in the NHS versus EDTA tubes the HPFS will introduce any systematic bias.
The metabolites were profiled at the Broad Institute (Cambridge, MA). All metabolites examined in this study were profiled using hydrophilic interaction in the positive ionization mode (HILIC-pos), as has been previously described [36]. Briefly, profiling on the HILIC-pos platform is conducted using a liquid chromatography-mass spectrometry (LC-MS) system composed of a Shimadzu Nexera X2 U-HPLC (Shimadzu Corp) coupled with a Q Extractive hybrid quadrupole orbitrap mass spectrometer (Thermo Fisher Scientific). Plasma samples (10μL) were prepared via protein precipitation, centrifuged, and then the supernatant was injected directly into the 150x2, 3-μm Atlantis HILIC column (Waters). Full scan mass spectroscopic analyses (70–800 m/z at 70,000 resolution and 3 Hz acquisition rate) were conducted using electrospray ionization in the positive ion mode. Reference standards of each metabolite were used to determine chromatographic retention times and MS multiple reaction monitoring transitions, declustering potentials and collision energies for the polar metabolite profiling methods.
Covariate assessment
Information on lifestyle practices and medical history is collected biennially by self-report questionnaires in the NHS and the HPFS, which have been extensively validated [37–42]. Similarly, dietary data is collected every four years by self-administered semiquantitative food frequency questionnaires (FFQ) in both cohorts, which captures average intake pattern of food and beverage during the 12 months preceding FFQ completion. For these analyses, we used covariate information from the last questionnaire cycle prior to beginning of blood collection for each cohort. In the NHS, this means that we used lifestyle practice and medical history data from the 1988 questionnaire cycle and diet information from the 1986 FFQ. In the HPFS, lifestyle practice and medical history data was used from the 1992 questionnaire and dietary data from the 1990 FFQ. When a participant was missing data on a given covariate, the value observed from the preceding questionnaire cycle was carried forward. Missing value indicators were used if the value from the preceding questionnaire cycle was also missing and could not be carried forward.
Statistical analyses
Among the metabolites of interest, 26 of 29 were detected in all samples. For the remaining 3 metabolites, C4-OH, C3-DC-CH3, and C7 acylcarnitines, missingness was rare: only 0.3%, 0.4%, and 7.8% of samples had missing values, respectively. In samples with a missing value for these carnitines, the missing value was replaced with half of the minimum of non-missing values observed within cohort. The coefficient of variation was calculated based on QC samples to assess inter-assay reproducibility of each metabolite. Metabolite values were log-transformed and, within cohort, standardized to the values of the control distribution. Paired t-tests were used to compare mean log-transformed and standardized metabolite values between cases and controls.
For each metabolite, we conducted conditional logistic regressions stratified on matched pair to estimate the rate ratio (RR) and corresponding 95% confidence interval. Each log-transformed and standardized metabolite value was modelled both continuously, to obtain the RR per standard deviation (SD) increase in metabolite value, as well as categorically using quartiles defined by the within-cohort control distribution, to obtain the RR comparing each of the higher quartiles to the lowest quartile. In the quartile-based analyses, we conducted additional conditional logistic regression models using the median value of each quartile to test for linear trend.
For both the continuous and quartile-based approaches, a set of models were estimated with increasing control for potential confounders, including fasting status (fasted: 4 + hours since last meal prior to sample collection), pack year category (never smoker, 0–9.9 pack years, 10–19.9 pack years, 20–29.9 pack years, 30 + pack years), cumulative average caffeine intake (mg/day) quartile (defined by within-cohort distribution), BMI category (<23, 23–24.9, 25–26.9, 27–29.9, 30 + kg/m2), log-transformed and standardized plasma uric acid level, and baseline history of diabetes (defined using positive initial self-report on cohort questionnaire and completion of secondary questionnaire with positive report of one of the following: one or more classic symptoms (excessive thirst, polyuria, weight loss, hunger, pruritus, or coma) plus fasting plasma glucose of 126 mg/dl or more or random plasma glucose of 200 mg/dl or more; at least two elevated plasma glucose levels on different occasions in the absence of symptoms; or treatment with hypoglycemic medication (insulin or oral hypoglycemic agent)). To test whether the association between each metabolite and PD varied with time between blood collection and diagnosis, we introduced an interaction term between metabolite level and time between blood collection and date of PD diagnosis (<60, 60–179, or 180 + months). Multiple testing was accounted for by calculating the false discovery rate (FDR) adjusted p-value using the Benjamini-Hochberg approach.
To investigate the association between groups of similar metabolites and PD, we calculated summary scores for the following groupings, as previously defined [43, 44]: BCAAs (leucine, isoleucine, and valine; 3 species), short-chain acylcarnitines (C2carnitine-C7carnitine; 9 species), medium-chain acylcarnitines (C8carnitine-C14 : 2carnitine; 9 species), and long-chain acylcarnitines (C16carnitine-C26carnitine; 6 species). Metabolite group summary scores were calculated as the sum of the log-transformed and standardized metabolite values within each group of metabolites (‘Summary Score 1’), weighting each metabolite’s contribution to its group equally. An alternative form of the summary score (‘Summary Score 2’) was also explored by summing raw metabolite values within group prior to log-transformation and standardization, which weighted each metabolite’s contribution to the summary score by LC-MS peak size.
Sensitivity analyses were conducted to assess how robust our results were to modeling decisions. These included: excluding matched pairs for whom the case’s PD diagnosis occurred prior to blood collection, restricting to participants in specific interval length categories, excluding cases and controls with a history of diabetes, and additionally adjusting for factors such as use of diabetes medications (restricted to NHS participants; data unavailable for HPFS participants at baseline), total caloric intake, and physical activity, and more minimally adjusting for only fasting status and the interaction between metabolite and interval length category. Further, we assessed the possibility of a non-linear relationship between metabolite level and PD using restricted cubic splines models for both k = 3 and k = 4 internal knots.
All statistical analyses were performed with the use of SAS software (v9.4; SAS Institute).
Study population characteristics
aContinuous variable: mean (sd). bCategorical variable: % (n)
RESULTS
Baseline characteristics of the 698 participants included in these analyses are presented in Table 1. As expected due to matching, the age, sex, and time interval length distributions are comparable between cases and controls. The distributions of BMI and history of diabetes were also similar, but cases had fewer smoking pack-years and lower cumulative average caffeine intake than controls. The CV was less than 20% for all metabolites except for C7 carnitine (mean CV = 47.98%) and C3-DC-CH3 carnitine (mean CV = 26.80%). Cases tended to have lower values of most metabolites as compared to controls. Based on the results of paired t-tests, the mean levels of C9-carnitine (mean difference=–0.18, 95% CI: – 0.32, – 0.03; p = 0.02), C12-carnitine (mean difference=– 0.14, 95% CI: – 0.28, – 0.01; p = 0.04), and C14-carnitine (mean difference=– 0.17, 95% CI: – 0.32, – 0.02; p = 0.02) were significantly different between cases and controls (Supplementary Table 1), but these did not remain significant after adjustment for multiple testing. The distribution of the summary scores for each metabolite group followed a similar pattern; cases had lower mean values of the summary scores for each metabolite group except for the long-chain acylcarnitine scores, but these differences were not significant. To explore whether metabolite values differed between cases and controls based on length of time between blood collection and case diagnosis, Figure 1 shows the mean difference within case-control pair of log-transformed and standardized metabolite values for the BCAAs and the acylcarnitine groups; although some of these differences are nominally different from 0, none remain significant after multiple testing correction. Glutamate and glutamine, which are not included in the BCAA or acylcarnitine groupings, were also not different between cases and controls at any time point.
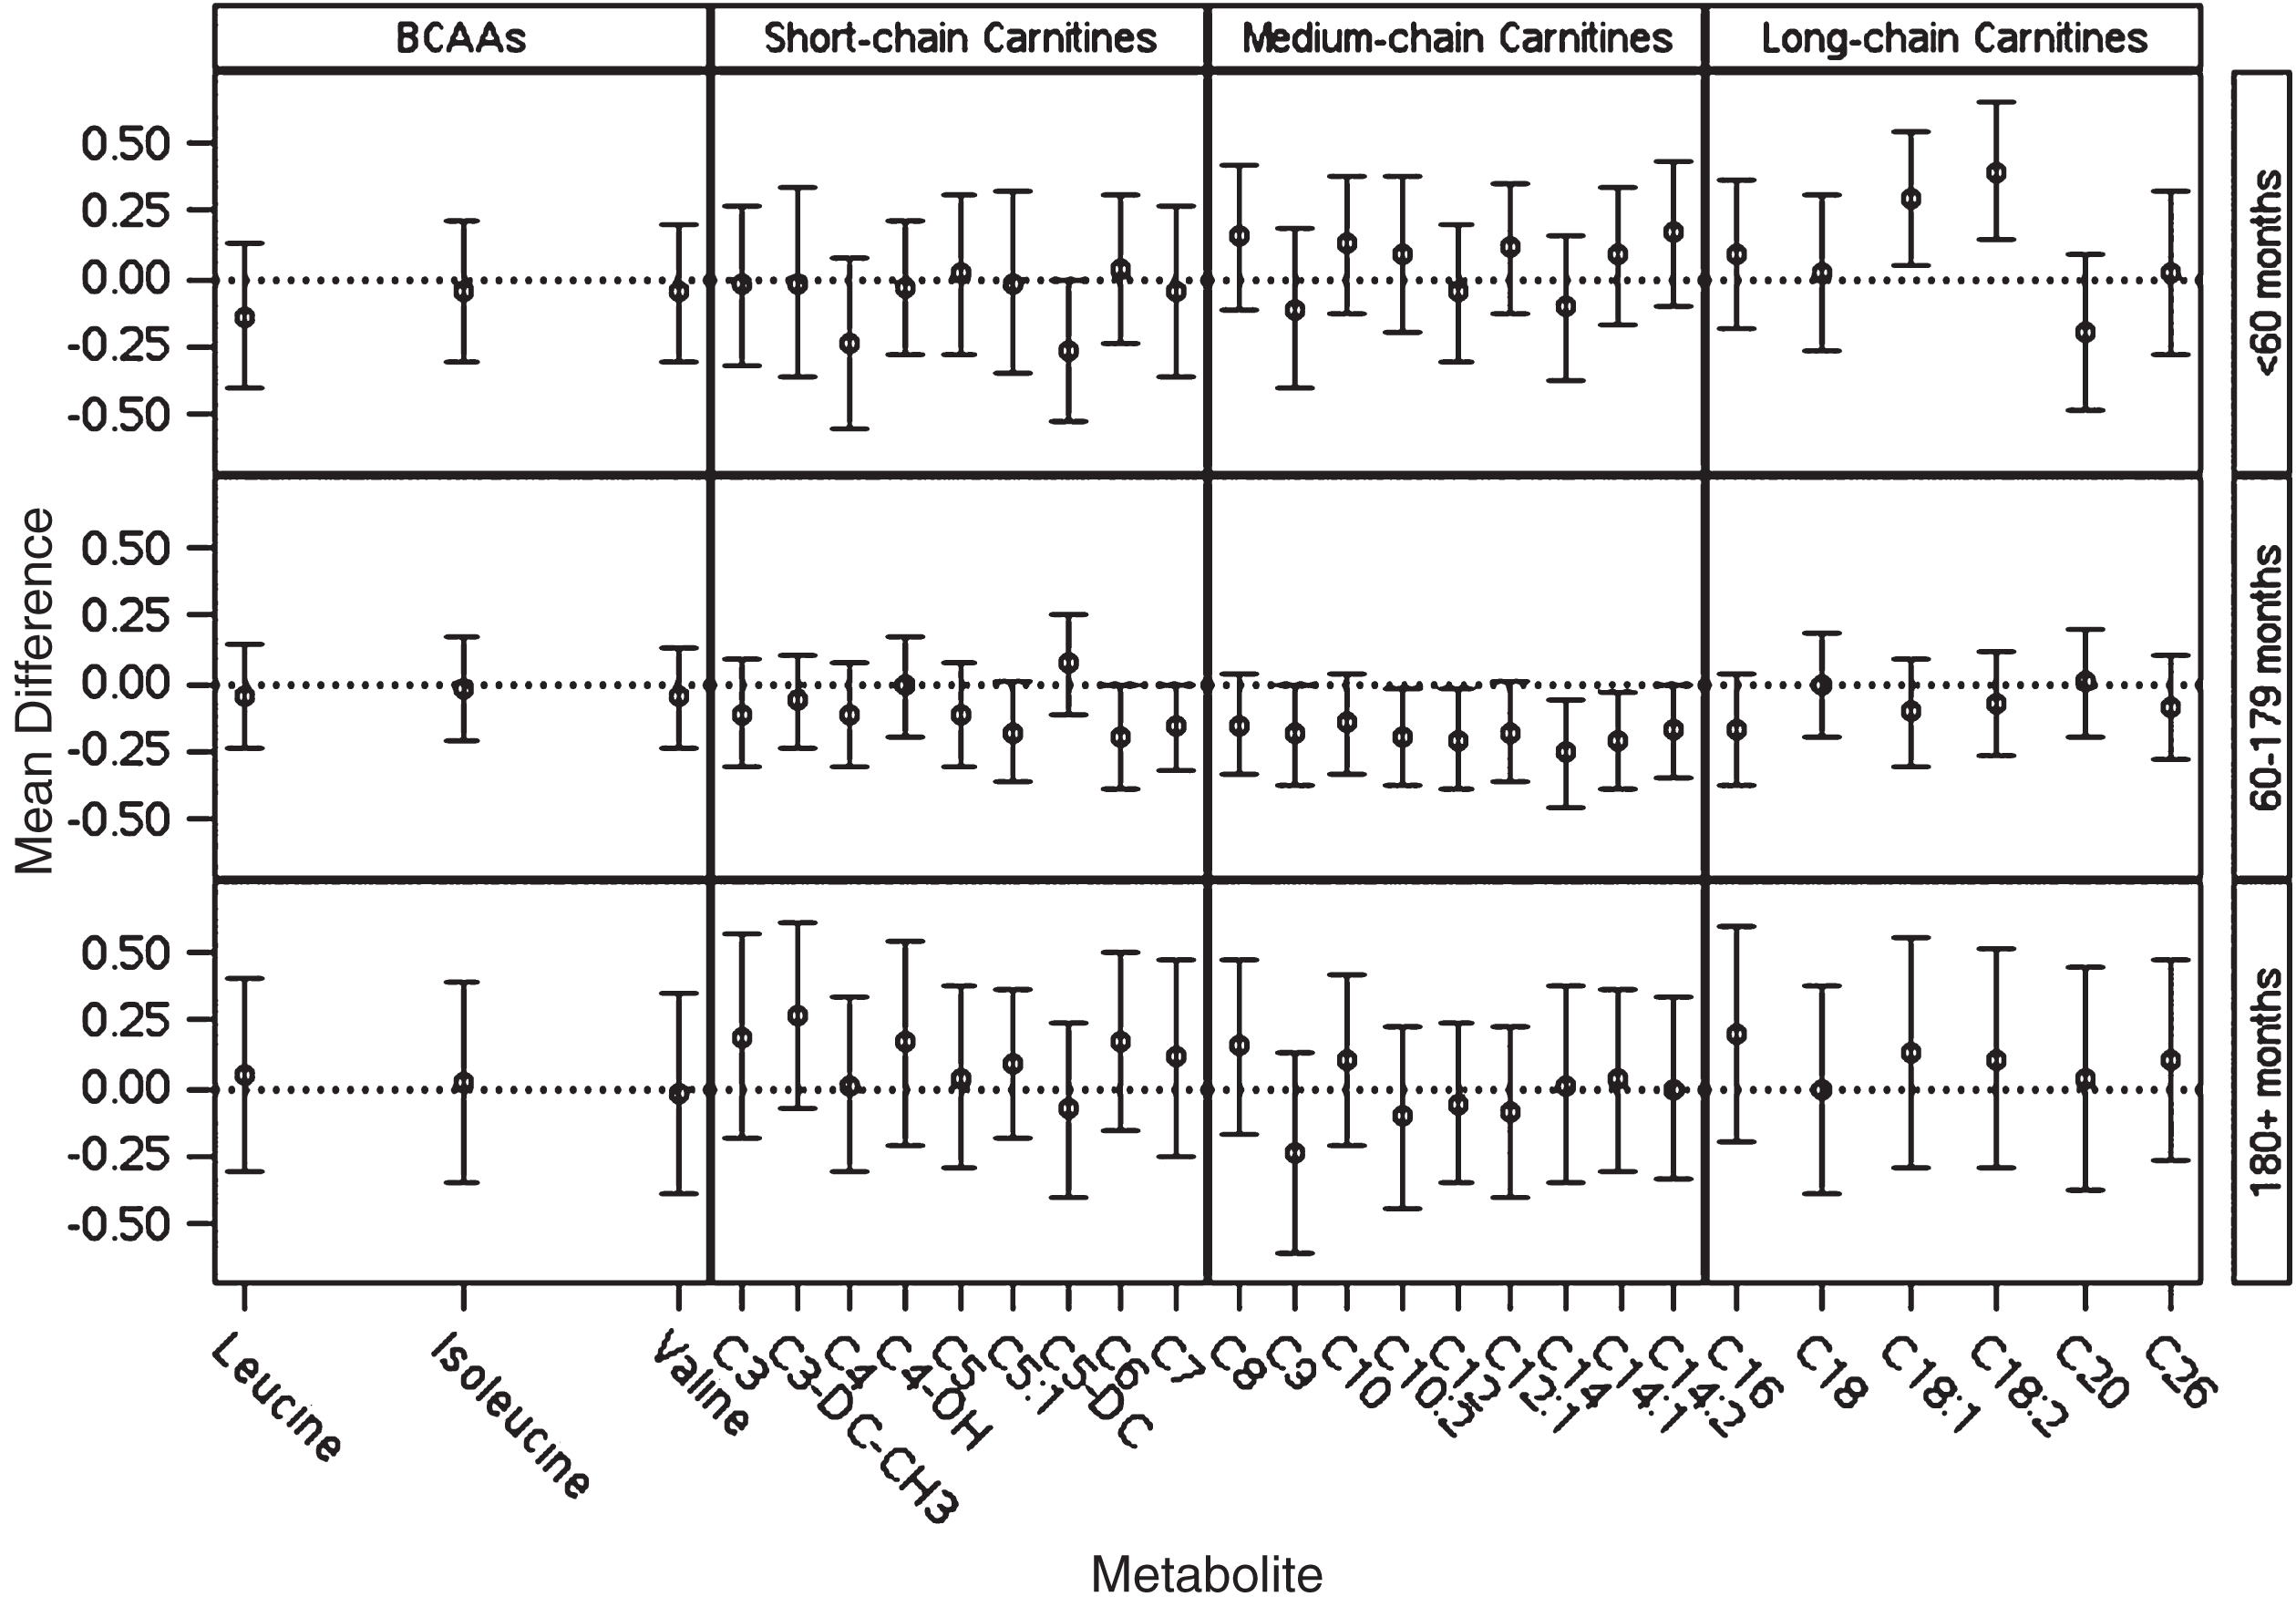
Mean differences (case-control) and corresponding 95% confidence intervals for within matched case-control pair difference in log-transformed and standardized metabolite values. No differences were statistically significant after adjustment for multiple testing.
In single metabolite regression analyses, no metabolite was significantly associated with PD in either the minimally adjusted model (Supplementary Table 2), adjusting for pack-year category, cumulative average caffeine intake quartile, and fasting status, or the more fully adjusted model (Table 2), which additionally adjusted for diabetes history, BMI category, and plasma uric acid level. Summary score analysis results for each metabolite group were similar. As shown in Table 3, there was no evidence of an association between any of the metabolite groups and PD. This finding was consistent across both forms of the summary score assessed.
Fully adjusted model results for association between individual metabolites and PD
Models adjusted for pack-year categories, cumulative average caffeine intake quartile, fasting status, baseline diabetes, BMI category, and plasma urate. Quartile-specific results from metabolite quartile models, p trend from metabolite median quartile model, per SD results from continuous metabolite value model.
Association between metabolite group summary scores and incident PD for summary score 1 and summary score 2
Minimally adjusted results adjusted for pack-year categories, cumulative average caffeine intake quartile, fasting status; fully adjusted additionally adjusted for baseline diabetes history, BMI category, plasma urate. Association per SD from continuous summary score model, p trend from median quartile model.
Including an interaction between metabolite level and time interval category indicates that, for some metabolites, there is a different association between the metabolite and PD among individuals at different time points prior to PD diagnosis. Results of these models are summarized according to metabolite group in Supplementary Tables 3–6; results for glutamate and glutamine are included in the Supplementary Table 3 with the BCAAs. In these analyses, the interaction between metabolite and time interval category contributed significantly to the median quartile-based model for the following acylcarnitines: C3-DC-CH3 (pinteraction = 0.007), C12 : 1 (pinteraction = 0.03), C14 : 2 (pinteraction = 0.03), C16 (pinteraction = 0.04), C18 : 1 (pinteraction = 0.01), and C18 : 2 (pinteraction = 0.003). In the continuous models, the interaction was significant for C8 (pinteraction = 0.04), C12 : 1 (pinteraction = 0.047), C14 : 1 (pinteraction = 0.03), C14 : 2 (pinteraction = 0.01), C18 : 1 (pinteraction = 0.01), and C18 : 2 (pinteraction = 0.01) acylcarnitines. Generally, the significance of these interactions reflects a stronger association between these metabolites and PD in a specific time category. For example, the association between C18 : 2 acylcarnitine and PD is stronger among those less than 60 months prior to diagnosis (continuous model: RR = 1.79 (1.20, 2.67)) as compared to among those further from diagnosis at the time of blood collection (60–179 months: RR = 0.85 (0.68, 1.06); 180 + months: RR = 1.04 (0.73, 1.47)). Following adjustment for multiple testing, only the association from the median quartile-based model between C18 : 2 acylcarnitine and PD among those in the shortest interval category, when cases are likely to be in the prodromal period, remained significant (FDR ptrend = 0.054), suggesting that increased level of C18 : 2 acylcarnitine is associated with increased rate of developing PD. Results from models restricted to individuals in a given interval category were comparable to those obtained by incorporating the interaction between interval category and metabolite level.
In models for the association between each metabolite group summary score and PD that included an interaction term between metabolite group summary score and interval category, the interaction was significant for models of both forms of the medium-chain acylcarnitines score in the continuous model (Summary Score 1 pinteraction = 0.04; Summary Score 2 pinteraction = 0.04) and long-chain acylcarnitine Summary Score 2 in the continuous model (pinteraction = 0.03). The results of these models are summarized in Supplementary Tables 3–6 by metabolite group, and, consistent with the single metabolite results, none of the associations between metabolite summary score and PD within interval category are significant after correction for multiple testing except for the association between the long-chain acylcarnitine Summary Score 2 and PD among individuals in the shortest interval category of the quartile-based model (FDR ptrend = 0.048), likely reflecting the association between C18 : 2 acylcarnitine and PD among individuals in this interval category.
Results did not change substantially when time interval was modelled continuously, when further adjustment was made for use of diabetes medications, total caloric intake, or physical activity, or when models were more minimally adjusted for only fasting status. Exclusion of matched pairs for whom the case’s PD diagnosis occurred shortly before blood collection yielded similar results. Similarly, exclusion of subjects with diabetes at baseline did not substantially alter any findings. In exploring two sets of restricted cubic splines models with knots placed at the 10th 50th and 90th percentiles of the data (k = 3 internal knots) as well as models with knots placed at the 5th, 35th, 65th, and 95th percentiles of the data (k = 4 internal knots), the results were similar to those obtained in the quartile-based analyses described above.
DISCUSSION
In this nested case-control study, we found no evidence that BCAAs, glutamate, glutamine, or acylcarnitine metabolites, all markers of insulin resistance or diabetes,[12–16] act as risk factors of PD development either individually or in groups. Exploration of effect modification of the relationship between each metabolite and PD by time between blood sample collection and PD diagnosis revealed that some metabolite levels may be altered at different times prior to PD diagnosis, but that no metabolite was consistently altered across each time interval assessed. Following multiple testing adjustment, no metabolite was significantly associated with PD in any of our analyses except for the association between C18 : 2 acylcarnitine and PD and corresponding association between the long-chain acylcarnitine Summary Score 2 and PD among those less than 60 months from diagnosis.
Recently, there have been several investigations of metabolomics in relation to PD, including some studies [45, 46] suggesting that several of the metabolites investigated here might act as a marker of PD. Our finding that C12 and C14 acylcarnitines were nominally lower in PD cases relative to controls and nominally associated with a decreased rate of PD in adjusted regression models are similar to the results from a recent retrospective case-control investigation [46], indicating that those metabolites may be of interest despite not remaining statistically significant following multiple testing correction in our analyses. On the other hand, our finding that C18 : 2 acylcarnitine was associated with an increased rate of PD among those with a short time between blood collection and diagnosis is in direct opposition to two previous retrospective case-control studies [45, 46] that found C18 : 2 acylcarnitine was decreased among PD patients relative to controls. Although our findings conflict with these reports, several differences between our study and other studies may account for the inconsistencies. First, previous studies have included only samples from patients after disease onset and may thus be influenced by metabolic changes that are a consequence of the disease processes or of behavioral changes that might occur after diagnosis. Second, our study was nested within two large and well-characterized cohort studies and is thus less vulnerable to control selection bias, which is an important concern in studies have recruited cases from hospitals, ongoing clinical trials, and other case series that do not allow direct sampling of the source population. By conducting our investigation within these cohorts, we were also able to adjust for a variety of covariates that were prospectively measured and that are not always available in other studies. Further, our study utilized plasma samples whereas other studies have investigated metabolomics in a variety of plasma, serum, and cerebrospinal fluid samples; it is possible that the relationship between a given metabolite and PD may differ based on the sampled biofluid. In particular, the literature [47] suggests that insulin resistance in the central nervous system is most relevant for PD, it is possible that these metabolites or other markers of diabetes might have different relationships with PD when measured in CSF rather than plasma.
This investigation has several key strengths. First, there are several strengths due to the study design. As a prospective study of incident PD using blood samples collected prior to PD diagnosis, we were able to assess potential risk factors for the development of PD with little risk of reverse causation explaining our findings. Further, as the study is nested within two large cohorts, we minimized the risk of selection bias when selecting controls and ensured that there were no systematic differences between cases and their matched controls with respect to blood collection and processing. Another key strength of this study was the ability to combine metabolomics measurements with prospectively collected data on a variety of covariates, which allowed for careful control for potential confounders. Lastly, we conducted thorough sensitivity analyses to assess the robustness of our findings.
There are limitations of this study. It is possible that some of the less stable metabolites in our samples may have degraded during shipment or processing and that there may have been measurement error in the metabolite profiling procedures. Given the prospective nature of the study, the blinding of lab staff to each sample’s outcome status, the simultaneous analyses of matched pairs, and previous quality control analyses using samples from the same cohorts and metabolomics platform, the effects of such measurement error or sample degradation for most metabolites are likely to be modest and nondifferential, resulting in a possible bias towards the null [28]. An additional limitation of the study is that we have only a single measurement for each participant, which may have been collected too early in the disease course to detect an association and which may not be representative of long-term levels of these metabolites. However, the metabolomics validation study referenced above also indicated that, among participants who donated two blood samples 0.8–2.3 years apart, the correlation between measurements was greater than 0.4 for more than 90% of metabolites, suggesting a single measurement may reasonably reflect longer-term levels [28]. Another limitation of this study is that, despite the large sample size compared to previous PD metabolomics investigations, we did not have a sufficient sample size to explore additional subgroups, such as PD cases with diabetes versus PD cases without diabetes, and may be underpowered to detect effect modification, as evidenced by the wide confidence intervals in some of the stratified analyses. Due to the observational nature of the investigation and use of questionnaires, it is also possible that unmeasured or residual confounding or measurement error may be biasing our results. To mitigate these biases as much as possible, we took care to adjust for several known confounders and used well-validated instruments.
In conclusion, we did not find evidence that metabolomic markers of insulin resistance and type 2 diabetes also act as markers of pre-diagnostic PD. These findings are in concordance with previous research conducted in the NHS and HPFS that did not find an association between diabetes and incident development of PD [10]. Given that an association between diabetes and PD has not been identified in these cohorts and that there were few subjects with a history of diabetes at baseline in this specific investigation, further prospective investigation of the relationship between diabetes markers, including not only metabolomic but also other biomarkers, and PD is needed in other populations in order to establish the robustness of these findings.
CONFLICTS OF INTEREST
The authors have no conflicts of interest to report but several authors have relevant financial disclosures. Dr. Molsberry has no disclosures. Dr. Bjornevik has no disclosures. Dr. Hughes has no disclosures. Dr. Zhang has no disclosures. Dr. Healy has received research support from Merck Serono, Genzyme, Novartis, Verily Life Sciences and Analysis Group. Ms. Jeanfavre reports no disclosures. Dr. Clish reports no disclosures. Dr. Schwarzschild has within the past three years received funding from the Cure Parkinson’s Trust, CBD Solutions trust, Michael J. Fox Foundation for Parkinson’s Research (MJFF), Prevail Therapeutics and nQ Medical for serving on their scientific advisory boards; from Eli Lilly and Company for serving on a trial Data Monitoring Committee; from Biotie Therapeutics, Inc./Acorda Therapeutics, MJFF, Parkinson’s Foundation and Univ. of California-San Francisco for serving on study steering committees; and from Denali Therapeutics for presenting a seminar. He has within the past three years received research funding from the NIH, Parkinson’s (Disease) Foundation, U.S. Department of Defense, RJG Foundation, Target ALS Foundation, Michael J. Fox Foundation and the Farmer Family Foundation. Dr. Ascherio has no disclosures.
Footnotes
ACKNOWLEDGMENTS
The content is solely the responsibility of the authors and does not necessarily represent the official views of the National Institutes of Health. We would like to acknowledge the NHS and HPFS cohort participants for enabling this work.
This work was supported by a grant from the National Institute of Neurological Diseases and Stroke (R01 NS089619) awarded to AA. The NHS is funded by the National Institute of Health through grants UM1 CA186107 and R01 CA49449. The HPFS cohort is funded by the National Institute of Health through grant UM1 CA 167552.