
Abstract
Background:
Individualized treatment guided by biomarkers certainly will play a crucial role in the more effective treatment of various neurological diseases in the near future. Identifying the electroencephalographic biomarkers in the brain of patients with Parkinson’s disease (PD) may help in the decision-making process of health professionals regarding the non-invasive brain stimulation (NIBS) protocols.
Objective:
To summarize quantitative electroencephalographic (qEEG) characteristics of patients with PD with motor symptoms at rest or during movement to identify potential biomarker associated with motor impairment in PD.
Methods:
A systematic search was conducted in the databases MEDLINE/PubMed, LILACS/BIREME, CINAHL/EBSCO, Web of Science, and CENTRAL, performed according to PRISMA-statement guidelines. Two independent authors searched for studies that reported qEEG data related to motor outcomes at rest or during movements in patients with PD and compared the data with control healthy group. The studies’ methodological quality was examined using the Cochrane Handbook. Studies/sample characteristics, qEEG parameters/analyses, and the studies’ results were summarized. Prospero-register: CRD42018085660.
Results:
Nineteen studies (18 cross-sectional/one cross-over) with 312 PD patients and 277 controls, published between 1994-2018, were included for the qualitative analysis. In comparison to healthy controls, our findings suggest a slowing down of the cortical activity in patients with PD due to an increase of slower band waves activity and a decrease of fast band waves at resting and during complex movement execution mainly in the central and frontal cortex.
Conclusion:
Slowing down of cortical waves suggest excitatory NIBS for motor impairment in PD. However, qEEG biomarker for motor symptoms of PD cannot be established yet because the studies that related qEEG with motor outcomes presented methodological poor quality.
Keywords
INTRODUCTION
In order to provide better clinical intervention and treatment, several studies have attempted to identify biomarkers of central nervous system disorders for several neurological diseases including Parkinson’s disease (PD) [1]. Taking into consideration that biomarker measurements ideally should be cheap, available and noninvasive and that electroencephalograpic-abnormalities in brain wave patterns have been found in patients with PD [2–7], quantitative electroencephalography (qEEG) seems to be a promising approach to investigate cortical biomarkers for PD. Indeed, a previous systematic review has demonstrated that qEEG could provide reliable and widely available biomarkers for nonmotor symptoms in PD [8]. However, qEEG patterns related to motor symptoms remains uncertain [8].
Individualized treatment guided by biomarkers certainly will play a crucial role in the more effective treatment of various neurological diseases in the near future [1]. By identifying the biomarkers in the brain of patients with PD may help, for example, in the decision-making process of health professionals regarding the non-invasive brain stimulation (NIBS) treatment, a useful and safe approach to sensorimotor rehabilitation for patients with PD [9–11]. Indeed, NIBS treatment seems to modulate qEEG abnormalities in other neurodegenerative disease [12, 13]. Systematic reviews pointed out that both inhibitory [14, 15] and excitatory [9] NIBS treatment had a significant improvement of motor symptoms of PD patients. In contrast, some other studies showed no positive results after NIBS [16, 17]. The heterogeneity of protocols could partially explain different results between studies. Excitatory or inhibitory protocols have been applied in different brain target regions as supplementary motor area [18–21], motor cortex [9, 22] and cerebellar regions [23].
Thus, we aim to perform a systematic review to identify EEG profiles associated with motor impairment in patients with PD at resting and during movements. The identification of EEG biomarkers in PD patients may help to indicate the best protocol for NIBS treatment.
METHODS
Review of literature and searching in databases
The systematic review was performed and reported according to Preferred Reporting Items for Systematic Reviews and Meta-Analyses statement guidelines [24]. An extensive literature search was conducted using the following databases: Medline (PubMed), LILACS (BIREME), Web of Science, CINAHL (EBSCO), and CENTRAL Cochrane library.
The descriptors used for the search strategy in all databases were: “electroencephalography” and “Parkinson Disease”, using the Boolean operator “AND”. The subheadings “diagnosis”, “diagnostic imaging” and “analysis” were applied for the search in the Medline database. None filter was applied in the search strategy. All searches were conducted in September 2019.
Two authors (LS and MB) performed the search strategies and, independently, identified the articles that met the eligibility criteria from the reading of titles and abstracts. Any disagreements between reviewers were resolved by a third reviewer (SR). Next, full-text studies were retrieved to verify the study eligibility and further advice was sought from a third reviewer when there was any disagreement. Cohen kappa for interrater agreement was calculated through the SPSS v. 23 for Windows.
Eligibility criteria
We included in our review studies without restriction of language and year of publication that evaluated cortical alterations related to motor outcomes by means of cortical (surface) qEEG measures analysed at rest or during movements in patients with PD and compared the data with a healthy group. We excluded review studies that presented patients submitted to deep brain stimulation (DBS), evaluated qEEG in animal models or in patients with other pathologies associated with PD.
Data extraction and analysis
The data for bias risk assessment was performed independently by the two authors (LS and MB). For the bias risk analysis, only the following aspects were observed: (1) Blinding of participants and personnel (performance bias); (2) Blinding of outcome assessment (detection bias); (3) Incomplete outcome data (attrition bias); (4) Selective reporting (reporting bias); (5) Other bias. A graph for bias risk analysis was constructed using Revman software version 5.6.
Relevant data as the study information, sample characteristics and EEG parameters were extracted independently using a standardized data extraction form. We also performed the calculation of levodopa equivalent dosage (LED), using the tool Levodopa Equivalent Dose Calculator, available in parkinsonsmeasurement.org.
The data of each group (PD and control) were presented as means and standard deviation (SD). When means and SDs were not provided, median values were considered to be equal to mean values if data were normally distributed and interquartile ranges were divided by 1.35 to obtain the SD [25]. If necessary, we also calculated the SD from confidence interval data informed in the studies as recommended by Chapter 7 of Cochrane Handbook [26].
RESULTS
Identification and selection of studies
Figure 1 shows the flow diagram of study selection for the meta-analysis. Search strategies yielded 454 results (178 found in MEDLINE, 193 in CINAHL, 22 in Web of Science, 55 in CENTRAL, 4 in LILACS, and 2 after the search in articles references). After the removal of duplicates, 360 articles were identified but only 38 remained after reading titles and abstracts. Of these, 19 were included in the qualitative analysis with 312 PD patients and 277 controls. The participant’s characteristics are presented in Table 1. Included studies were published between 1994 [27] and 2018 [28], all of these presenting a cross-sectional design except for one [2]. The value of Cohen Kappa of study selection in all databases was 0.833.
Sample characteristics and main information about the methods and results of the included studies. The studies are ordered by severity of the motor impairment of the sample measured by UPDRS-III
aLevodopa equivalent conversion; bwhen the study did not specified the state of UPDRS assessment we considered the value at ON state; CG, control group; ERP, event related potential; ERS, event related spectral analysis; Hz, hertz; LED, Levodopa equivalent dosage; mg, milligram; ND, not described; PD, Parkinson’s disease; SD, standard deviation; SEP, somatosensory evoked potential; UK, United Kingdom; USA, United States of America.
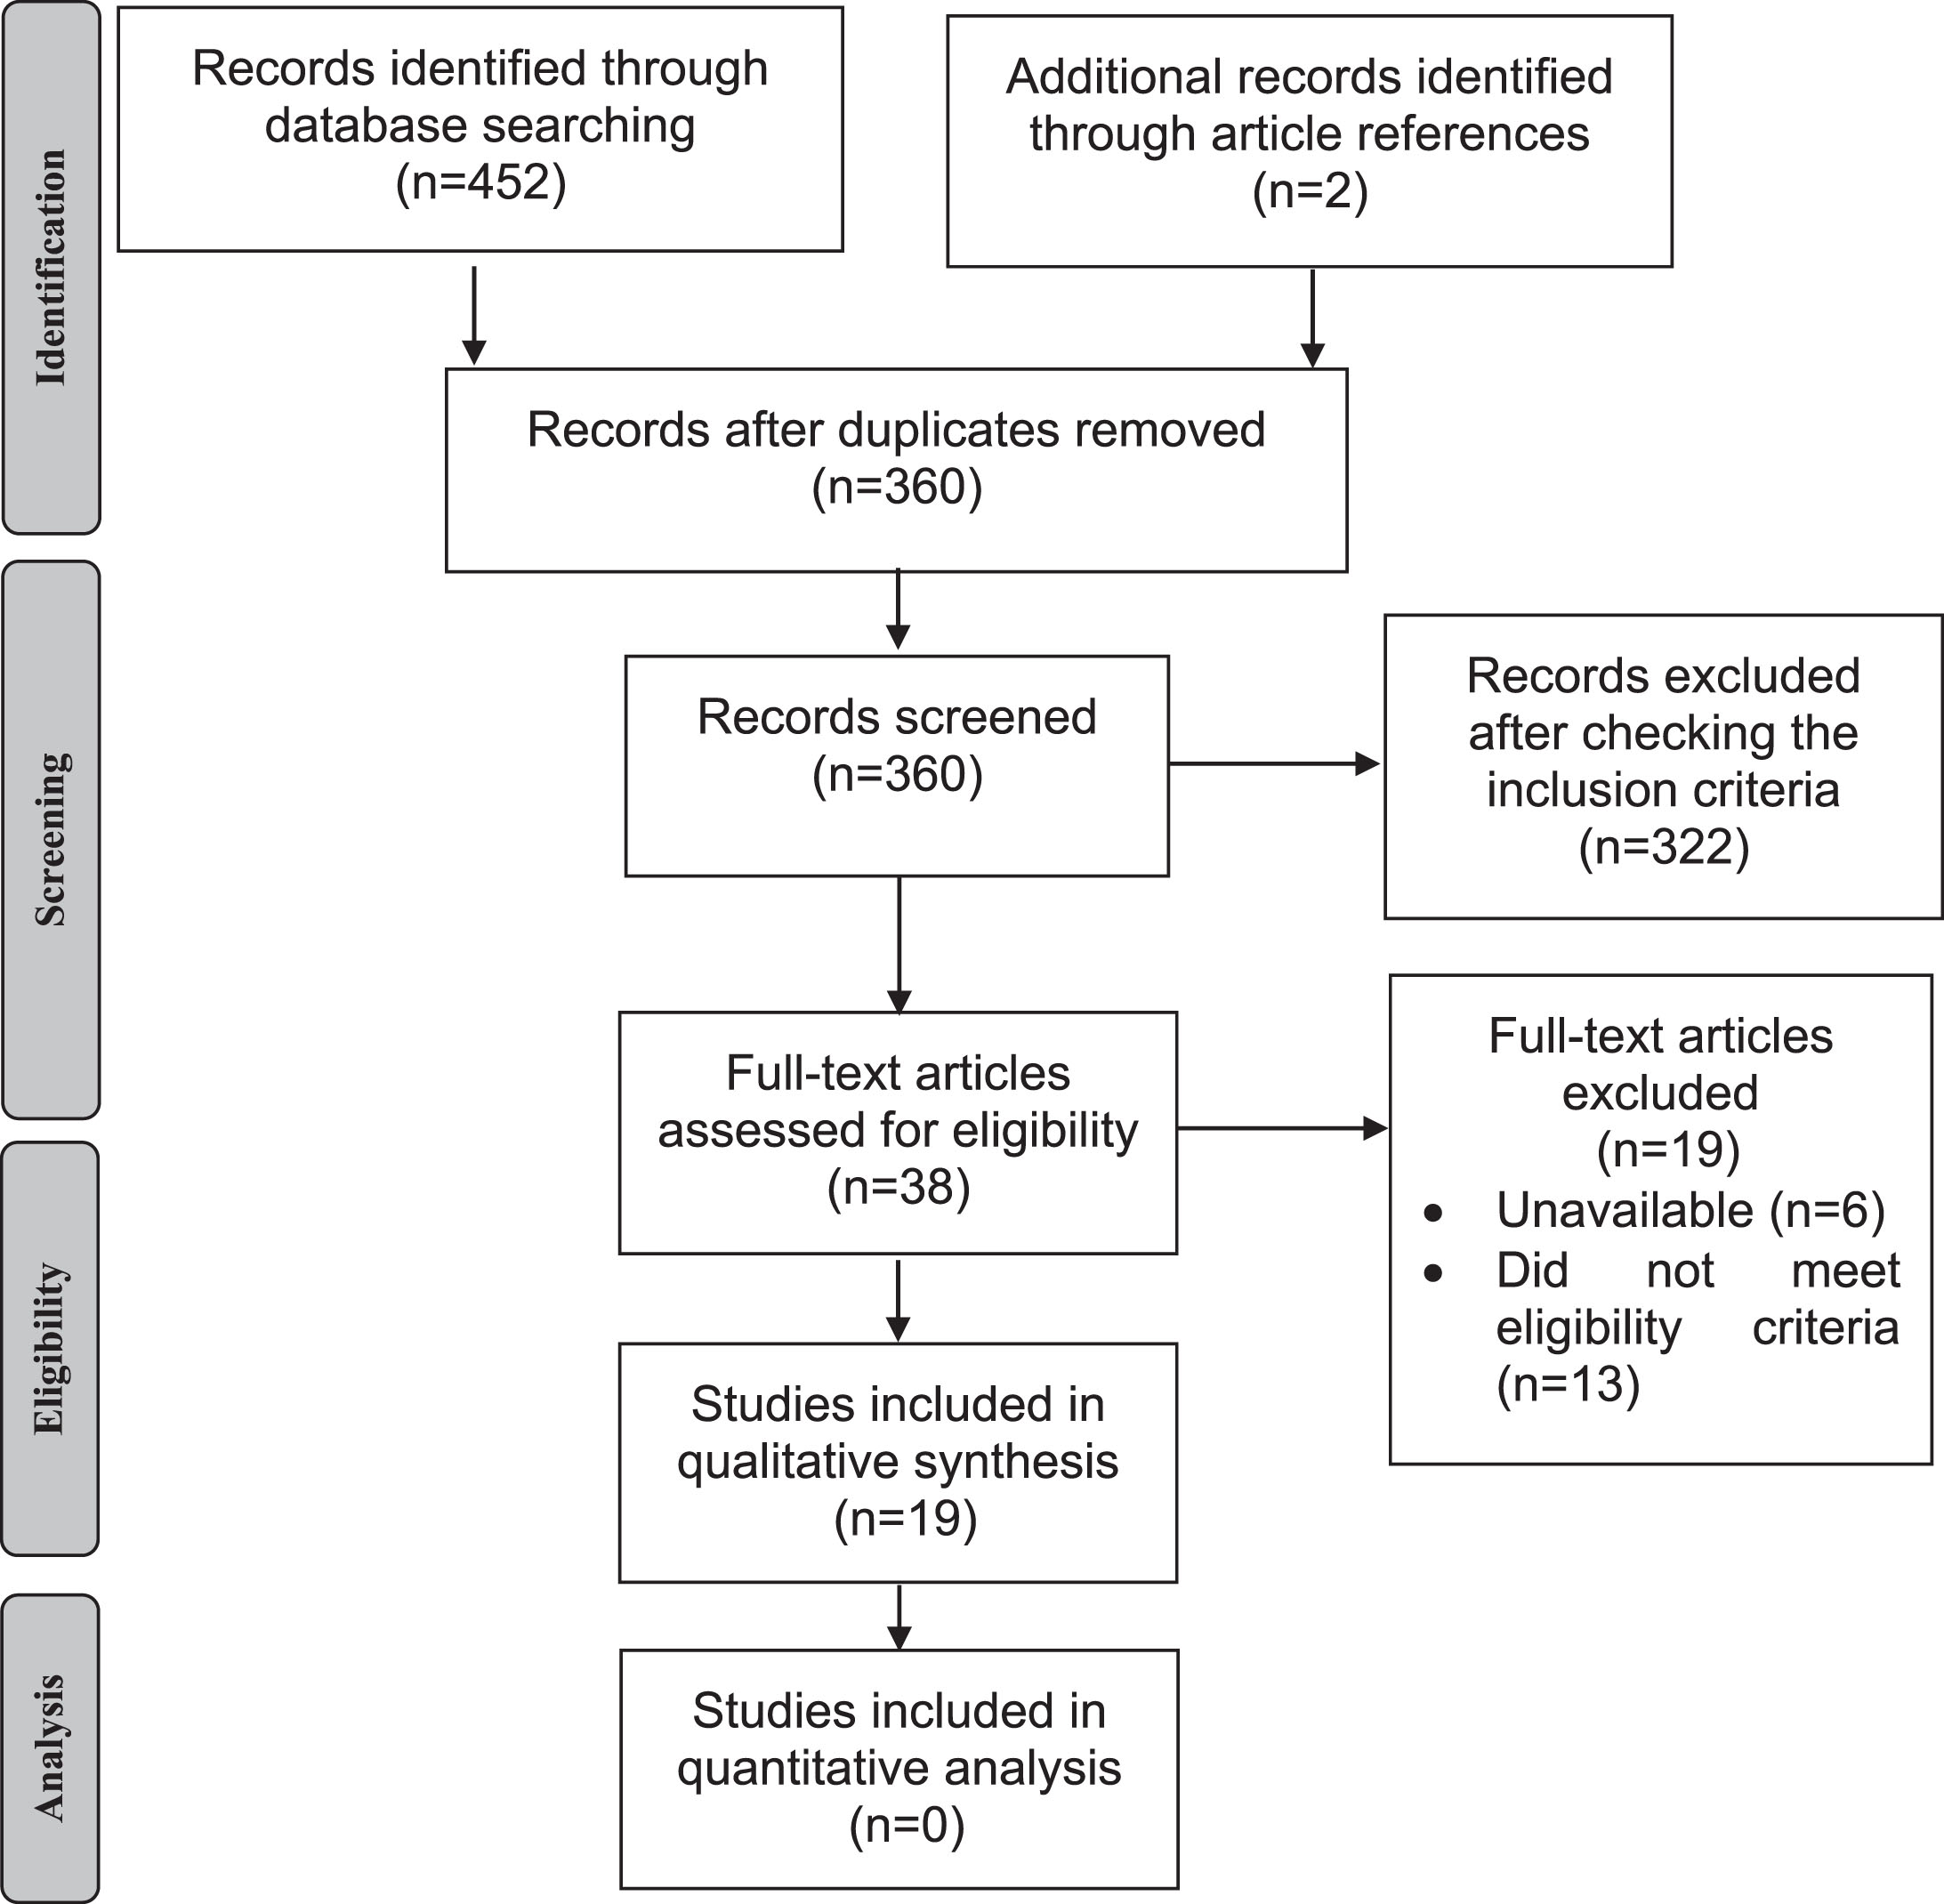
Flow diagram of the study.
Risk of bias
The risk of bias in each study was classified as low, uncertain or high risk of bias according to the Cochrane Handbook for Systematic Review of Interventions [29]. Figure 2 summarized the risk of bias of 19 selected studies considering the main outcome. Most of the studies were classified as high or uncertain risk of bias for at least 2 evaluated items. None of the included studies presented blinding for evaluators or participants (performance bias). We judged this item always as low risk of bias since the lack of blindness probably did not influence the cortical activity of the patients. In contrast, the lack of blindness of outcome assessment (detection bias) was considered as high risk of bias. For the other risk bias, the study was considered as a “high risk of bias” if did not present a declaration of absence of conflict of interest, discrepancy in the sample characteristic between groups or problems in capturing or analysing signals.
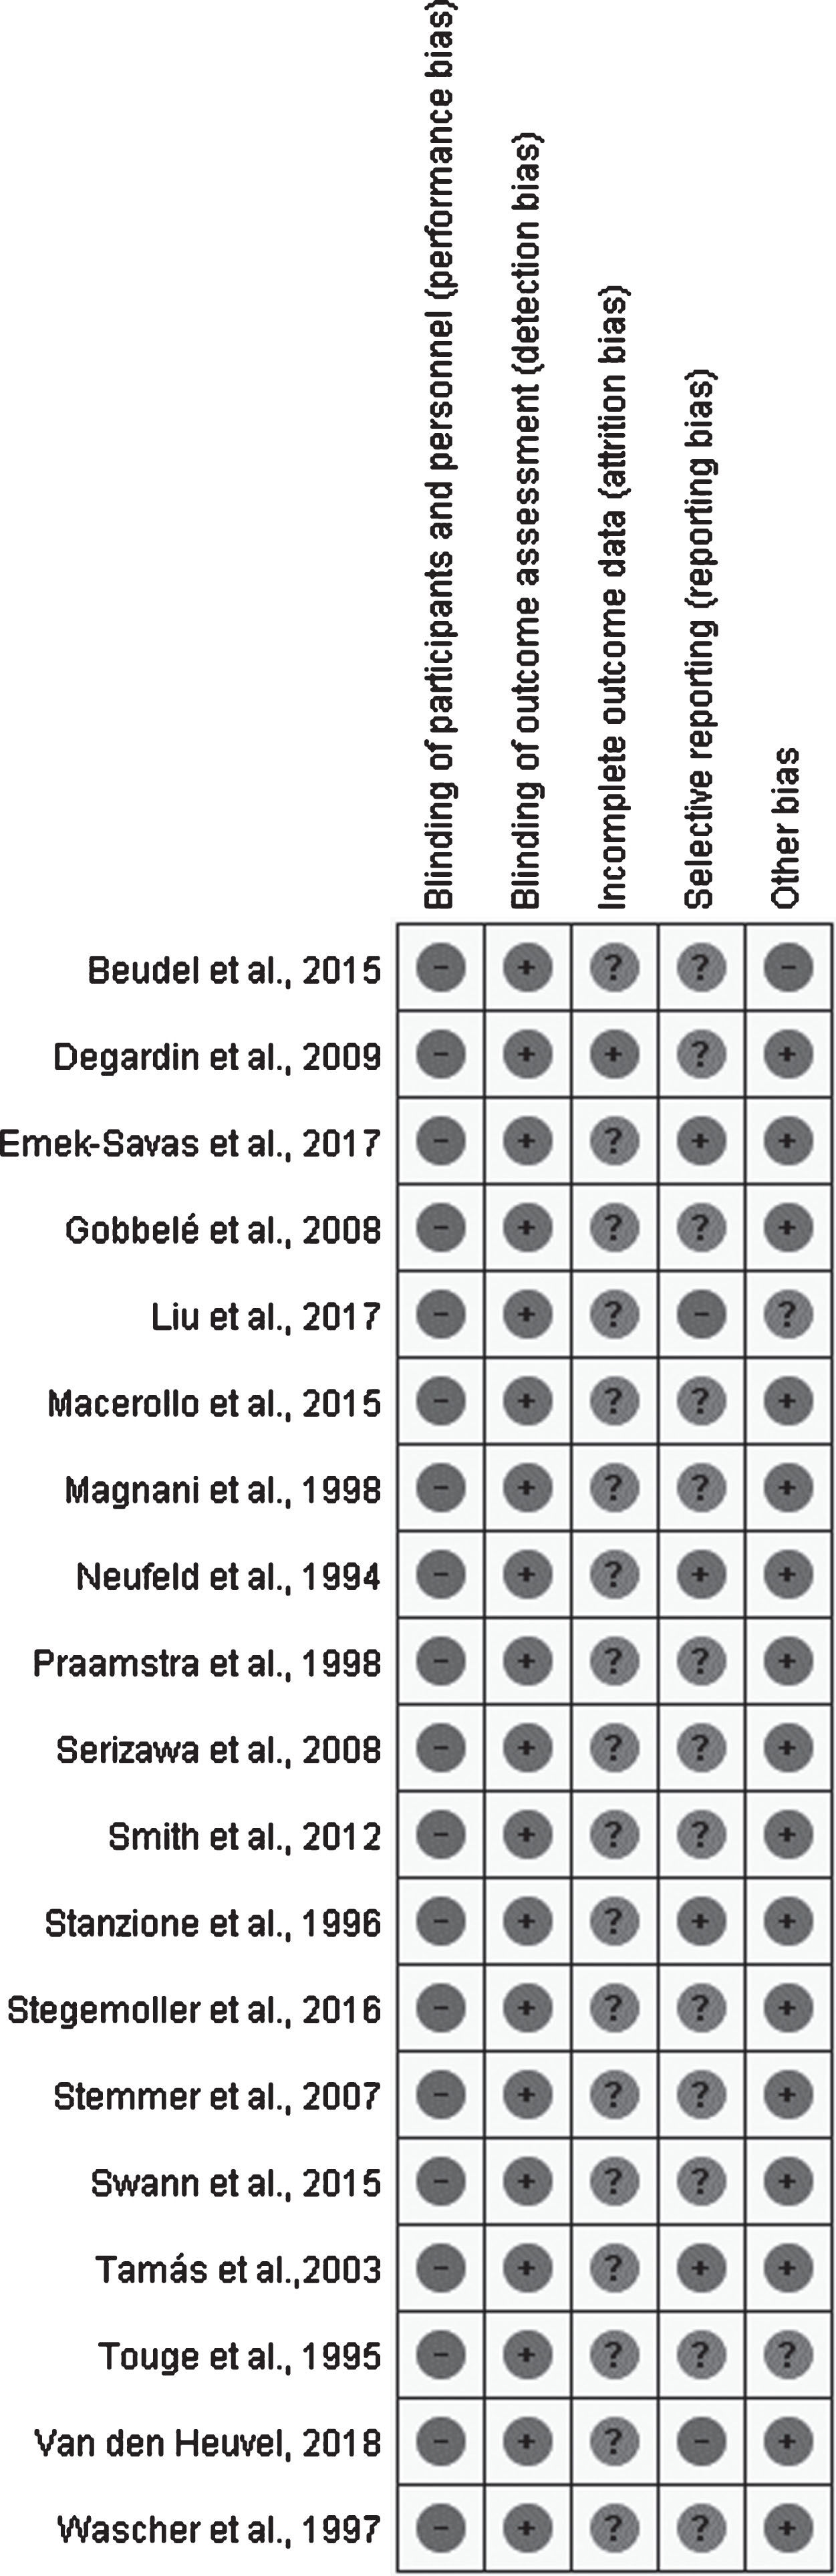
Risk of bias analysis of included studies. Legend: (+) Low risk of bias; (?) Uncertain risk of bias; (–) High risk of bias.
One study [30] was categorized as high risk in reporting bias because statistical analysis and quantitative description of between-group differences were not done. We classified just one study [31] as high in the “other bias risk” because the authors reported that the patients were evaluated in the “almost OFF” state. Moreover, two study [30, 32] were classified as uncertain in the “other bias risk”. One [30] because the authors did not present clinical measures of the participants and the other [32] because presented non-equivalent proportion between males and females in the groups. Thirteen studies [2–7, 31–37] did not present the results in mean and standard deviation, and were therefore classified as uncertain risk of bias for selective reporting aspect.
Sample characteristics
Eight studies evaluated the motor impairment of PD patients only in ON-medication state, but not in off [2–6, 38]. The age of participants varied between 56.5±26.7 [32] and 72.3±6.0 [27]. Time onset of disease varied between 3.7±2.9 [39] and 7.3±3.9 years [32] and men comprised the most sample. Four studies did not specify if the UPDRS score was evaluated at ON or OFF state [7, 38].
Eleven studies assessed patients in Hoehn & Yahr (H&Y) stages 2 and 3 of the disease, five studies [2–4, 31] did not mention the stage and six [5, 37] presented incomplete information. The dosage of levodopa intake varied between 216.7±133.2 [7] and 1190±465 mg/day [4]. Seven studies did not present the dosage of levodopa intake. The participant’s characteristics are presented in Table 1. We ordered the Table 1 according the motor impairment of the sample measured by UPDRS-III. Eight studies [2, 40] did not mentioned the UPDRS scores in their results.
General characteristics of the studies
In general, the studies were accomplished in Europe and USA (Table 1). The number of channels (Table 2) varied between 2 [4] and 128 [2], and the most utilized analysis method (Table 1) was the event related potential (ERP) in different conditions [2, 40]. Other methods used were spectral analyses [27, 38] focused in alpha [4, 37] and beta frequency band [4, 37], and somatosensorial evoked potential (SEP) [3, 33].
Methodological characteristics of EEG in the included studies
CNV, contingent negative variation; EEG, electroencefalography; ERD, event related desynchronization; ERO, event related oscillations; ERP, event related potential; ERS, event related synchronization; FFT, fast Fourrier Transform; Hz, hertz; NA, not applied; ND, not described; PD, Parkinson’s disease; PS, power spectral analysis; SEP, somatosensory evoked potential.
The task during EEG executed by the volunteers consisted in upper limb movement [2, 40] or a balance task [28, 37]. Nine studies evaluated the participants in the resting [3, 39] (Table 1).
We decided not to realize the quantitative analysis of the data because the acquisition and analysis EEG protocols were highly different among the studies (Table 2). The studies’ results were summarized in Table 1.
Cortical biomarkers of PD patients in resting state
During resting state, SEP in PD patients with or without medication seems not to be different to healthy individuals [3, 33]. However, it was observed that OFF medication, PD patients did not present attenuation of SEP, whereas ON medication presented this hallmark. Attenuation is defined as a cortical response decrease from repeated stimuli [3]. In relation to sensory-evoked delta oscillations, PD patients seem to present lower amplitudes in the midline locations when compared to control group [39].
Moreover, the spectral analysis demonstrated a general “slowing down” of PD patients’ cortical activity. An increase of spectral power of slower band waves and a decrease of faster band waves were observed [6, 38]. For beta band analysis, no difference between PD patients and controls regarding power spectrum analysis was found [6, 38].
Cortical biomarkers of PD patients during movement
Compared to healthy controls, most studies found differences in cortical patterns in central and frontal cortex regions during the execution of a task [2, 39] and these seem to be slower in PD patients, mainly in the contralateral cortex to the movement.
Some included studies had presented that beta activity during a complex motor task is lower in PD patients compared to controls [2, 37]. However, Tamás and Colleagues (2003) did not find differences between groups in beta band when patients executed self-paced simple finger movements [40].
Additionally, three studies [28, 35] failed to find difference in ERP between patients and controls. In contrast, two studies [7, 39] observed a decrease of ERP in PD during tasks with motor and cognitive demand. Touge and colleagues (1995) reported that in aleatory tasks, PD patients presented a suppression of ERP [32]. Van den Heuvel and colleagues showed that PD patients seem to present higher power modulation of beta band (assessed by the mensuration of SD of power peak over time in each band) only during a task with incongruent visual feedback [28].
DISCUSSION
The current evidence across qEEG pattern as biomarker for the motor symptom in patients with PD involves few studies with reduced sample size and with high or unclear risk of bias. The summary of current evidence suggests a slowing down of the cortical activity in patients with PD at resting and during complex movement execution, in comparison to healthy controls.
Potential biases of studies
The studies that assessed qEEG in PD patients had small sample size and potential critical biases. Indeed, the most of studies presented no sample size calculation and blinding of qEEG analyst. Blinding analysis is considered the only way to trust results [41] and a precise and accurate conclusion with lesser probability to leading a type II error can only be made by an appropriate sample size [42]. Thus, the results of our study should be extrapolated with caution.
Other minor biases of included studies could be cited, as the lack of the information about medication intake dosage, H&Y stage and motor subtypes of the patients. The clinical sample characteristics are relevant to external validity of findings. Moreover, PD prognosis seems to be linked to stage of the disease [43] and subtypes classification [44, 45], reinforcing the importance of the adequate description of clinical data.
Cortical biomarkers of PD patients in resting state and during movement
The spectral analysis of included studies in resting demonstrated an increase of spectral power of slower band waves and a decrease of faster band waves suggesting a “slowing down” of PD patients’ cortical activity. Similarly, a recent systematic review identifies lower dominant frequency or increased theta power in PD patients [8]. The slowing down of cortical waves seems to related to some motor impairment as the bradykinesia at OFF state [31] and freezing [46, 47]. Whereas the decrease of beta frequency band seems to be associated to general motor function impairment in PD [48–50].
During movement when compared to healthy subjects, we found an qEEG abnormal pattern (slower activity), mainly in the contralateral cortex to the movement, in PD patients with motor impairment who performed complex task [2, 39]. However, some studies which the patients performed simple task [35, 40] failed to find this abnormality. This discrepancy could be justified by the difference of the complexity of tasks performed among the studies. More complex tasks would require higher cortical activation that are not observed during simple task [51]. Moreover, Van den Heuvel and colleagues showed that PD patients seem to present higher power modulation of beta band during a task with incongruent visual feedback (more complex task). In the same research, there was no difference between PD and controls during a task with visual feedback presented in real time (simple task) [28].
Insights for NIBS treatment based on cortical biomarkers in PD
In summary, the slower activity found in PD patients with motor impairment suggests that these patients could be benefit with excitatory NIBS over frontal and central cortical areas. Several studies have demonstrated that excitatory NIBS has beneficial effect for the treatment of motor symptoms in patients with PD [9–11, 52]. Though the mechanisms underlying these effects are unclear, the excitatory NIBS seems to be able to reverse the “slowing down” of cortical waves. Indeed, previous studies in healthy controls and in patients with Alzheimer’s disease demonstrated that excitatory NIBS over parietal cortex was capable to increase the alpha and beta power during and after stimulation in several brain regions [12, 13], whereas inhibitory NIBS produced a decreased theta power [13].
The excitatory NIBS seems to decrease the spectral analysis of the lower-frequency band and increase synchronization of all bands [53–60]. However, how to explain the benefits of inhibitory NIBS on motor symptoms of patients with PD [14, 15]? The existence of clinical subtypes- specific cortical endophenotypes of PD could help in clarifying this discrepancy. A recent study identified differences in the connectivity pattern of levodopa-induced changes in neural activation between patients with tremor dominant and instability/gait difficulty PD subtype during a motor task evaluated by fMRI [61]. This reinforces the theory that patients with distinct clinical characteristics could present different patterns of cortical endophenotypes. Therefore, PD patients with distinct clinical characteristic could answer differently to excitatory or inhibitory NIBS due the different brain pattern activation. Further studies are required to clarify this issue.
It is important to highlight some limitations of our review. The most of the included studies have consistently failed in detailing the motor impairment of patients which made difficult to establish a relationship between motor symptoms and the patterns of cortical waves. Moreover, the lack of quantitative analysis and the heterogeneity of protocols between the included studies could somehow limit our conclusion.
Conclusion
The current evidence across electroencephalography as an evaluation approach for motor impairment biomarkers in PD patients involves few studies with reduced sample size, with high or unclear risk of bias. The studies included in this review varied a lot in relation to qEEG acquisition and analysis methods, positioning and number of electrodes, the objective and time of task execution which limited the generalization of the results. Therefore, besides the studies presented a slowing down of cortical activity in patients with PD at resting and during complex activity execution when compared to controls, this result should be considered with caution due the methodological heterogeneity and poor quality of the studies. Thus, there is a need for larger controlled trials with blinding of qEEG analyst, which could increase the power of results. In addition, further studies are also necessary to investigate qEEG biomarkers considering the different clinical characteristics (as phenotypes of the disease, time onset diagnosis and medication issues) and the NIBS effect on cortical waves, taking into consideration these clinical characteristics of the disease.
CONFLICT OF INTEREST
No conflicts of interest, financial or otherwise, are declared by the authors.
Footnotes
ACKNOWLEDGMENTS
LS was supported by the Fundação de Amparo à Ciência e Tecnologia de Pernambuco (FACEPE) (grant number IBPG-1548-4.01/16), Brazil. Monte-Silva K is supported by Conselho Nacional de Desenvolvimento Científico e Tecnológico (CNPq), Brazil (grant number 308291/2015-8).