
Abstract
Background:
Parkinson’s disease (PD) is known to affect retinal structure and activity. As such, retinal evaluations may be used to develop objective and possibly early PD diagnostic tools.
Objective:
The aim of this study was to investigate the effects of Parkinson’s disease (PD) manifestation and treatment on retinal activity.
Methods:
Data were collected on 21 participants diagnosed with PD, including the number of medications taken, clinical scales and flash electroretinography (fERG) measurements, under light-adapted and dark-adapted conditions. The fERG parameters measured included a-wave and b-wave amplitude and implicit time (i.e., latency). First, we investigated correlations between symptom measure scores and the fERG parameters. Next, we divided participants into two groups based on their antiparkinsonian medication load and analyzed differences between these groups’ fERG parameters.
Results:
fERG parameters were strongly correlated with a number of clinical variables, including motor and non-motor symptoms and age at PD onset. Photoreceptor cell implicit time was longer among participants taking one or less antiparkinsonian medication as compared to those taking two or more. However, overall there was not strong evidence of a relationship between the number of antiparkinsonian medications taken and the fERG parameters.
Conclusion:
Findings suggest that fERG may be a useful, non-intrusive measure of retinal, and, perhaps overall CNS function, in PD. However, additional studies in larger samples are needed to clarify this association.
INTRODUCTION
Impairment of the visual system in Parkinson’s disease (PD) is common. Visual signs and symptoms in individuals with PD include decreases in visual acuity, contrast sensitivity, color vision and motion perception, as well as the emergence of visual distortions and hallucinations [1, 2]. These changes can be observed even in cases of mild PD [3]. Some visual symptoms are present at the time of diagnosis, and potentially start very early in the disease course, before the emergence of motor symptoms [4]. In prior studies, visual symptoms have been correlated with severity of some PD symptoms, mainly freezing [5] and gait instability, as well as with overall PD symptom severity [3].
Retinal functioning is significantly influenced by dopamine (DA), the main neurotransmitter involved in the etiology of PD [6–10]. A growing body of evidence shows that retinal structure and function are disrupted in PD and significantly contribute to the visual impairment observed [6]. Retinae of individuals with PD were shown to have morphological and biochemical changes including thinning of the nerve fiber layer [11–13], degeneration of the ganglion cell-inner plexiform layer [14], reduced DA levels [15] and the presence of misfolded alpha synuclein [16] and phosphorylated alpha synuclein [17], which are pathologic diagnostic hallmarks of PD. Moreover, some structural and functional visual system changes may predict poorer outcomes in PD, such as onset of dementia [18].
Currently, diagnosis of PD is mostly clinical, and there is great interest in identifying biomarkers that can allow for earlier diagnosis and improved care, especially in atypical cases. Since structural and electrophysiological tools such as optical coherence tomography (OCT), flash electroretinography (fERG), pattern electroretinography (pERG), and visual evoked potentials (VEPs) show changes in retinae of individuals with PD during early stages of the disease, there is an increasing interest in using such measures as diagnostic aids [19–21].
Flash ERG records electrical potentials generated by retinal cells in response to light stimuli. ERG recordings in photopic (light adapted, and rod-saturated) conditions are mainly indicative of cone functioning, while data from scotopic (dark adapted) conditions primarily reflect rod functioning. The fERG waveform (see Fig. 1) is characterized by a negative a-wave indicative of photoreceptor cell hyperpolarization followed by a positive b-wave arising from bipolar-Müller cell complex depolarization [22]. Prior studies in PD using fERG have reported both a-wave [23–25] and b-wave [22–26] abnormalities, indicative of attenuated cone, rod, and bipolar-Müller cell activity. In one early study, prolonged b-wave implicit time was also observed [27]. Notably, some fERG anomalies have been reported in early PD patients who are not receiving dopaminergic treatments (e.g., [26, 27]), and therefore may reflect pathogenic mechanisms of the disease. Moreover, researchers have reported that after administration of levodopa, ERG amplitudes and implicit times are improved in people with PD [27]. These data suggest that fERG abnormalities may be related to underlying PD processes and therefore may facilitate early diagnosis [23–27].
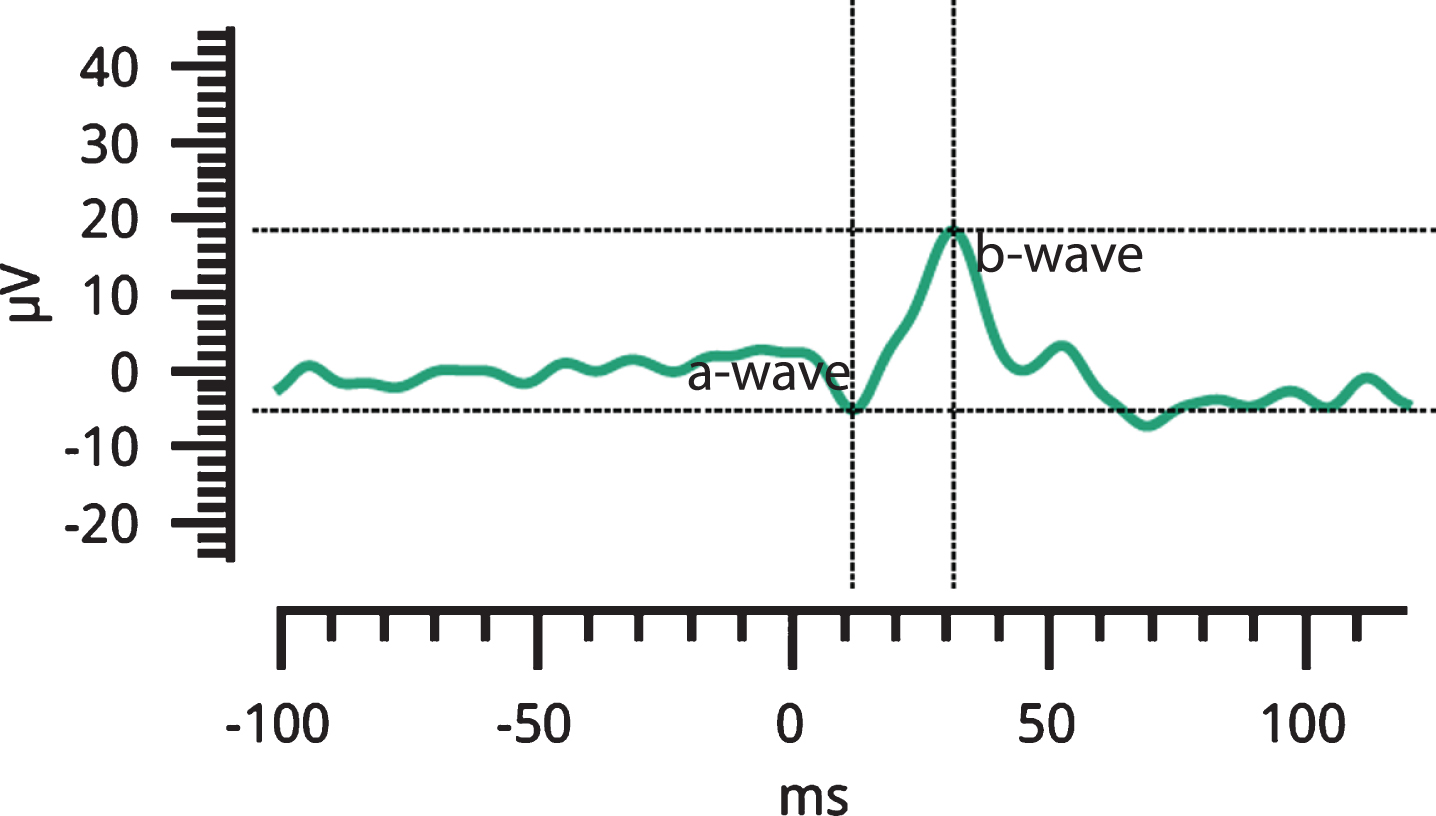
fERG waveform of a study participant, including a-wave and b-wave.
The objectives of this exploratory study were two-fold. First, our aim was to better understand the relationship between PD symptoms and retinal functioning, using a hand-held, portable fERG device that does not require pupil dilation or that anything be placed on the eye. A secondary objective was to further clarify the effects of dopaminergic treatments on retinal cell activity. Specifically, our goal was to determine whether anomalies in retinal cell functioning were related to antiparkinsonian medication load. Should our data support a relationship between retinal functioning, PD symptom manifestation, and PD medication load, these findings would suggest that fERG may be a brief, objective screening tool with clinical utility in PD.
MATERIALS AND METHODS
Participants
Twenty-one (21) individuals diagnosed with Parkinson’s disease by a movement disorder specialist were recruited from the Department of Neurology at Rutgers Robert Wood Johnson Medical School (N = 9), and online via Fox Trail Finder (N = 12). Sixteen other interested persons were excluded from the study due to having: 1) eye conditions known to affect fERG parameters such as glaucoma, cataract or macular degeneration; 2) corrected visual acuity of less than 20/25; 3) an active substance abuse disorder or medical cannabis consumption during the six months prior to participation; 4) neurological conditions other than PD (e.g., epilepsy); or 5) a diagnosis of a psychotic disorder, which is associated with fERG anomalies [28].
Procedure
Participants completed visual acuity testing and the fERG protocol described below, as well as a series of symptom measures, including Parts I (non-motor experiences of daily living) and II (motor experiences of daily living) of the Movement Disorder Society Unified Parkinson’s Disease Rating Scale (MDS-UPDRS) [29], the Montreal Cognitive Assessment Scale (MoCA) [30], a cognitive screening tool that is sensitive to the effect of cognitive decline on PD, the Hamilton Rating Scale for Depression (Ham-D) [31], and the Hamilton Rating Scale for Anxiety (Ham-A) [32]. All measures above are recommended by the National Institute of Neurological Disorders and Stroke (NINDS) as research tools for PD. Participants also completed a demographic form and the vocabulary subscale of the Shipley II, an indicator of premorbid verbal IQ [33]. Estimated age of PD onset and PD duration was collected based on participant self-report and/or electronic medical record data. Finally, antiparkinsonian medication information was collected and total daily levodopa equivalent dosages (LED) were calculated for each participant [34].
All participants were continuously exposed to indoor lighting for at least 30 minutes before the tests began, followed by an adjustment period of 5 minutes in the testing room. They were then tested with the light-adapted (photopic) tests. Subsequently, participants were dark-adapted for 10 minutes before the dark-adapted (scotopic) tests as described below.
The study was approved by the Rutgers internal review board (Pro20150002281) and written informed consent was obtained from each participant prior to the initiation of any study procedures. Participants were paid 15 dollars per hour for their involvement in the study.
Apparatus
ERG data were collected using the RETeval, a device that requires neither corneal contact lens electrodes nor pupil dilation (LKC Technologies, Inc., Gaithersburg, MD, USA). RETeval is a hand-held, portable instrument that uses continuous pupil size measurement to adjust the intensity of light stimuli on a trial-by-trial basis to ensure constant retinal illuminance regardless of changes in pupil size [35]. Flash retinal luminance is measured in Trolands (Td) and is calculated by multiplying photopic flash luminance (cd · s/m2) by pupillary area (mm2). This Troland (Td) based, constant retinal illuminance protocol was shown to have advantages over constant stimulus luminance protocols during fERG flicker tests [35] and it is described further in an earlier paper from our group (Demmin et al. [36]). Therefore, parts of the description of the methods, below, match the description of the methods in our earlier paper.
ERG parameters
Light adapted testing included four different stimuli: 1) a 100 Td·s flash stimulus presented at a 1 Hz repetition rate with no background luminance (P1); 2) a 100 Td·s flash stimulus presented at 2 Hz, with a 340 Td·s background (P2); and 3) a 58 Td·s red stimulus presented at a 3.4 Hz rate, with a 380 Td·s blue background (P3). In addition to these flash conditions, we included a condition with an 85 Td·s flickering (at 28.3 Hz) stimulus (PF). This is an International Society for Clinical Electrophysiology of Vision (ISCEV) standard test that is primarily a measure of bipolar cell response, and that was included as an additional method to isolate cone activity (due to the inability of rods to process stimuli at that level of temporal resolution). The scotopic tests in this study were 2.8 Td·s (.25 Hz, S1), 28 Td·s (.1 Hz, S2), and 280 Td·s (.05 Hz, S3) white flashes without background luminance.
Flash ERG output included measurements of amplitude (in microvolts; μV) and implicit time (latency, in milliseconds; ms). Amplitude of the a-wave was measured from the baseline to the negative trough of the a-wave, as per convention. Amplitude of the b-wave was measured as the voltage difference from the a-wave trough to the b-wave peak (see Fig. 1). Measurements of latency for each component were taken from flash onset to the response peak. Amplitudes and latencies were measured for all fERG conditions using flash stimuli. These variables represent the strength and the speed of retinal cell response, respectively. The stimulus for the photopic flicker test is sufficiently fast that the fERG response is not characterized by separate a-wave and b-wave responses and therefore only peak-to-peak amplitude and latencies (i.e., average time between positive peaks) were obtained for this condition. Testing time was approximately 4 minutes per eye for each lighting condition, and so ∼26 minutes was required to test both eyes in photopic and scotopic conditions, including the dark adaptation period.
Statistical analysis
We conducted two sets of statistical tests. First, bivariate correlations (Pearson’s r) were calculated between the fERG parameters and clinical measures listed above. Outliers were detected through visual inspection of scatterplots. Second, the effect of medications on the fERG parameters was examined in a series of independent samples t-tests For these analyses, groups were defined as: participants taking one medication or less (group L, n = 9), and participants taking two medications or more (group M, n = 11). One participant was excluded from this analysis as medication information was missing.
An average was computed for each fERG parameter from right and left eye data. Additionally, for the purposes of these analyses, the amplitudes and latencies of the a- and b-waves were averaged across light- and dark-adapted tests (i.e., P1, P2 and S1, S2, S3). Amplitude and latency of the flicker test (PF) and the colored light stimulus (P3) were considered separate variables, resulting in 14 fERG parameters altogether. Effect sizes for between-group comparisons were calculated using Cohen’s d.
The purpose of this study was exploratory, not confirmatory. Because of this, and given the relatively small sample size, we did not control for the number of statistical tests used. We recognize that this increases the risk of reporting a finding that is not confirmed in a future study, but we believe that accepting this risk is preferred over the risk of overlooking a potentially meaningful finding that is then not investigated further. Nevertheless, as noted, some procedures were used to reduce the overall number of statistical tests (e.g., averaging left and right eye data from each test into a single variable).
RESULTS
Participant profiles
Participants’ demographic and clinical information are presented in Table 1. Antiparkinsonian medication information (i.e., frequencies) is presented in Table 2.
Demographic and Clinical Information
MDS-UPDRS, Movement Disorder Society Unified Parkinson’s Disease Rating Scale; Ham-D, Hamilton Rating Scale for Depression; Ham-A, Hamilton Rating Scale for Anxiety; MoCA Montreal Cognitive Assessment Scale. ∧Score range on MDS-UPDRS sum of motor and non-motor experiences of daily living is between 0–52 with 11/13 points being cutoff points for a moderate level of impairment in quality of daily living on part I/II [46] +The MOS 36 physical and mental subscores were calculated using a standard key [47].
Antiparkinsonian medication frequencies
Bivariate correlations
MDS-UPDRS sum of the non-motor and motor experiences of daily living scores (Part I and II) was significantly correlated with scotopic (i.e., dark-adapted) a-wave amplitude (r = 0.49, p = 0.02; after removing a potential outlier: r = 0.60, p = 0.006) and latency (r = –0.53, p = 0.02), indicating that greater severity of PD symptoms is associated with attenuated photoreceptor (i.e., a-wave) amplitude, but shorter latencies. Similar relationships were observed individually for both MDS-UPDRS Part I (non-motor) and Part II (motor) experiences of daily living subscales. Specifically, MDS-UPDRS Part II scores were significantly correlated with photopic a- (r = 0.47, p = 0.03) and b-wave (r = –0.51, p = 0.03) amplitudes and also scotopic a- (r = 0.50, p = 0.02) and b-wave amplitudes (r = –0.48, p = 0.03), again suggesting a relationship between greater motor symptoms and reduced photoreceptor cell and bipolar-Müller cell activity. MDS-UPDRS Part II scores were also negatively correlated with photopic a-wave latency (r = –0.47, p = 0.03), while MDS-UPDRS Part I scores were negatively correlated with scotopic a-wave latency (r = –0.48, p = 0.03), demonstrating an association between motor and non-motor symptom severity and decreased photoreceptor cell latency. Next, we examined relationships between fERG parameters and MDS-UPDRS non-motor physical (e.g., sleep problems, pain) and psychiatric (e.g., depressed or anxious mood) non-motor symptoms. MDS-UPDRS non-motor physical symptoms were significantly correlated with scotopic a-wave amplitude (r = 0.50, p = 0.02) and latency (r = –0.52, p = 0.02), further suggesting a relationship between non-motor physical PD symptoms and attenuated photoreceptor cell amplitude and shorter latency. No significant correlations with non-motor psychiatric MDS-UPDRS symptoms and fERG variables were observed.
Correlations were also performed to examine the relationship between fERG variables and cognitive functioning in PD. Results showed that higher performance on the MoCA was correlated with attenuated P3 (i.e., colored light test) a-wave amplitude, after removing two outliers (r = 0.48, p = 0.04). Likewise, reduced P3 (i.e., colored light test) a-wave amplitude was associated with fewer depressive symptoms (i.e., Ham-D; r = –0.47, p = 0.047), though this relationship bordered on significance. No significant relationships between anxiety symptoms (i.e., Ham-A) and fERG variables were observed. Finally, age at PD onset was significantly correlated with fERG latency, whereby older age of onset was associated with longer photopic a- (r = 0.48, p = 0.03) and b-wave (r = 0.59, p = 0.005) latency, flicker test latency (r = 0.59, p = 0.005), and P3 a- (r = 0.46, p = 0.03) and b-wave (r = 0.60, p = 0.004) latency. fERG variables were not significantly correlated with estimates of premorbid verbal IQ (i.e., Shipley scores), PD duration, or levodopa equivalent dosage (LED; ps > 0.05).
Effect of medications
Figure 2 shows the mean values of the fERG parameters for the group of participants taking one antiparkinsonian medication or less (group L) compared with the group of participants taking two or more medications (group M). Daily LED was significantly higher in group M as compared to group L (t(18) = 2.45, p = 0.03). Latency of the a-wave in the P3 (i.e., colored light test) condition was significantly longer in group L as compared to those taking two or more antiparkinsonian medications (group M; t(18) = –2.32, p = 0.03, d = 1.04). No other between-group comparisons were statistically significant.
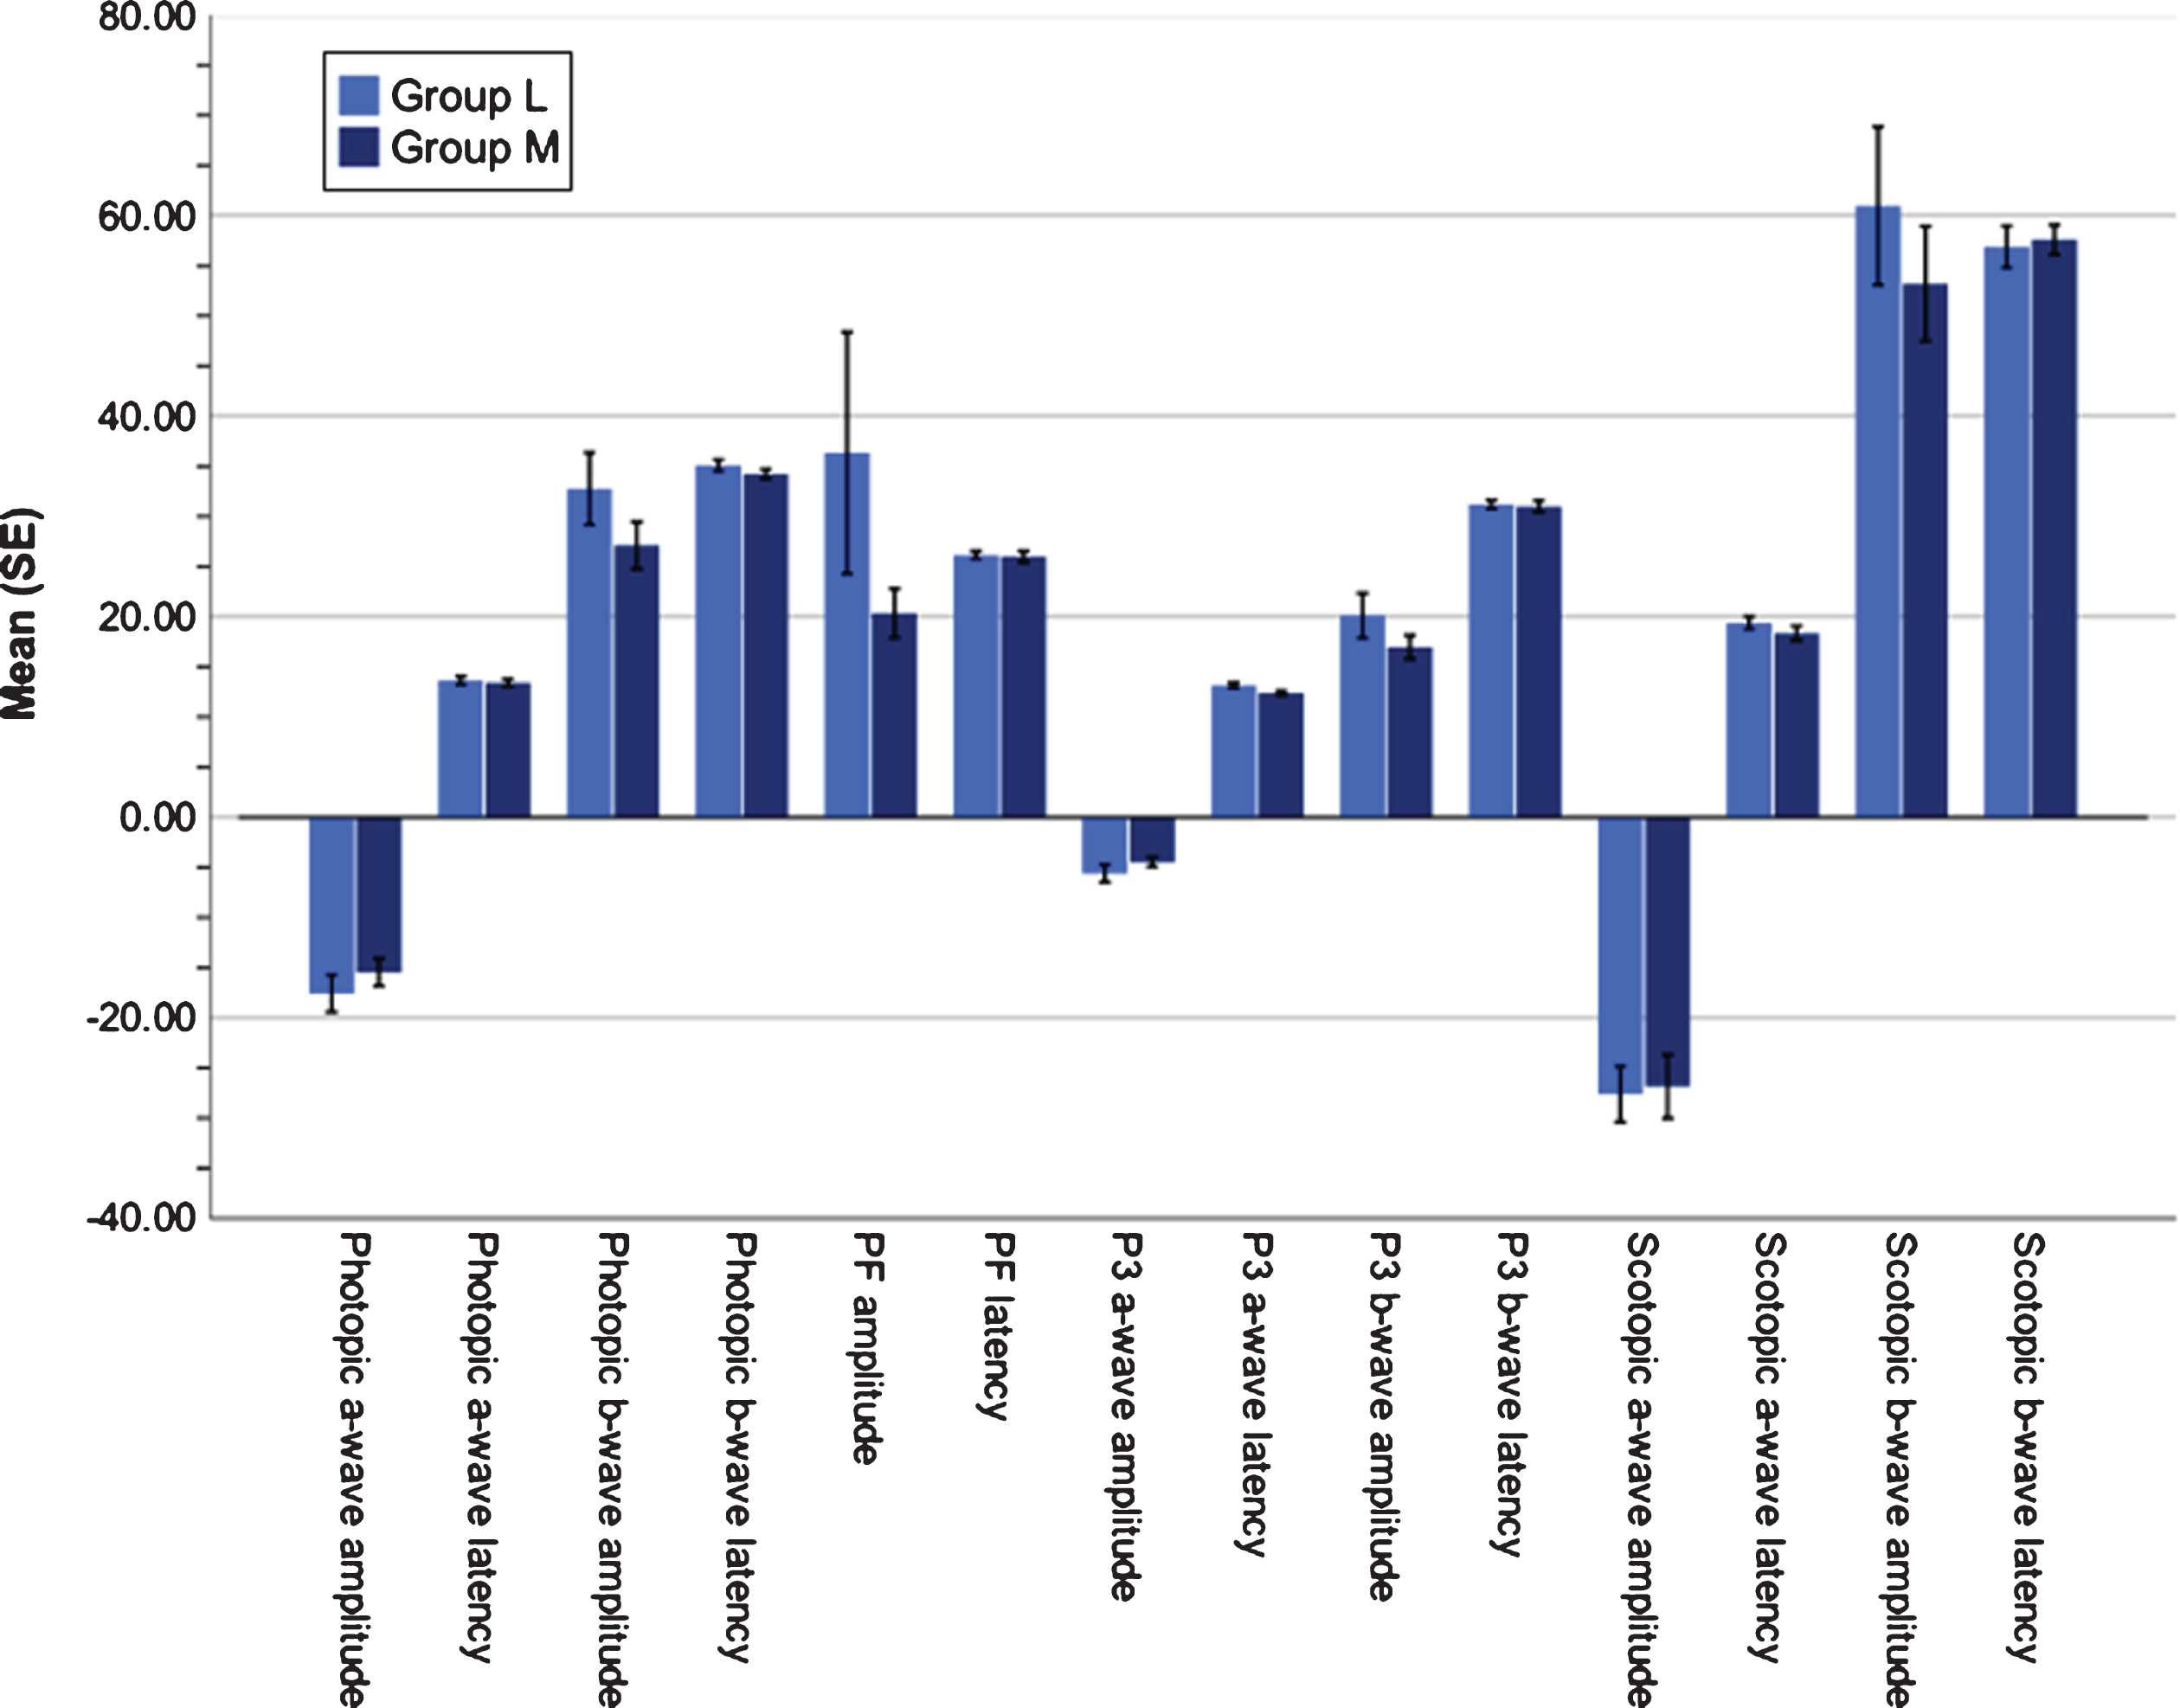
Means of the fERG parameters by group. Participants taking one antiparkinsonian medication or less (group L) is in light blue and participants taking two or more medications (group M) is in dark blue. Latency of the a-wave in the P3 (i.e., colored light test) condition was significantly longer in group L as compared to those taking two or more antiparkinsonian medications (group M; t(18) = –2.32, p = 0.03, d = 1.04). Error bars represent standard error (SE).
DISCUSSION
We explored the relationship between PD symptom manifestation, PD medication load and retinal activity, to generate data on the possible future use of fERG as a diagnostic and symptom-monitoring tool. Most notably, we observed a number of significant correlations between PD symptoms and retinal cell function. PD symptoms involving motor and physical functioning were consistently related to attenuated fERG amplitudes and shorter latencies. Conversely, non-motor and non-physical symptoms (e.g., cognitive, psychiatric) were associated with relatively larger fERG amplitudes and shorter latencies, though this pattern was less robust. In particular, abnormalities in photoreceptor cell (a-wave) activity appeared to be strongly related to clinical variables, with more severe motor and physical symptoms being associated with reductions in photoreceptor cell signaling (i.e., amplitude and latency), and more severe non-motor and non-physical symptoms being correlated with increased photoreceptor cell activity and decreased implicit time.
There are several potential explanations for the association between severity of motor and non-motor symptoms and shorter latencies. One such explanation is related to compensatory mechanisms which modulate DA activity in the CNS. According to Blesa et al. [37], while DA levels in the substantia nigra are typically reduced by 60% at the time of PD diagnosis, patients exhibit compensatory effects, including elevated DA synthesis and release, changes in DA metabolism, and alterations in DA receptors and transporter activity. These effects have been demonstrated at various areas of the brain [38], although to the best of our knowledge, they have not been studied in the retina.
Our finding that severity of motor symptoms in PD was related to decreases in fERG amplitudes is in line with previous studies that have reported reductions in fERG amplitudes in people with PD (i.e., [23–26]). Our data indicate that attenuated retinal cell activity in PD may be reflective of more widespread CNS disruptions involving motor functions and an advanced disease process. However, our results also suggest that non-motor and non-physical PD symptoms are related to greater retinal cell activity. Interestingly, some non-motor PD symptoms (e.g., cognitive, psychiatric) may emerge as secondary disease processes as opposed to a direct consequences of dopaminergic dysfunction and thus are less responsive to dopaminergic treatments [39, 40]. Moreover, several non-motor features may result from medication side effects [41]. Therefore, while data from this study and others (i.e., [23–26]) indicates that diminished retinal cell activity in PD may mirror broad CNS dopaminergic dysfunction, non-motor PD symptoms that are less DA driven may not be directly related to retinal cell functioning.
Interestingly, we found that later age of PD onset was strongly correlated with longer photoreceptor and bipolar-Müller cell implicit time, indicating that delays in retinal cell signaling may distinguish later onset PD patients from early onset patients. Indeed, previous literature suggests that certain PD biomarkers (e.g., CSF lactate, tau proteins) and clinical features (e.g., nonmotor symptoms, initial presentation, depression) may be linked with early or late age of onset [42, 43], whereas older age at onset is associated with greater disease burden [43]. Thus, prolonged fERG implicit time may be a marker of later age of onset and poorer clinical outcomes in PD.
We found an expected and statistically significant relationship between the number of antiparkinsonian medications prescribed and LED dose, wherein participants taking two or more medications had significantly higher LED dosages than participants receiving less medications. Interestingly, the two groups only differed on one fERG parameter. While this involved a test of cone function, which may reflect DA-agonist effects since cones rely heavily on DA for optimization of daytime vision, this was the single test on which the groups differed even without correction for multiple comparisons. Therefore, there was no robust effect of antiparkinsonian medication load on retinal functioning observed in this study, and the single significant finding we observed needs to replicated before accepting it as meaningful. These results are in contrast to an early study in PD in which improvements in fERG amplitudes and latencies were observed following administration of levodopa (i.e., [27]). Nevertheless, other studies have reported fERG anomalies in medication-free PD samples, suggesting that some fERG anomalies may reflect underlying disease processes as opposed to fluctuations in disease state.
Our study has several limitations. First and foremost, we did not have a control group, given the exploratory nature of this pilot trial. While this precludes determination of the degree of abnormality of waveform amplitude and latency relative to a “healthy sample”, it does not of course affect analysis of within-group correlations. Group differences on fERG tests between participants with PD and a control group have not always been found [24, 44], yet within group observations may be clinically relevant. Second, Part III of the MDS-UPDRS evaluation was not part of this research protocol. In this study, the number of PD medications was used as a proxy for motor disease severity; however, it is possible that the Part III score would have exhibited a stronger relationships with fERG parameters than the ones we observed. Third, our fERG protocol had several drawbacks, including relatively brief dark adaptation and light adaptation times and the usage of skin electrodes as opposed to corneal contact electrodes. However, a 10-minute dark adaptation period has been shown to lead to similar fERG results compared to a 20-minute period, with only slightly reduced b-wave amplitudes and similar latencies [45]. The noisier signal produced by skin electrodes compared to contact electrodes is mitigated for the most part by the use of repeated trials and averaging of results. Another issue is that we performed many correlational and between-group tests and did not correct for multiple comparisons, given the exploratory nature of the study and the small sample size. This increases the chance of false positive findings. Thus, all of the findings reported here should be considered as preliminary until replicated in an independent sample. More specifically, future research should focus on direct comparisons of the predictive validity of individual ERG parameters in a large sample of PD participants, to determine the smallest combination of tests needed to accurately assess the current and likely near-future status of individuals with PD.
In conclusion, the identification of objective biomarkers for PD holds great promise for early diagnosis and improved care, especially in atypical cases. Our study suggests that (a) a non-invasive, hand-held, portable fERG device can be used in assessment of people with PD; (b) fERG amplitudes and latencies may be differentially related to PD symptoms, and (c) future diagnostic protocols that examine fERG in PD should take into account the relationships between clinical characteristics and both sets (i.e., both amplitudes and latencies) of ERG parameters.
CONFLICT OF INTEREST
The authors have no conflict of interest to report.
DATA AVAILABILITY
The data used to support the findings of this study, including test results, are included in the supplementary information files.
Footnotes
ACKNOWLEDGMENTS
The research was funded by Rutgers University Behavioral Health Care. Dr. Roni Netser was partially supported by Shalvata Mental Health Center.